[Preprint]. 2024 Dec 2:2023.11.09.566412.
doi: 10.1101/2023.11.09.566412.

Fold-and-fuse neurulation in zebrafish requires Vangl2

Affiliations

Fold-and-fuse neurulation in zebrafish requires Vangl2

Jacalyn MacGowan et al. bioRxiv. .

Update in

Abstract

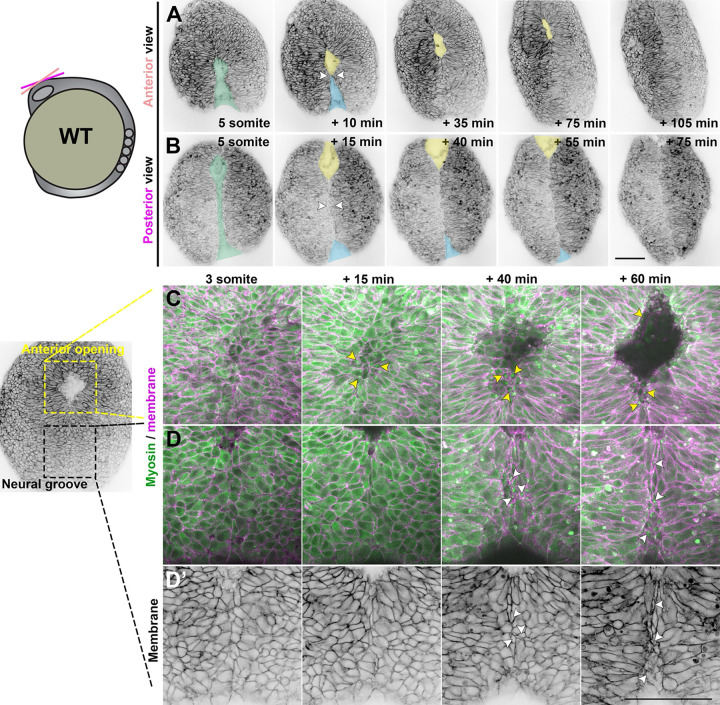
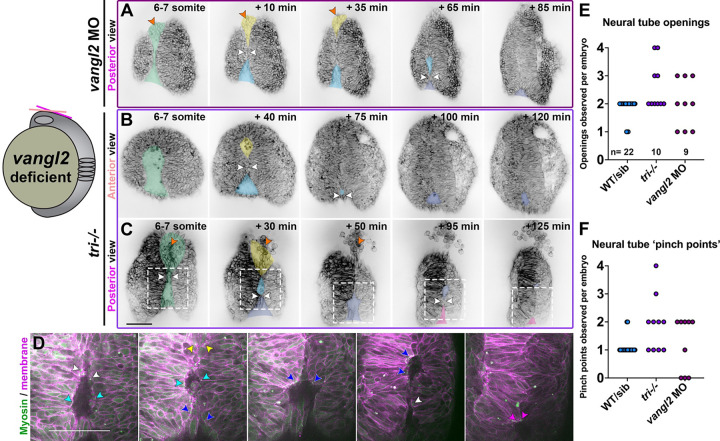
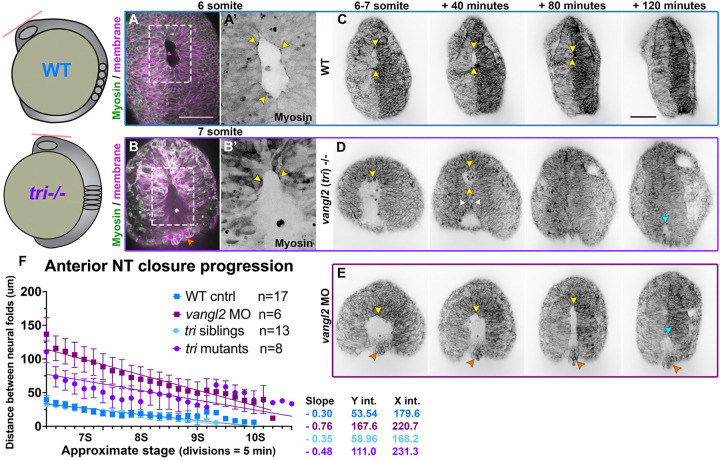
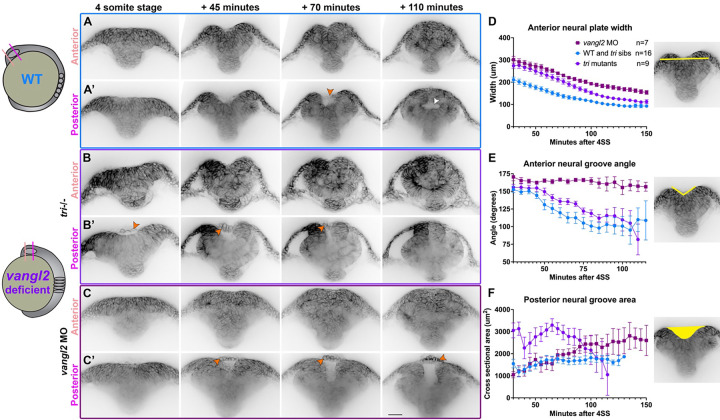
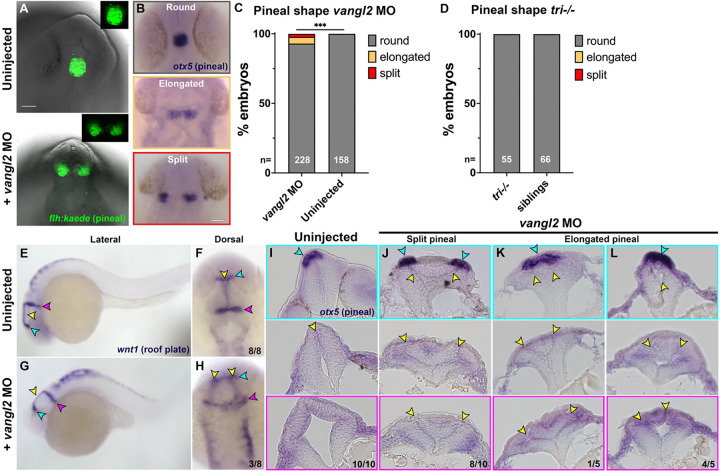
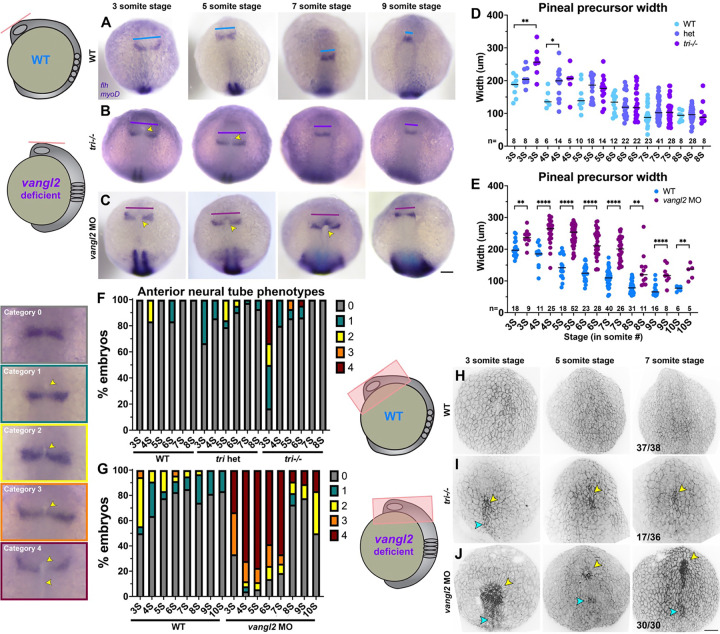
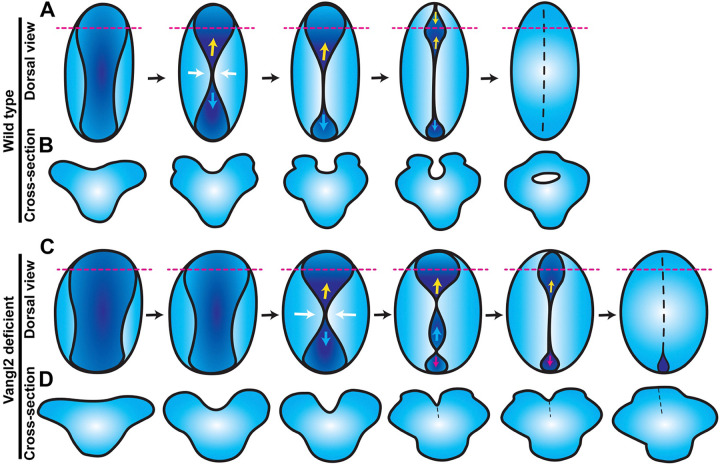
Shaping of the future brain and spinal cord during neurulation is an essential component of early vertebrate development. In amniote embryos, primary neurulation occurs through a "fold-and-fuse" mechanism by which the edges of the neural plate fuse into the hollow neural tube. Failure of neural fold fusion results in neural tube defects (NTDs), which are among the most devastating and common congenital anomalies worldwide. Unlike amniotes, the zebrafish neural tube develops largely via formation of a solid neural keel that later cavitates to form a midline lumen. Although many aspects of primary neurulation are conserved in zebrafish, including neural fold zippering, it was not clear how well these events resemble analogous processes in amniote embryos. Here, we demonstrate that despite outward differences, zebrafish anterior neurulation closely resembles that of mammals. For the first time in zebrafish embryos, we directly observe enclosure of a lumen by the bilateral neural folds, which fuse by zippering between at least two distinct closure sites. Both the apical constriction that elevates the neural folds and the zippering that fuses them coincide with apical Myosin enrichment. We further show that embryos lacking vangl2, a core planar cell polarity and NTD risk gene, exhibit delayed and abnormal neural fold fusion that fails to enclose a lumen. These defects can also be observed in fixed embryos, enabling their detection without live imaging. Together, our data provide direct evidence for fold-and-fuse neurulation in zebrafish and its disruption upon loss of an NTD risk gene, highlighting the deep conservation of primary neurulation across vertebrates.

Keywords: Neural tube defects; Neurulation; Planar cell polarity; Vangl2; Zebrafish.


Conflict of interest statement

Competing Interests The authors declare no competing interests.

Figures

Figure 1.
Figure 1.. Neural fold fusion proceeds bidirectionally from a central “pinch point”.
A-B) Still frames from time-lapse series of anterior neural tube development in WT or tri sibling embryos expressing membrane GFP or mCherry beginning at the 5 somite stage, viewed dorsally from more anterior (A) or posterior (B) positions. Green shading indicates the early neural groove, white arrowheads indicate the pinch point at which the bilateral neural folds make contact. Thereafter, yellow and blue shading indicate the anterior and posterior openings, respectively. Each image series is a single Z plane from a confocal stack and is representative of 30 individual WT and sibling embryos imaged in 8 independent trials. Additional examples are shown in Supp. Fig. 1 and Supp. videos 1–4. C-D’) Live images of the anterior (C) and posterior (D-D’) neural groove of a representative WT embryo expressing membrane Cherry (magenta in C-D, black in D’) and the Sf9-mNeon Myosin reporter (green) at the stages indicated. Arrows highlight Myosin localization to the medial apical cortex of apically constricted cells. The embryo image to the left is at the approximately + 50 minute time point. Anterior is up in all images, scale bars = 100 μm.
Figure 2.
Figure 2.. The neural folds of vangl2 deficient embryos exhibit ectopic closure points.
A-C) Still frames from time-lapse series of anterior neural tube development in vangl2 morphant (A) or tri−/− embryos (B-C) expressing membrane GFP or mCherry beginning at the 5-somite stage, viewed dorsally from more anterior (B) or posterior (A, C) positions. Green shading indicates the early neural groove, white arrowheads indicate pinch points at which the bilateral neural folds make contact. Yellow and blue shading indicate the initial anterior and posterior openings, respectively. Indigo and pink shading indicate new openings formed by “pinching” of the initial posterior opening. Each image series is a single Z plane from a confocal stack and is representative of 8 morphant and 10 mutant embryos imaged in 2 or 4 independent trials, respectively. D) Enlargements of regions in (C) within dashed boxes showing membrane Cherry in magenta and the Sf9-mNeon Myosin reporter in green. Arrows highlight Myosin localization to the edges of neural fold openings. The colors of the arrowheads correspond to the color of shading in (C). E-F) Quantification of the number of neural fold openings (E) and pinch points (F) observed in time-lapse series of embryos of the conditions indicated. Each dot represents a single embryo from 2 WT, 2 vangl2 morphant, and 4 tri independent trials. Anterior is up in all images, scale bars = 100 μm. See also Supp. videos 6–8.
Figure 3.
Figure 3.. Neural fold fusion is delayed in vangl2 deficient embryos.
A-B’) Live images of the anterior neural tube of WT (A) and tri−/− (B) embryos expressing membrane Cherry (magenta) and the Sf9-mNeon Myosin reporter (green in A-B, black in prime panels) at the stages indicated. Areas in dashed boxed are enlarged in the prime panels depicting Sf9-mNeon only. Yellow arrows highlight Myosin localization to the edges of the anterior neural opening. Orange arrow shows cells protruding from the opening of tri−/− embryos. C-E) Still frames from time-lapse series of anterior neural tube development in WT (C), tri−/− mutant (D), and vangl2 morphant (E) embryos expressing membrane GFP or mCherry beginning at 6–7 somite stage, viewed dorsally. Yellow arrowheads indicate the anterior edge of the eye-shaped opening, white arrowheads indicate the pinch point, cyan arrowheads indicate the posterior opening, and orange arrowheads show cells protruding from the neural groove of vangl2 morphants. Each image series is a single Z plane from a confocal stack and is representative of multiple embryos of that condition (see n values for each condition in F). F) Distance between the bilateral neural folds over time in embryos of the conditions indicated, beginning when the eye-shaped opening forms at the 6-somite stage. Symbols are mean + SEM, lines are simple linear regressions, for which slopes and intercepts are provided. n values indicate the number of embryos measured of each condition from 2 independent vangl2 MO and 4 independent tri mutant trials. Anterior is up in all images, scale bars = 100 μm. See also Supp. videos 5, 8.
Figure 4.
Figure 4.. The bilateral neural folds fuse dorsally to enclose a lumen in WT, but not vangl2 deficient embryos.
A-C’) Still frames from time-lapse series of neural fold fusion in WT (A), tri−/− mutant (B), and vangl2 morphant (C) embryos expressing membrane GFP or mCherry beginning at the 4-somite stage, viewed in transverse optical section through anterior (A-C) or posterior (A’-C’) regions of the forebrain. Orange arrowheads indicate periderm cells spanning the neural groove. Each image series is a single representative Z plane from a confocal stack. D-F) Measurements of neural plate width (D) and neural groove angle (E) within the anterior forebrain region and cross-sectional area of the neural groove (F) within the posterior forebrain region in embryos of the conditions indicated, beginning at 4-somite stage. Symbols are mean + SEM, n values indicate the number of embryos measured of each condition from 2 independent vangl2 MO and 3 independent tri mutant trials. Control embryos for MO and mutant experiments were combined in graphs (blue lines) for simplicity. Images to the right are illustrative of the measurements made. Dorsal is up in all images, scale bar = 50 μm. See also Supp. videos 9–11.
Figure 5.
Figure 5.. Pineal and roof plate morphology are disrupted in a subset of vangl2 deficient embryos.
A) Example images of pineal precursor morphology in Tg[flh:kaede] control (top) or vangl2 MO-injected (bottom) embryos at 28 hpf, viewed from the dorsal side. B) Examples of the three classes of pineal precursor morphology visualized by WISH for otx5. C-D) Classification of pineal shape in 28 hpf control and vangl2 MO-injected (C) or tri−/− mutant (D) embryos expressing flh:kaede or WISH stained for otx5. n values indicate the number of embryos of each condition measured from 3 independent trials. ***p=0.0006, Fisher’s exact test. Scale bars = 50 μm. E-H) WISH for roof plate marker wnt1 at 28 hpf in control (E-F) and vangl2 MO-injected (G-H) embryos. Yellow arrowheads indicate the midline roof plate, cyan arrowheads indicate the epithalamus, and magenta arrowheads indicate the mid-hindbrain boundary (MHB). I-L) Transverse histological sections through the anterior neural tube at the level of the epithalamus (top panels), midbrain (middle panels), and MHB (bottom panels) in 28 hpf embryos of the conditions indicated. Cyan arrowheads indicate pineal precursors stained by otx5 WISH. Yellow arrowheads indicate the neural tube midline(s)/lumen(s). Fractions indicate the number of embryos with the depicted phenotype over the total number of embryos examined for each condition. Anterior is up in (A-B, F, H), dorsal is up in (E, G, I-L).
Figure 6.
Figure 6.. Fixed vangl2 deficient embryos exhibit apparent delayed pineal convergence and openings in the anterior neural plate.
A-C) Representative images of pineal precursors (flh WISH) and somites/adaxial cells (myoD WISH) in control (A), tri−/− mutant (B), and vangl2 MO-injected (C) embryos at the stages indicated, viewed dorsally. Blue, purple, and burgundy lines indicate pineal precursor width, yellow arrowheads indicate apparent openings in the anterior neural plate. D-E) Width of pineal precursor domains (as shown in A-C) in embryos from tri+/− incrosses (D) and in control (blue) and vangl2 morphant (burgundy) embryos (E) at the stages indicated. Each dot represents a single embryo, black bars are median values. n values indicate the number of embryos of each stage/condition measured from 3 independent trials, **p=0.005, *p=0.045, Welch’s ANOVA with Dunnett’s multiple comparisons (D), **p<0.01, ****p<0.0001, multiple T-tests (E). F-G) Percentage of tri+/− incross (F) or vangl2 morphant and control (G) embryos (as shown in A-C) at the stages indicated exhibiting the categories of anterior neural plate phenotypes shown on the left. n values as in D-E. H-J) 3-dimensional reconstructions of confocal Z-stacks through the anterior neural plate of fixed and phalloidin-stained embryos, viewed dorsally, of the stages and conditions indicated. Yellow arrowheads indicate apparent anterior openings, cyan arrowheads indicate openings in more posterior regions. Fractions indicate the number of embryos with the pictured phenotype over the number of embryos examined for each condition from 3 independent trials. Anterior is up in all images, scale bars = 100 μm.
Figure 7.
Figure 7.. Model for anterior neural tube closure in zebrafish embryos.
A) Diagram of the anterior (brain region) neural plate in WT zebrafish embryos from approximately 4–10 somite stage, viewed from the dorsal surface with anterior to the top. A shallow neural groove (dark blue) forms at the dorsal midline between the bilateral neural folds (light blue). The neural folds come together at a central “pinch point” (white arrows), creating anterior and posterior openings. The posterior opening zippers closed caudally from the pinch point (cyan arrows) and the anterior opening goes on to form an eye-shaped opening in the forebrain region. The anterior edge of the eye-shaped opening zippers toward the posterior while its posterior edge zippers anteriorly, closing the eye-shaped opening from both sides (yellow arrows). The posterior opening continues to zipper toward the hindbrain until the neural folds in the entire brain region have fused. Dashed magenta lines represent the positions of the cross-sectional views shown in (B). B) Cross-sectional views of the anterior WT neural plate at the position of the dashed magenta lines in (A), dorsal is up. A U-shaped neural groove forms between the bilateral neural folds, which approach the midline and then fuse dorsally to enclose a hollow lumen. C) Diagram of anterior neural plate morphogenesis in vangl2 deficient embryos. The neural plate and groove begin wider and are delayed in the formation of the first pinch point (white arrows) and neural fold fusion. Additional pinch points form int the posterior opening, creating an additional opening that zippers closed (magenta arrows). D) Cross-sectional views of the anterior vangl2 deficient neural plate at the position of the dashed magenta lines in (C), dorsal is up. The forebrain forms a V-shaped neural groove that seals up from ventral to dorsal rather than enclosing a lumen.

References

    1. Parker S. E. et al., Updated National Birth Prevalence estimates for selected birth defects in the United States, 2004–2006. Birth Defects Res A Clin Mol Teratol 88, 1008–1016 (2010). - PubMed
    1. Zaganjor I. et al., Describing the Prevalence of Neural Tube Defects Worldwide: A Systematic Literature Review. PLoS One 11, e0151586 (2016). - PMC - PubMed
    1. Williams M., Yen W., Lu X., Sutherland A., Distinct apical and basolateral mechanisms drive planar cell polarity-dependent convergent extension of the mouse neural plate. Dev Cell 29, 34–46 (2014). - PMC - PubMed
    1. Ybot-Gonzalez P. et al., Convergent extension, planar-cell-polarity signalling and initiation of mouse neural tube closure. Development 134, 789–799 (2007). - PMC - PubMed
    1. Massarwa R., Ray H. J., Niswander L., Morphogenetic movements in the neural plate and neural tube: mouse. Wiley Interdiscip Rev Dev Biol 3, 59–68 (2014). - PubMed

Publication types