[Preprint]. 2023 Nov 8:2023.11.08.23298229.
doi: 10.1101/2023.11.08.23298229.

MSGene: Derivation and validation of a multistate model for lifetime risk of coronary artery disease using genetic risk and the electronic health record

Affiliations

MSGene: Derivation and validation of a multistate model for lifetime risk of coronary artery disease using genetic risk and the electronic health record

Sarah M Urbut et al. medRxiv. .

Update in

Abstract

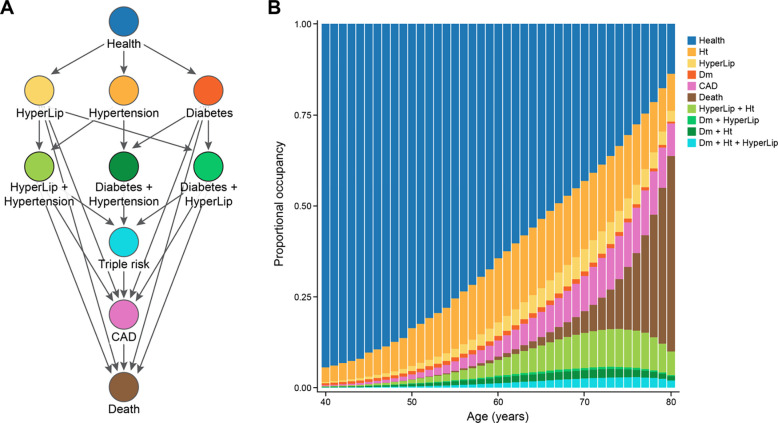
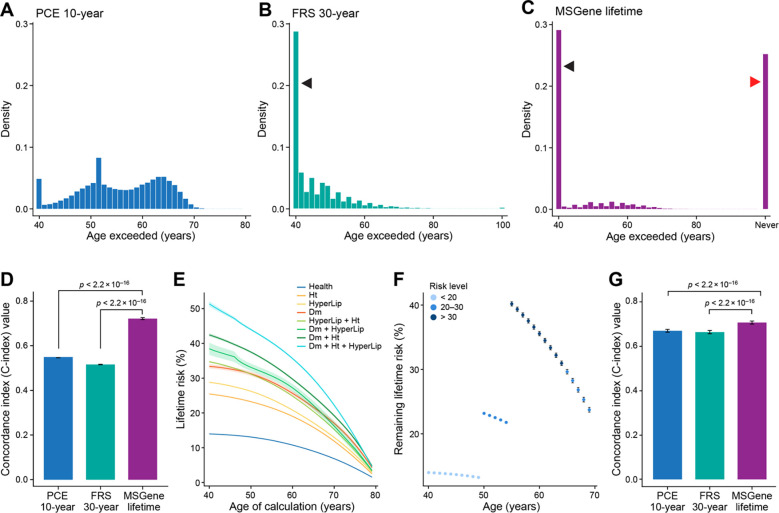
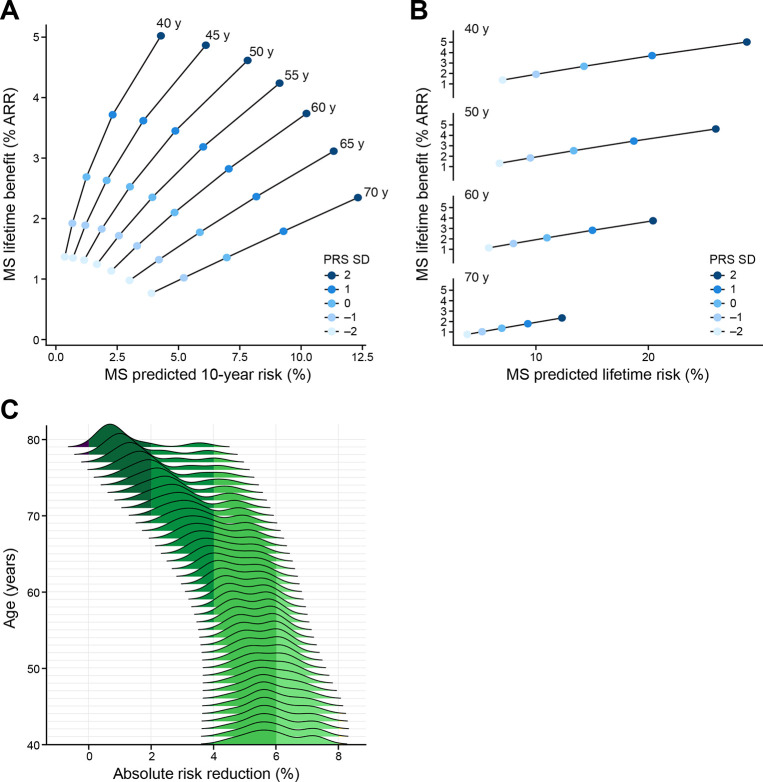
Currently, coronary artery disease (CAD) is the leading cause of death among adults worldwide. Accurate risk stratification can support optimal lifetime prevention. We designed a novel and general multistate model (MSGene) to estimate age-specific transitions across 10 cardiometabolic states, dependent on clinical covariates and a CAD polygenic risk score. MSGene supports decision making about CAD prevention related to any of these states. We analyzed longitudinal data from 480,638 UK Biobank participants and compared predicted lifetime risk with the 30-year Framingham risk score. MSGene improved discrimination (C-index 0.71 vs 0.66), age of high-risk detection (C-index 0.73 vs 0.52), and overall prediction (RMSE 1.1% vs 10.9%), with external validation. We also used MSGene to refine estimates of lifetime absolute risk reduction from statin initiation. Our findings underscore the potential public health value of our novel multistate model for accurate lifetime CAD risk estimation using clinical factors and increasingly available genetics.


Conflict of interest statement

DISCLOSURES During the course of the project, M.W.Y. became a full-time employee of GSK. A.C.F. is co-founder of Goodpath. PTE reports personal fees from Bayer AG, Novartis, and MyoKardia. GP holds equity in Phaeno Biotechnologies, is on the SAB of RealmIDX and currently consults for Delphi Diagnostics. P.N. reports research grants from Allelica, Apple, Amgen,Boston Scientific, Genentech / Roche, and Novartis, personal fees from Allelica, Apple, AstraZeneca, Blackstone Life Sciences, Foresite Labs, Genentech / Roche, GV, HeartFlow, Magnet Biomedicine, and Novartis, scientific advisory board membership of Esperion Therapeutics, Preciseli, and TenSixteen Bio, scientific co-founder of TenSixteen Bio, equity in MyOme, Preciseli, and TenSixteen Bio, and spousal employment at Vertex Pharmaceuticals, all unrelated to the present work. The remaining authors have nothing to disclose.

Figures

Figure 1.
Figure 1.. Multistate transitions over time.
A. We depict the potential one-step transitions in our multistate framework. Per year, an individual can progress from health to single risk factor states, CAD or death. Similarly, an individual can progress from single risk factor states, to double risk factor states, to CAD or death; from double risk factor states, to triple risk factor, CAD or death. B. We display the proportional occupancy excluding censored individuals at each state. M CAD: coronary artery disease, Ht: hypertension, HyperLip: hyperlipidemia, Dm: Type 2 diabetes mellitus.
Figure 2.
Figure 2.. Study overview.
A. Using the UK Biobank data on half a million participants (54% female) with access to health record from 1940, we harmonize hospitalization, prescription and primary care records from the EHR and train our model on individuals free of CAD at age 40. The UKB required participants to be between ages 40–69 between 2006–2010 for genotyping. In our model, individuals join disease-free in the ‘health’ state and progress to additional states upon censoring. We use 80% of the eligible data for training and the remaining 20% for testing. For the testing subset we require that individuals have variables necessary for computation of FRS30 (and FRS30RC) and the pooled cohort equations, which require laboratory (HDL, TC) and biometric (SBP) measurements. B. For a sample patient, we document the construction of our cohort. This individual is first observed in the health record at age 25; he is diagnosed with hypertension at age 39, and begins informing our risk estimation for CAD at age 40 in the hypertensive category. He transitions to the hypertension and hyperlipidemia category at age 50, 25 years after first encounter and 10 years after entering our risk estimation, thus contributing 10 years of data. TC: total cholesterol, SBP: systolic blood pressure, HDL: high-density lipoprotein, CAD: coronary artery disease, FRS30: Framingham 30 year, FRS30RC: Framingham 30 year recalibrated, PCE: Pooled cohort equation 10-year risk; EHR: electronic health record.
Figure 3.
Figure 3.. Survival, 10-year and lifetime risk curves.
In A., we demonstrate the singular projected survival curve by MSGene for an individual at age 40 of low, medium or high genomic risk. In B. we demonstrate the MSGene predicted 10-year risk for individuals at each age along the x-axis, showing that, in general, for fixed window approaches, 10-year risk is monotonically increasing. In C, we demonstrate the MSGene predicted lifetime risk curve for individuals at each age featured along the x-axis under an untreated (dashed) or treated (solid) strategy. The conditional remaining lifetime risk declines with age, from 24% for a high genomic risk individual in our cohort to <5% for an individual at the same risk level by age 70. In D, using the FRS30RC equation, like 10-year risk and unlike the remaining lifetime risk approach, 30-year risk calculation is monotonically increasing, from 13.4 (13.2–13.6%) at age 40 to 32.9% at age 70 for an individual of the highest genomic risk. FRS30RC: Framingham 30 year recalibrated.
Figure 4:
Figure 4:. Time-dependent threshold analysis.
We consider the distribution of the first age at which an individual exceeds the PCE-derived 10-year threshold of 5% (A), or lifetime threshold or 10% using FRS30RC (B) or the MSGene lifetime prediction (C). We then use this age as a time-dependent predictor of time-to-event in a time-dependent Cox PH (Supp. methods) in which an individual’s time followed is stratified by start time and periods in which a threshold is passed, and final censoring time with an indicator variable demarcating whether or not each threshold has been surpassed. We left censor these intervals at age of enrollment conservatively to exclude time protected from death. We report Harrell’s C-index (p<2×10¹⁶) for discrimination on how well a model predicts events that tend to occur earlier versus later. Left-facing indicate individuals who surpass the threshold at first prediction, and right-facing arrow indicates individuals who never surpass a threshold for a given metric. FRS30RC is shown here with C-index 0.52 (original FRS30 C-index 0.50) vs. MSGene 0.72, p<2×10¹⁶) (D). We compute the lifetime prediction at each age under one of eight potential risk starting states, with bootstrapped confidence intervals for a sample individual (E). Using the electronic health record, we extract state position for each individual per year. We then use MSGene to compute predicted risk for each individual at each state in time, displayed here for a sample individuals (F). We use these as predictors in a time-dependent Cox model in which we expand the data set into non-overlapping intervals for each individual (Supp. methods; Supp. Fig. 17) and conservatively left censor before enrollment to avoid time protected from death. We evaluate the concordance when compared to FRS30RC and PCE-derived 10-year, p<2.2×10¹⁶ (G). FRS30RC: Framingham 30-year recalibrated, PCE: pooled cohort equations, Cox PH: Cox proportional hazards model
Figure 5:
Figure 5:. Absolute risk reduction: Short-term and lifetime risk.
We display the relationship between remaining lifetime and 10-year risk. Each ray represents an age group, in which individuals are parameterized by their short- (10-year) and long-term (lifetime) risk, and colored by genomic risk in SD from mean. We display the lifetime absolute risk reduction as computed in Equation RR and stratified by age rays, and colored by genetic risk. (A) For an individual at the top genetic risk at age 40, MSGene predicted 10-year risk is roughly equivalent to an individual at the lowest genetic risk at age 70 (3.8% vs 4.2%, SE 0.01). However, the MSGene projected lifetime benefit is directly proportional to lifetime risk (B), and more than twice that of a high risk individual at age 70 (5.0 vs 2.3%, SEM 0.02). (C) Marginalized across starting states and covariate profiles, we project absolute risk difference (%) under a treated and untreated setting. At age 40, this ranges from a median of 5.8% (SD 0.01) to 0.8% (SD 0.01) at age 79. SEM: standard error of mean, RR: relative risk, SD: CAD-PRS SD.

References

    1. Tsao CW, Aday AW, Almarzooq ZI, Anderson CAM, Arora P, Avery CL, Baker-Smith CM, Beaton AZ, Boehme AK, Buxton AE, Commodore-Mensah Y, Elkind MSV, Evenson KR, Eze-Nliam C, Fugar S, Generoso G, Heard DG, Hiremath S, Ho JE, Kalani R, Kazi DS, Ko D, Levine DA, Liu J, Ma J, Magnani JW, Michos ED, Mussolino ME, Navaneethan SD, Parikh NI, Poudel R, Rezk-Hanna M, Roth GA, Shah NS, St-Onge M-P, Thacker EL, Virani SS, Voeks JH, Wang N-Y, Wong ND, Wong SS, Yaffe K, Martin SS, Subcommittee on behalf of the AHAC on E and PSC and SS. Heart Disease and Stroke Statistics—2023 Update: A Report From the American Heart Association. Circulation [Internet]. 2023. [cited 2023 May 20];Available from: 10.1161/CIR.0000000000001123 - DOI - PubMed
    1. Lloyd-Jones DM, Leip EP, Larson MG, D’Agostino RB, Beiser A, Wilson PWF, Wolf PA, Levy D. Prediction of Lifetime Risk for Cardiovascular Disease by Risk Factor Burden at 50 Years of Age. Circulation. 2006;113:791–798. - PubMed
    1. Wilkins JT, Karmali KN, Huffman MD, Allen NB, Ning H, Berry JD, Garside DB, Dyer A, Lloyd-Jones DM. Data Resource Profile: The Cardiovascular Disease Lifetime Risk Pooling Project. Int J Epidemiol. 2015;44:1557–1564. - PMC - PubMed
    1. Bundy JD, Ning H, Zhong VW, Paluch AE, Lloyd-Jones DM, Wilkins JT, Allen NB. Cardiovascular Health Score and Lifetime Risk of Cardiovascular Disease. Circulation: Cardiovascular Quality and Outcomes [Internet]. 2020. [cited 2023 Jun 13];Available from: 10.1161/CIRCOUTCOMES.119.006450 - DOI - PMC - PubMed
    1. Grundy SM, Stone NJ, Bailey AL, Beam C, Birtcher KK, Blumenthal RS, Braun LT, de Ferranti S, Faiella-Tommasino J, Forman DE, Goldberg R, Heidenreich PA, Hlatky MA, Jones DW, Lloyd-Jones D, Lopez-Pajares N, Ndumele CE, Orringer CE, Peralta CA, Saseen JJ, Smith SC, Sperling L, Virani SS, Yeboah J. 2018 AHA/ACC/AACVPR/AAPA/ABC/ACPM/ADA/AGS/ APhA/ASPC/NLA/PCNA Guideline on the Management of Blood Cholesterol: Executive Summary. Circulation. 2019;139:e1082–e1143. - PMC - PubMed

Publication types