[Preprint]. 2023 Oct 10:2023.10.10.561702.
doi: 10.1101/2023.10.10.561702.

In vivo disentanglement of diffusion frequency-dependence, tensor shape, and relaxation using multidimensional MRI

Affiliations

In vivo disentanglement of diffusion frequency-dependence, tensor shape, and relaxation using multidimensional MRI

Jessica T E Johnson et al. bioRxiv. .

Update in

Abstract

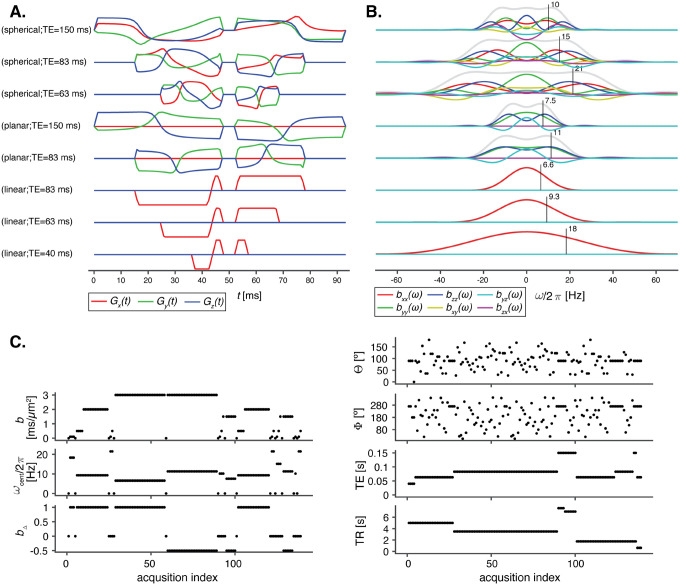
Diffusion MRI with free gradient waveforms, combined with simultaneous relaxation encoding, referred to as multidimensional MRI (MD-MRI), offers microstructural specificity in complex biological tissue. This approach delivers intravoxel information about the microstructure, local chemical composition, and importantly, how these properties are coupled within heterogeneous tissue containing multiple microenvironments. Recent theoretical advances incorporated diffusion time dependency and integrated MD-MRI with concepts from oscillating gradients. This framework probes the diffusion frequency, ω, in addition to the diffusion tensor, D, and relaxation, R1, R2, correlations. A D(ω)-R1-R2 clinical imaging protocol was then introduced, with limited brain coverage and 3 mm3 voxel size, which hinder brain segmentation and future cohort studies. In this study, we introduce an efficient, sparse in vivo MD-MRI acquisition protocol providing whole brain coverage at 2 mm3 voxel size. We demonstrate its feasibility and robustness using a well-defined phantom and repeated scans of five healthy individuals. Additionally, we test different denoising strategies to address the sparse nature of this protocol, and show that efficient MD-MRI encoding design demands a nuanced denoising approach. The MD-MRI framework provides rich information that allows resolving the diffusion frequency dependence into intravoxel components based on their D(ω)-R1-R2 distribution, enabling the creation of microstructure-specific maps in the human brain. Our results encourage the broader adoption and use of this new imaging approach for characterizing healthy and pathological tissues.

Keywords: denoising; diffusion tensor distribution; diffusion time dependency; diffusion-relaxation; human brain.


Figures

FIGURE 1
FIGURE 1
Key experimental details. (A) Time-dependent effective gradients G(t) and (B) corresponding tensor-valued encoding spectra b(ω) for linear, planar, and spherical encoding at different echo times and centroid frequencies, denoted by black vertical lines. (C) Acquisition protocol with repetition time TR, echo time TE, as well as b-tensor magnitude b, normalized anisotropy bΔ (planar: −0.5, spherical: 0, linear: 1), orientation (Θ, Φ), and centroid frequency ωcent/2π, versus image acquisition index.
FIGURE 2
FIGURE 2
Schematic description of the evaluated denoising strategies. The Reference pipeline did not include any processing steps besides reorientation to the anatomical image space. In Strategies 2 and 3, all volumes, regardless of TE/TR and b-tensor encoding design, were initially combined into a single dataset. The MPPCA denoising step was skipped in Strategy 2, and turned on in Strategy 3. For Strategy 4, all datasets were grouped according to echo time prior to denoising. The grouped data were then combined again after denoising for the remainder of the pipeline.
FIGURE 3
FIGURE 3
Effect of denoising strategy on the model fit root-mean-square error (RMSE). (A) Normalized RMSE for each measurement (image volume) averaged over the isotropic (top) and anisotropic (bottom) ROIs, color coded according to denoising strategies. (B) Distribution of normalized RMSE over voxels within each ROI, color coded according to denoising strategies.
FIGURE 4
FIGURE 4
Representative phantom voxels from the isotropic (blue) and anisotropic (red) ROIs. (A) Bin segmentation between the two components representing partial integration regions in the 2D DisoDΔ2 plane. (B) The resulting isotropic and anisotropic signal fraction maps, color-coded (blue=isotropic, red=anisotropic). (C) Single-voxel attenuation profiles (colored circles) and their fits (black dots). (D) D(ω)R1R2 distributions for each voxel projected onto the 2D DisoDΔ2, DisoR1, and DisoR2 planes for five frequencies in the range of ω/2π=6.621 Hz as indicated with the linear gray scale of the contour lines.
FIGURE 5
FIGURE 5
Parameter maps of the diffusion phantom derived from voxelwise D(ω)R1R2 distributions. (A) Voxelwise means E[x], variances V[x], and covariances C[x,y] at a selected encoding frequency ω/2π=6.6 Hz. (B) Parameter maps of the rate of change with frequency, Δω/2πE[x]. (C) Bin-resolved maps of E[x] and Δω/2πE[x] according to Fig. 4 A. The brightness and color scales represent, respectively, the signal fractions and the values of each parameter.
FIGURE 6
FIGURE 6
Assessing the impact different denoising strategies had on the MD-MRI pipeline and estimates. (A) Whole brain EMD histograms averaged across the five subjects for each denoising method. Error bars represent standard deviations. (B) Voxelwise EMD distributions across the study population for each denoising strategy. (C) Maps of the voxelwise EMD between D(ω)R1R2 distributions at ω=6.6 Hz over two scans from a representative subject for each denoising strategy. High intensities correspond to low D(ω)R1R2 distributions reproducibility. White arrows point to the areas with elevated variability.
FIGURE 7
FIGURE 7
Parameter maps of a representative subject derived from voxelwise D(ω)R1R2 distributions. (A) S0 map displayed in gray scale, diagram with the division of the 2D DisoDΔ2 projection into three bins (bin1, bin2, bin3), and the resulting signal fractions (fbin1,fbin2,fbin3) coded into RGB color. (B) Per-voxel means E[x], variances V[x], and covariances C[x, y] at a selected encoding frequency /2π=6.6 Hz. (C) Parameter maps of the rate of change with frequency, Δω/2πE[x]. (D) Bin-resolved maps of E[x] and Δω/2πE[x]. The brightness and color scales represent, respectively, the signal fractions and the values of each parameter.

Similar articles

References

    1. Aggarwal M., Jones M. V., Calabresi P. A., Mori S., & Zhang J. (2012, January). Probing mouse brain microstructure using oscillating gradient diffusion mri. Magnetic Resonance in Medicine, 67, 98–109. doi: 10.1002/mrm.22981 - DOI - PMC - PubMed
    1. Arbabi A., Kai J., Khan A. R., & Baron C. A. (2020, June). Diffusion dispersion imaging: Mapping oscillating gradient spin-echo frequency dependence in the human brain. Magnetic Resonance in Medicine, 83, 2197–2208. doi: 10.1002/mrm.28083 - DOI - PubMed
    1. Baron C. A., & Beaulieu C. (2014, September). Oscillating gradient spin-echo (ogse) diffusion tensor imaging of the human brain. Magnetic Resonance in Medicine, 72, 726–736. doi: 10.1002/mrm.24987 - DOI - PubMed
    1. Basser P. J., Mattiello J., & LeBihan D. (1994, January). Mr diffusion tensor spectroscopy and imaging. Biophysical Journal, 66, 259–67. doi: 10.1016/S0006-3495(94)80775-1 - DOI - PMC - PubMed
    1. Beaulieu C. (2002, November). The basis of anisotropic water diffusion in the nervous system - a technical review. NMR in Biomedicine, 15, 435–455. doi: 10.1002/nbm.782 - DOI - PubMed

Publication types

LinkOut - more resources