

Adult neural stem cells and neurogenesis are resilient to intermittent fasting
- PMID: 37987220
- PMCID: PMC10702802
- DOI: 10.15252/embr.202357268
Adult neural stem cells and neurogenesis are resilient to intermittent fasting
Abstract
Intermittent fasting (IF) is a promising strategy to counteract ageing shown to increase the number of adult-born neurons in the dentate gyrus of mice. However, it is unclear which steps of the adult neurogenesis process are regulated by IF. The number of adult neural stem cells (NSCs) decreases with age in an activation-dependent manner and, to counteract this loss, adult NSCs are found in a quiescent state which ensures their long-term maintenance. We aimed to determine if and how IF affects adult NSCs in the hippocampus. To identify the effects of every-other-day IF on NSCs and all following steps in the neurogenic lineage, we combined fasting with lineage tracing and label retention assays. We show here that IF does not affect NSC activation or maintenance and, that contrary to previous reports, IF does not increase neurogenesis. The same results are obtained regardless of strain, sex, diet length, tamoxifen administration or new-born neuron identification method. Our data suggest that NSCs maintain homeostasis upon IF and that this intervention is not a reliable strategy to increase adult neurogenesis.
Keywords: IF; NSCs; adult neurogenesis; dietary restriction; quiescence.
© 2023 The Authors. Published under the terms of the CC BY 4.0 license.
Conflict of interest statement
The authors declare that they have no conflict of interest.
Figures
- A, B
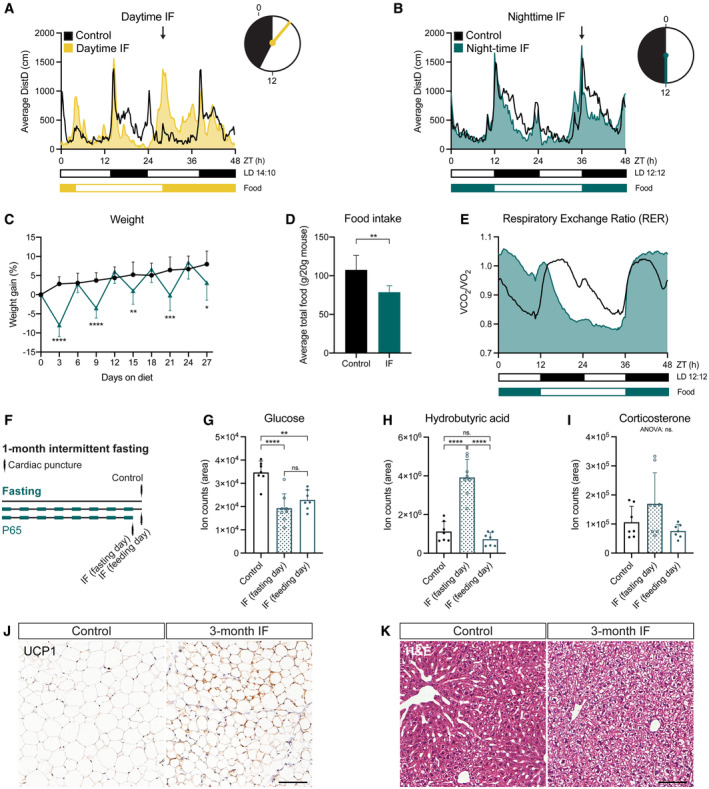
Mouse locomotor activity in control (ad libitum, n control‐daytime = 3, n control‐night‐time=6), daytime IF (A, n = 4), and night‐time IF (B, n = 6) mice. Activity is displayed as average distance covered by mice in 48‐h cycles throughout a 1‐month long intervention. Black and white boxes under the graphs indicate respectively the dark and light phases of the light:dark (LD) cycle with zeitgeber time (ZT) 0 being the time of lights ON. Yellow/blue and white boxes indicate the presence and absence of food respectively. Arrows indicate the time of food availability onset. The clocks represent 24‐h cycles in ZT with light and dark phases filled in white and black respectively. Clock hands indicate time of food change: ZT3 for daytime IF and ZT12 for night‐time IF. Daytime IF introduces abnormal peaks of activity during the day disrupting the circadian rhythmicity of mouse activity while night‐time IF preserves their normal activity pattern.
- C
Mouse weight every 3 days shown as the percentage of weight difference to the first day of the diet. Days 3, 9, 15, 21 and 27 show weight on fasting days, and days 6, 12, 18 and 24 on feeding days. Weight oscillates in feeding and fasting days. n control = 17, n IF = 18. Two‐way ANOVA P time < 0.0001, P diet = 0.0005, P int < 0.0001; followed by Šídák's multiple comparisons test; P of days 3–27 in order: < 0.0001, > 0.9999, < 0.0001, 0.6993, 0.0100, 0.8441, 0.0001, 0.8960, 0.0119.
- D
Average total food consumed for a month shown as g of food per 20 g of mouse weight (weight reference of mice at the beginning of the diet). IF induces a mild (~ 70%) caloric restriction. n Control = 17, n IF = 18. Two‐tailed unpaired t‐test, P = 0.0013.
- E
Respiratory Exchange Ratio (RER) as a comparison of CO2 over O2 volumes. RER values close to 1 indicate predominant carbohydrate metabolism as energy fuel, while RER values close to 0.7 indicate a shift towards lipid oxidation. RER is displayed as average of 48 h cycles throughout a 1‐month long intervention. IF induces a longer shift towards lipid oxidation. n = 6 in both groups.
- F
The serum of mice was obtained by cardiac puncture after 1 month of ad libitum eating (control) or IF. Two independent IF groups were used to collect serum on a fasting or feeding day.
- G–I
Targeted metabolomics were performed to determine the levels of glucose (G), hydrobutyric acid (H), and corticosterone (I) in the serum of mice. The area of ion counts is displayed. n control = 7, n IF(fasting day) = 8, n IF(feeding day) = 7. One‐way ANOVA, (G) P < 0.0001, (H) P < 0.0001, (I) P = 0.0613; followed by Tukey's multiple comparisons test, (H) P control‐IFfasting < 0.0001, P control‐IFfeeding = 0.0014, P IFfasting‐IFfeeding = 0.4061, (G) P control‐IFfasting < 0.0001, P control‐IFfeeding = 0.5180, P IFfasting‐IFfeeding < 0.0001.
- J
Representative images of UCP1‐stained inguinal adipose tissue after 3 months of IF. Adipocytes of IF mice look smaller and show a mild increase in UCP1. Images of all animals can be found in Appendix Fig S1A.
- K
Representative images of liver tissue stained with H&E after 3 months of IF. IF induces hepatocyte swelling. Images of all animals can be found in Appendix Fig S1B.
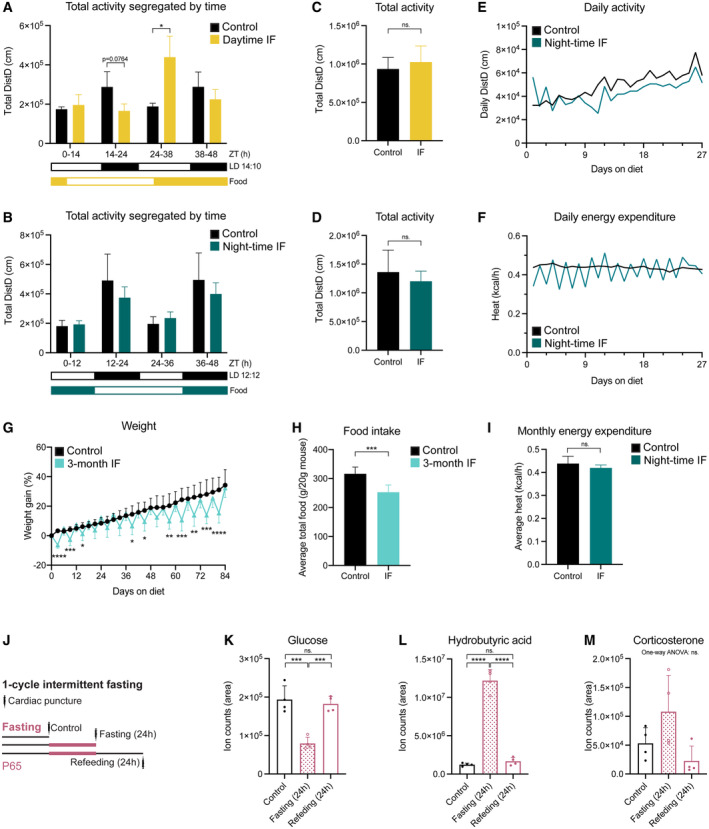
- A, B
Mouse locomotor activity in control (ad libitum, n control‐daytime = 3, n control‐night‐time = 6), daytime IF (A, n = 4), and night‐time IF (B, n = 6) mice displayed as sum of activity during 1 month of IF segregated by time of the day (grouped according to light phase). Black and white boxes under the graphs indicate respectively the dark and light phases of the light:dark (LD) cycle with zeitgeber time (ZT) 0 being the time of lights ON. Yellow/blue and white boxes indicate the presence and absence of food respectively. Expected differences between light and dark phases were observed. Daytime IF increased locomotor activity during the feeding day while night‐time IF preserved the activity pattern. Two‐way ANOVA followed by Šídák's multiple comparisons test. See significance values in Appendix Table S3.
- C, D
Total mouse locomotor activity during 1 month of daytime (C) or night‐time (D) IF. Two‐tailed unpaired t‐test; (C) n control‐daytime = 3, n IF‐daytime = 4, P = 0.5596, (D) n control‐night‐time = 6, n IF‐night‐time = 6, P = 0.3698.
- E, F
Daily mouse activity (E) and energy expenditure (F) over time in control and night‐time IF mice. Mice in the two conditions follow comparable trends except for daily activity during the first 3–4 days, when activity is more variable in night‐time IF mice than in control mice.
- G
Mouse weight shown as the percentage of weight difference to the first day of the diet. Weight oscillations persist throughout the 3 months of IF and there is no weight loss on refeeding days compared to control mice. n control = 17, n IF = 17. Mixed‐effects analysis P time < 0.0001, P diet = 0.0215, P int < 0.0001; followed by Šídák's multiple comparisons test, see significance values in Appendix Table S4.
- H
Average total food consumed for 3 months shown as g of food per 20 g of mouse weight (weight reference of mice at the start of the diet, P65). n control = 17, n IF = 17. Two‐tailed unpaired t‐test, P = 0.8333.
- I
Monthly energy expenditure displayed as average heat per hour. n control = 6, n IF = 6. Two‐tailed unpaired t‐test, P = 0.2141.
- J
The serum of mice was obtained by cardiac puncture after 1 month of ad libitum eating (control) or IF. Different groups were used to collect serum after a fasting or feeding day.
- K–M
Targeted metabolomics were performed to determine the levels of glucose (K), hydrobutyric acid (L) and corticosterone (M) in the serum of mice. The area of ion counts is displayed. n control = 4, n IF(fasting day) = 4, n IF(feeding day) = 4. One‐way ANOVA, (K) P = 0.0002, (L) P < 0.0001, (M) P = 0.0515; followed by Tukey's multiple comparisons test when the ANOVA was significant, (K) P control‐IFfasting = 0.0004, P control‐IFfeeding = 0.8032, P IFfasting‐IFfeeding = 0.0008; (L) P control‐IFfasting < 0.0001, P control‐IFfeeding = 0.7749, P IFfasting‐IFfeeding < 0.0001.
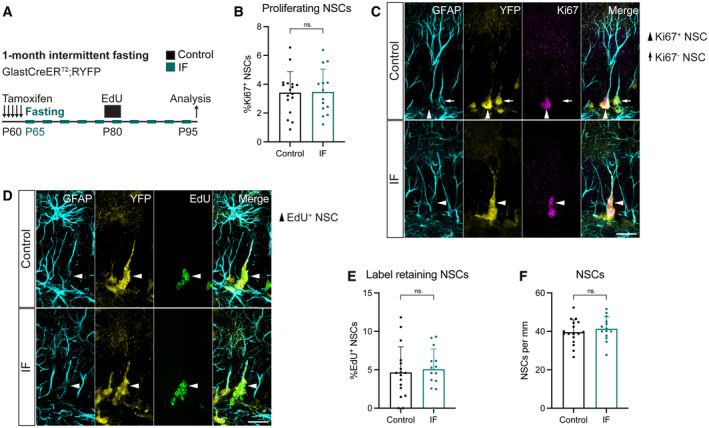
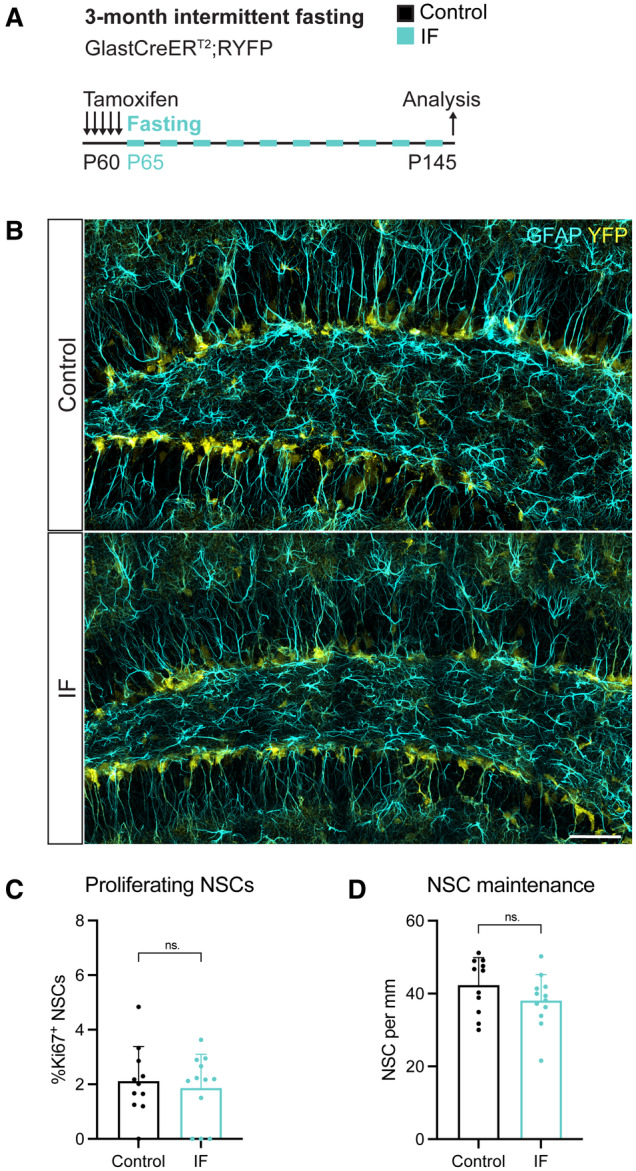
- A
2‐month‐old GlastCreERT2;RYFP mice were administered tamoxifen on 5 consecutive days to fluorescently (YFP) label NSCs, after which, they were subjected to every‐other‐day IF for 1 month. EdU was administered in the drinking water for 5 days, 15 days before the analysis.
- B, C
Images of proliferating NSCs in control and IF mice, and quantification of the percentage of proliferating NSCs. NSCs were identified by their localisation in the SGZ, the presence of a single GFAP+ vertical projection and the help of YFP. Nuclear colocalisation with Ki67 was used to distinguish proliferating (Ki67+, arrowheads) from quiescent (Ki67−, arrow) NSCs. The Ki67− NSC is only shown for comparison, as it is unlikely to be the daughter cell of the proliferating NSC in the same picture. The percentage of proliferating NSCs was unchanged by IF. Two‐tailed unpaired t‐test, P = 0.9165.
- D, E
Images of EdU retaining NSCs in control and IF mice and quantification of their percentage. Arrowheads indicate EdU+ NSCs. IF did not affect the percentage of label retaining NSCs. Two‐tailed unpaired t‐test, P = 0.7046.
- F
Total number of NSCs normalised to DG length per 40‐μm‐thick section. The number of NSCs is unaffected by IF. Two‐tailed unpaired t‐test, P = 0.4452.
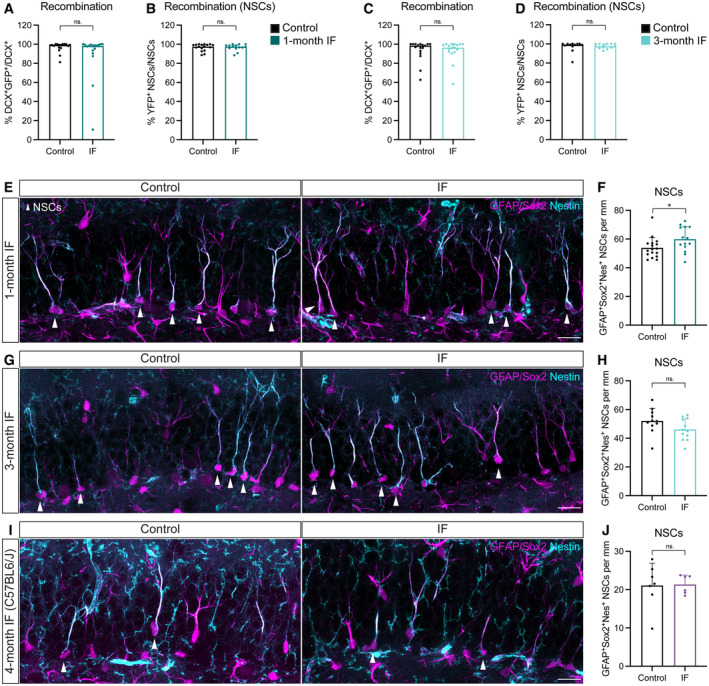
- A–D
Recombination of the YFP reporter in Glast‐CreERT2;RYFP upon tamoxifen induction shown as YFP+ neuroblasts (A, C) or NSCs (B, D) over their total numbers after 1 (A, B) or 3 (C, D) months of treatment. Only animals with a recombination rate higher than 80% were considered for further analysis. Mann–Whitney tests. (A) n control = 17, n IF = 17, P = 0.3233; (B) n control = 17, n IF = 14, P = 0.7760; (C) n control = 17, n IF = 17, P = 0.7818; (D) n control = 12, n IF = 13, P = 0.5318. Bars and error bars represent median + interquartile range.
- E–J
Images of NSCs (arrowheads) and quantifications normalised to DG length per 40‐μm section in Glast‐CreERT2;RYFP mice after 1 (E, F) or 3 (G, H) months of ad libitum (control) eating or IF, and C57BL6/J mice after 4 months of diet (I, J). NSCs were identified as cells with a Sox2+ nucleus in the SGZ extending a single GFAP+Nestin+ radial projection to the molecular layer. (F) n control = 17, n IF = 14; (H) n control = 11, n IF = 12; (I) n control = 7, n IF = 6. Two‐tailed unpaired t‐tests; (F) P = 0.0414, (H) P = 0.09, (I) P = 0.9243. Bars and error bars represent average + s.d.
- A
2‐month‐old GlastCreERT2;RYFP mice were administered tamoxifen on 5 consecutive days to fluorescently (YFP) label NSCs, after which they were subjected to every‐other‐day IF for 3 months.
- B
Images of NSCs identified by their localisation in the SGZ, the presence of a single GFAP+ vertical projection, and the help of YFP. Arrowheads show several NSCs.
- C, D
Quantification of the percentage of proliferating NSCs and the total number of NSCs in control and IF mice normalised to DG length per 40‐μm‐thick section. IF mice show similar levels of proliferating and total NSCs to control mice. Two‐tailed unpaired t‐tests; (C) P = 0.6317, (D) P = 0.1779.
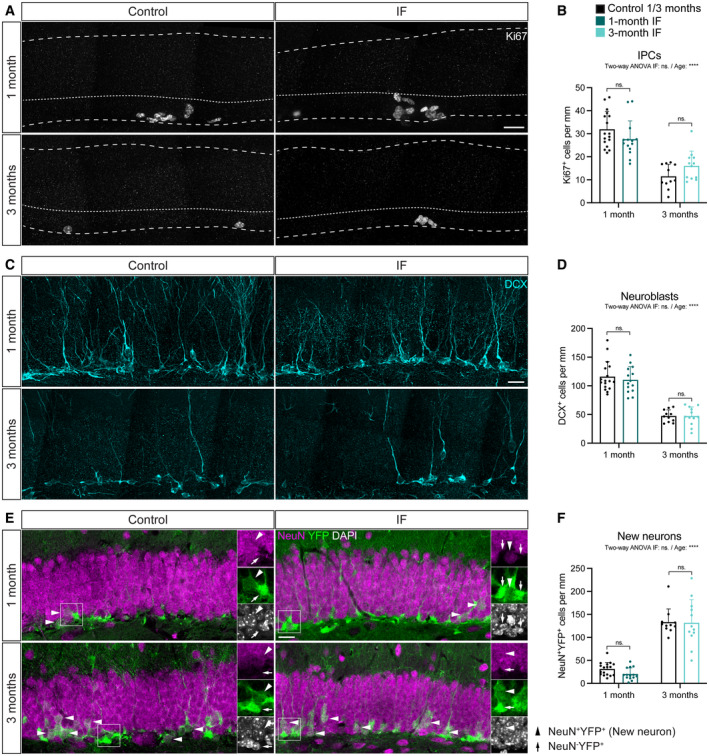
- A, B
Images of Ki67+ cells in control and IF mice after a 1‐ or 3‐month intervention as a proxy for IPCs and quantification of IPCs normalised to DG length per 40‐μm‐thick section. Dashed and dotted lines indicate DG area and border between the SGZ and the molecular layer respectively. IPCs were unchanged by IF. Two‐way ANOVA; P IF = 0.948, P Age = < 0.0001.
- C, D
Images of neuroblasts identified by the marker for immature neurons DCX and quantification normalised to DG length per 40‐μm‐thick section. IF did not affect the number of neuroblasts. Two‐way ANOVA; P IF = 0. 6,092, P Age < 0.0001.
- E, F
Images of newly born neurons (arrowheads) identified by the colocalisation of the mature neuronal marker NeuN and the YFP reporter, indicating that these neurons were generated from the population of NSCs labelled with YFP at the beginning of the diet. Quantification of newly born neurons normalised to DG length per 40‐μm‐thick section. The number of new neurons transiently decreased upon 1 month of IF but was unchanged after 3 months. Two‐way ANOVA; P IF = 0.2642, P Age < 0.0001.
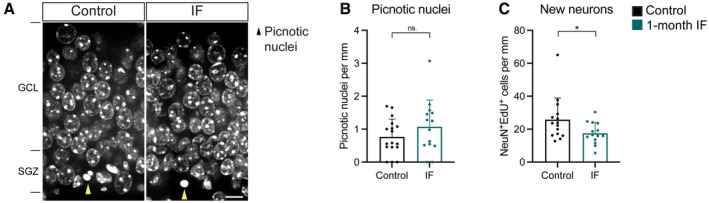
- A
Images of picnotic nuclei (yellow arrowheads) in the SGZ of the DG in control and IF mice after 1 month of diet.
- B
Quantification of picnotic nuclei normalised to DG length per 40‐μm‐thick section as a proxy for cell death, which was not affected by IF. n control = 17, n IF = 14. Two‐tailed unpaired t‐test, P = 0.2172.
- C
Number of EdU‐labelled neurons (as NeuN+ cells) normalised to DG length per 40‐μm‐thick section after a 10‐day chase, showing a decrease in the number of new neurons generated. Note that 10 days is shorter than the conventional 1 month of chase, which is why neuron numbers are still very low. n control = 15, n IF = 14. Two‐tailed unpaired t‐test, P = 0.0427.
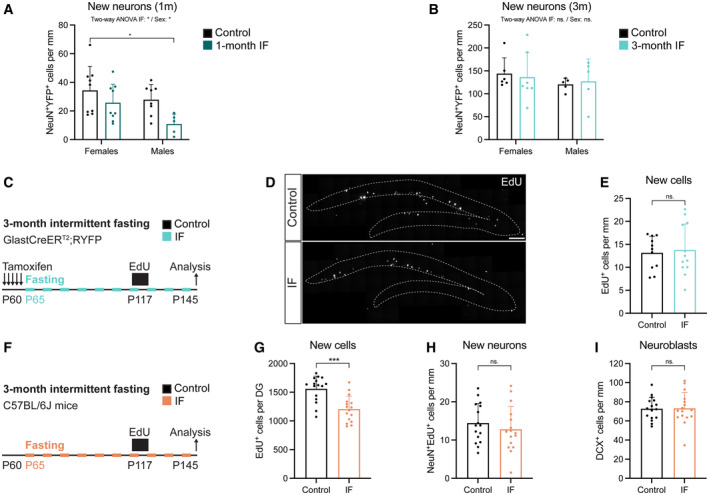
- A, B
Quantification of newly born neurons after 1 (A) or 3 (B) months of IF from Fig 4F segregated by sex. See all sex‐segregated data in Fig EV4 and images of (B) in Appendix Fig S3. (A) n control♀ = 9, n control♂ = 8, n IF♀ = 9, n IF♂ = 5; (B) n control♀ = 6, n control♂ = 5, n IF♀ = 7, n IF♂ = 5. Two‐way ANOVA; (A) P IF = 0.0129, P Sex < 0.0352; (B) P IF = 0.3728, P Sex < 0.9784; followed by Tuckey's multiple comparisons tests (see significance values in Appendix Table S2). Sex differences were found only in the number of new neurons at 1 month.
- C
Survival assay with a thymidine analogue to replicate the labelling method of previous publications. EdU was administered for 4 days to GlastCreERT2;RYFP mice (see experimental in Fig 3) that had undergone 2 months of IF to label a cohort of proliferating cells that was analysed after a 1‐month chase, giving the cells time to progress in the neurogenic lineage.
- D, E
Images of new cells in the DG (enclosed in dashed lines) shown by EdU‐labelled cells 1 month after EdU administration and quantification normalised to DG length per 40‐μm‐thick section. n control = 11, n IF = 12. Two‐tailed unpaired t‐test, P = 0.7591. The number of new cells in the DG was unchanged by IF.
- F
Evaluation of tamoxifen and strain impact on the effects of IF on adult neurogenesis. 2‐month‐old C57BL/6J mice were subjected to 3 months of IF. A survival assay with the thymidine analogue EdU 1 month before the end of the diet was included. n control = 16, n IF = 16.
- G
Stereological quantification of new cells in the whole DG. Two‐tailed unpaired t‐test, P = 0.0001.
- H
Quantification of newly born neurons normalised to DG length per 40‐μm‐thick section identified by colocalisation of EdU and the marker for mature neurons NeuN. Two‐tailed unpaired t‐test, P = 0.4144.
- I
Quantification of new neuroblasts normalised to DG length per 40‐μm‐thick section. Two‐tailed unpaired t‐test, P = 0.9432. IF did not increase the number of new neurons or neuroblasts in C57BL/6J mice.
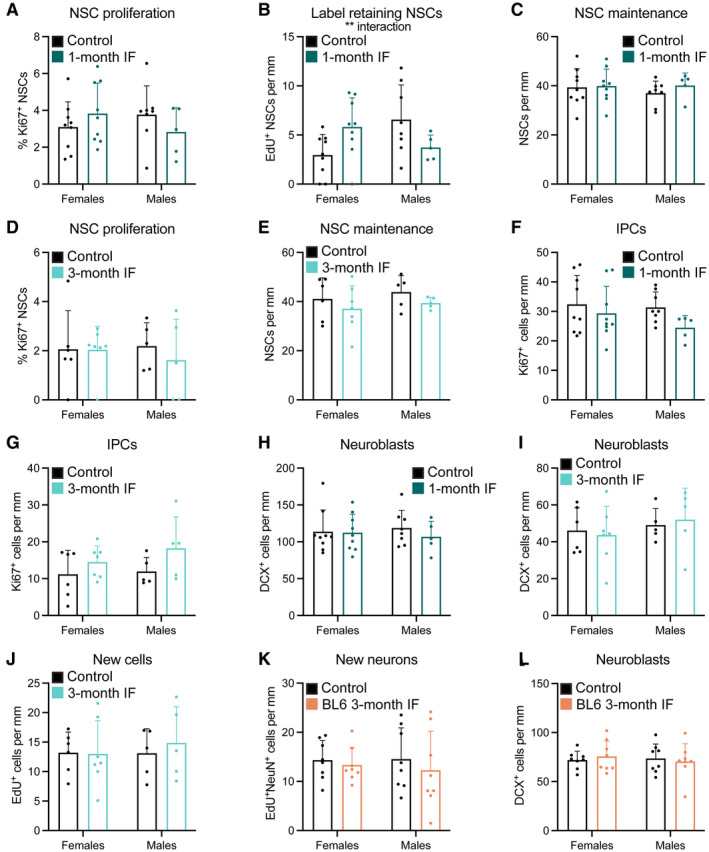
- A–L
Data of graphs in the main figures segregated by sex showing that the response of adult neurogenesis to IF is sex‐independent. The percentage of label retaining NSCs after 1 month of IF (B) shows an interaction between diet and sex that is not translated in the following steps of the neurogenic lineage.
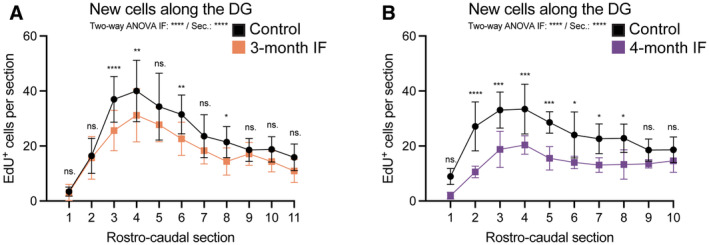
- A, B
Number of EdU+ cells along the rostro‐caudal axis of the DG in C57BL6/J mice after 3 or 4 months of IF. See Figs 5 and 6 for experimental design. The average of the two hemispheres in each section was used to calculate the number of cells in a 40‐μm‐thick DG section. The distance between sections is 240 μm. (A) n control = 16, n IF = 16; (B) n control = 7, n IF = 6. Two‐way ANOVA followed by Šídák's multiple comparisons test (see significance values in Appendix Table S7).
- A
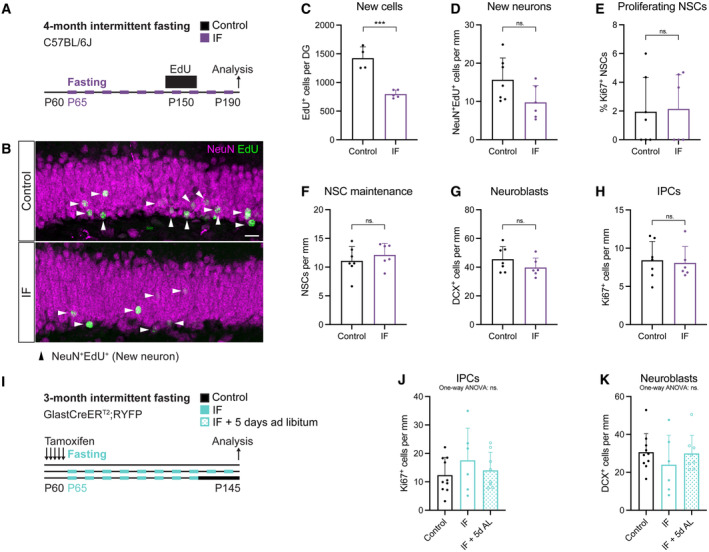
2‐month‐old male C57BL/6J mice were subjected to 4 months of IF, as in previous studies that reported increases in adult neurogenesis. A survival assay with the thymidine analogue EdU (12‐day labelling—1‐month chase) was used to evaluate neurogenesis.
- B
Image of newly born neurons identified by colocalisation of EdU and the marker for mature neurons NeuN. Arrowheads indicate EdU+NeuN+ cells in this Z‐plane. Some nuclei appear faint because most of their nucleus was located in adjacent Z‐planes. The whole Z‐stack was used for quantification.
- C
Stereological quantification of new cells (EdU+ cells) in the whole DG of control and 4‐month IF C57BL6/J mice. 4 months of IF induce a decrease in EdU‐labelled neurons. n control = 4, n IF = 5. Two‐tailed unpaired t‐test, P = 0.0003.
- D
Quantification of new neurons (NeuN+EdU+) normalised to DG length per 40‐μm‐thick section. n control = 7, n IF = 6. Two‐tailed unpaired t‐test, P = 0.0628.
- E–H
Quantification of the percentage of proliferating NSCs (E), and the number of NSCs (F), neuroblasts (G) and IPCs (H) normalised to DG length per 40‐μm‐thick section. The neurogenic lineage is not affected by 4 months of IF. n control = 7, n IF = 6. Two‐tailed unpaired t‐tests; (E) P = 0.8863, (F) P = 0.4324, (G) P = 0.2154, (H) P = 0.7970.
- I
2‐month‐old GlastCreERT2;RYFP mice were subjected to 3 months of IF, after which a subset of IF mice had ad libitum access to food for 5 days.
- J, K
Quantification of IPCs (J) and neuroblasts (K) normalised to DG length per 40‐μm‐thick section in control, IF and IF mice with 5 days of ad libitum eating before analysis. One‐way ANOVAs; n control = 10, n IF = 6, n IF+5dAL = 8; (J) P = 0.4440, (K) P = 0.5120.
References
MeSH terms
Grants and funding
LinkOut - more resources
Full Text Sources
Miscellaneous
