. 2024 Jan 16;134(2):e165523.
doi: 10.1172/JCI165523.

Galectin-3 aggravates microglial activation and tau transmission in tauopathy

Affiliations

Galectin-3 aggravates microglial activation and tau transmission in tauopathy

Jian Jing Siew et al. J Clin Invest. .

Abstract

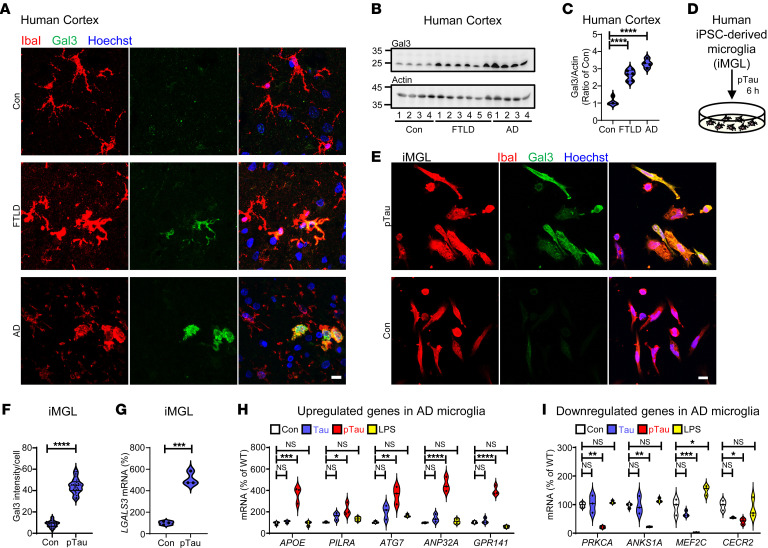
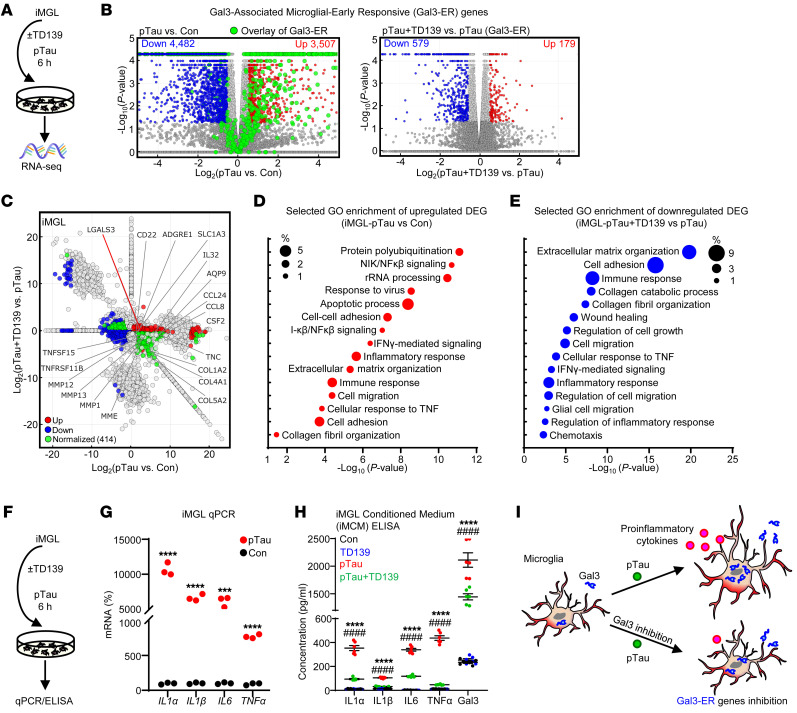
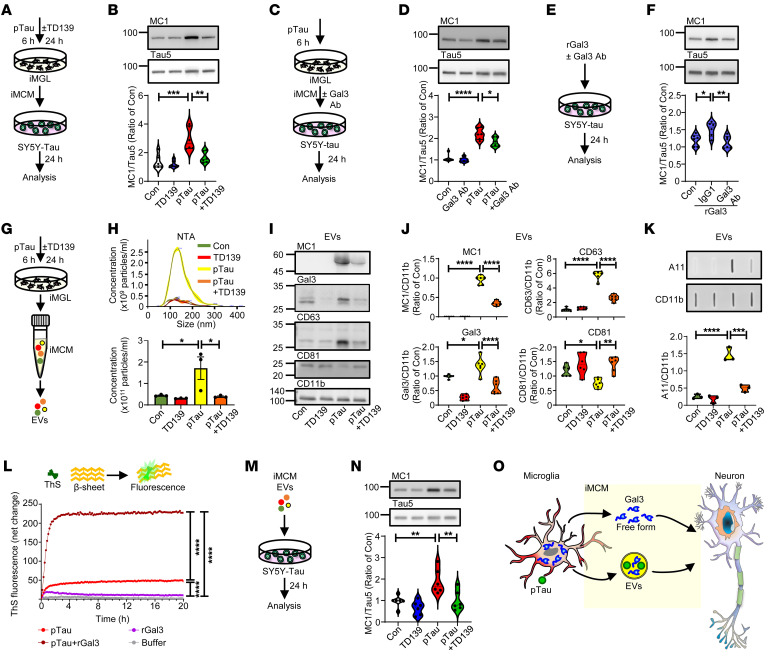
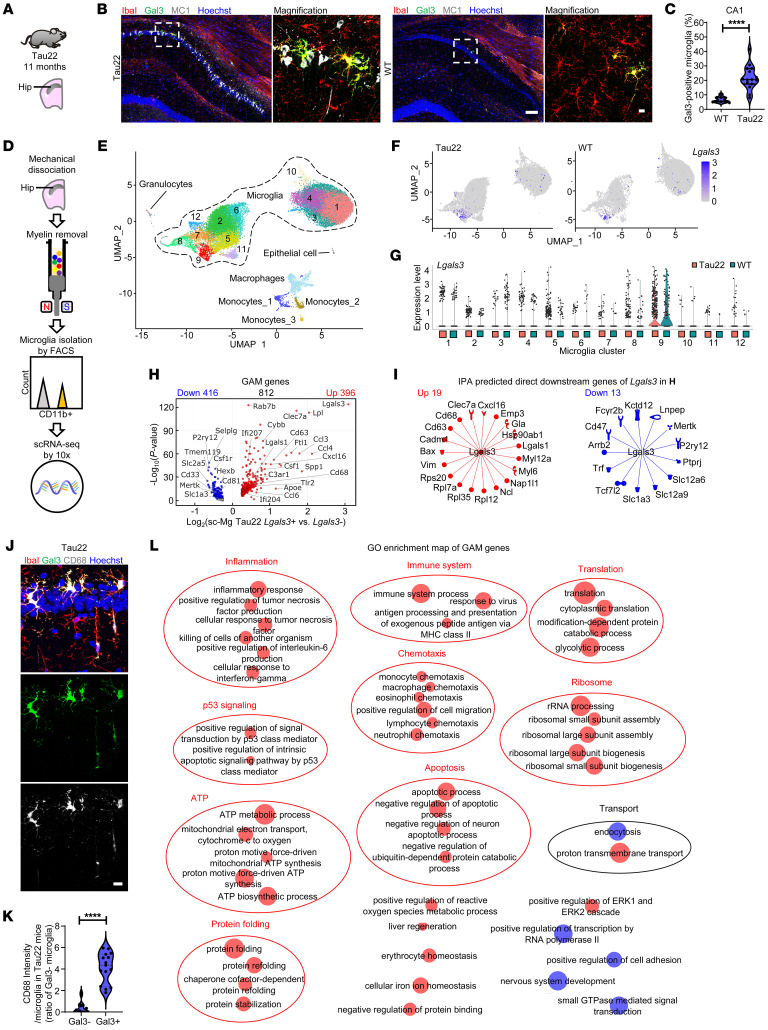
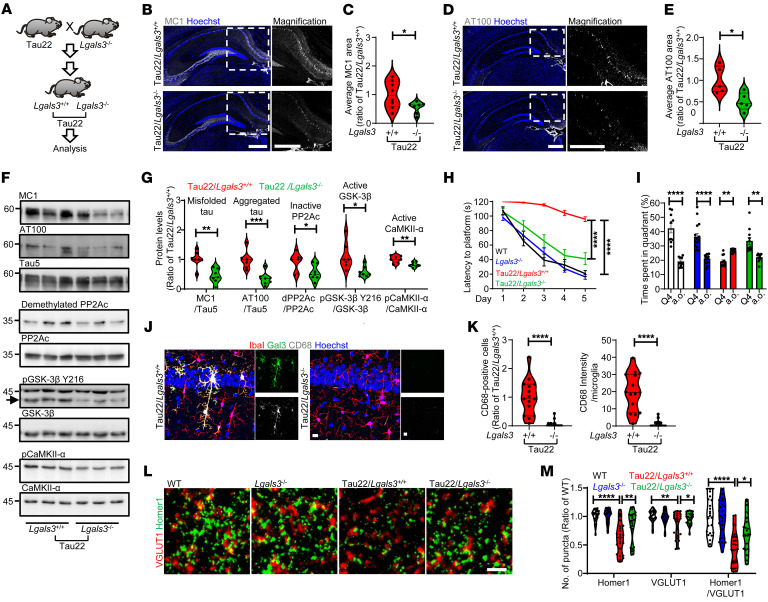
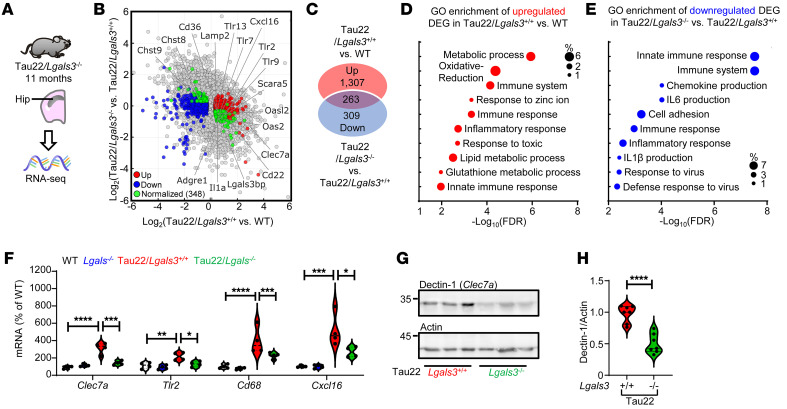
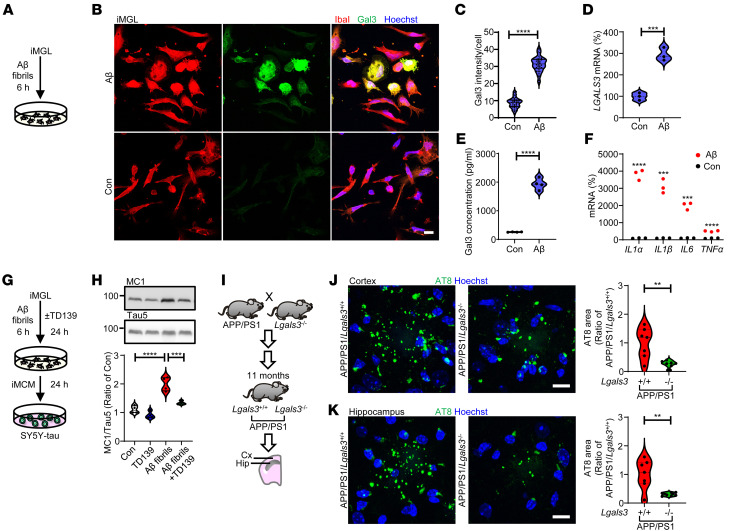
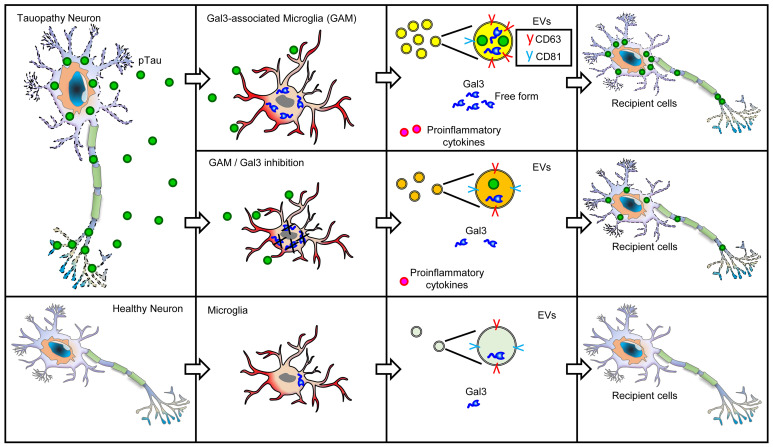
Alzheimer's disease is characterized by the accumulation of amyloid-β plaques, aggregation of hyperphosphorylated tau (pTau), and microglia activation. Galectin-3 (Gal3) is a β-galactoside-binding protein that has been implicated in amyloid pathology. Its role in tauopathy remains enigmatic. Here, we showed that Gal3 was upregulated in the microglia of humans and mice with tauopathy. pTau triggered the release of Gal3 from human induced pluripotent stem cell-derived microglia in both its free and extracellular vesicular-associated (EV-associated) forms. Both forms of Gal3 increased the accumulation of pathogenic tau in recipient cells. Binding of Gal3 to pTau greatly enhanced tau fibrillation. Besides Gal3, pTau was sorted into EVs for transmission. Moreover, pTau markedly enhanced the number of EVs released by iMGL in a Gal3-dependent manner, suggesting a role of Gal3 in biogenesis of EVs. Single-cell RNA-Seq analysis of the hippocampus of a mouse model of tauopathy (THY-Tau22) revealed a group of pathogenic tau-evoked, Gal3-associated microglia with altered cellular machineries implicated in neurodegeneration, including enhanced immune and inflammatory responses. Genetic removal of Gal3 in THY-Tau22 mice suppressed microglia activation, reduced the level of pTau and synaptic loss in neurons, and rescued memory impairment. Collectively, Gal3 is a potential therapeutic target for tauopathy.

Keywords: Alzheimer disease; Neurodegeneration; Neuroscience; iPS cells.


Conflict of interest statement

Conflict of interest: The authors have declared that no conflict of interest exists.

Figures

Figure 1
Figure 1. Pathogenic tau upregulates Gal3 in microglia.
(A) Immunochemical staining of Gal3 in microglia in the cortexes of patients with frontotemporal lobar dementia (FTLD; Braak score 5) or Alzheimer’s disease (AD; Braak score 6) and those of people in the control group (Con; Braak score 1). (B and C) Immunoblot detection of Gal3 in FTLD, AD and Con samples, n = 4 for Con and AD, n = 6 for FTLD. (D and E) Schematic diagram illustrating the study protocol in E and immunofluorescence staining of Gal3 and a microglial marker (IbaI) in iPSC-derived microglia (iMGL) prepared from 44 days of differentiation and treated with 50 nM of pTau for 6 hours. (F) Quantification of the data in E, n = 3 iMGL lines, 3 coverslips per iMGL line, 3–4 fields per coverslip. (G) q-RT-PCR analysis of LGALS3 in iMGLs treated with pTau for 6 hours, n = 3 iMGL lines. q-RT-PCR analysis of (H) APOE, PILRA, ATG7, ANP32A, and GPR141, and (I) PRKCA, ANKS1A, MEF2C, and CECR2 in iMGLs treated with tau (50 nM), pTau (50 nM), and LPS (100 ng/mL) for 6 hours, n = 3 iMGL lines. Scale bars: 10μm. Data in F and G were analyzed by 2-tailed unpaired t test, C, H and I were analyzed by 1-way with Tukey’s test, respectively. Violin plots show medians with 25th and 75th percentiles, *P < 0.05, **P < 0.01, ***P < 0.001, ****P < 0.0001.
Figure 2
Figure 2. Pathogenic tau triggers microglial activation via Gal3.
(A) RNA-Seq analysis of iMGL pretreated for 24 hours with TD139 (10 μM, Gal3 inhibition) and 6 hours with pTau (50 nM) and controls. (B) Volcano plots show the DEGs identified in the pTau versus Con and pTau plus TD139 versus pTau groups. Red and blue dots indicate upregulated and downregulated DEGs, respectively, and enlarged green dots indicate Gal3-ER genes. Cutoff of significance, |Log2 FC| > 0.55 and P < 0.05 (C) Differential expression analysis of the RNA-Seq data in (B), Log2 FC in pTau versus Con (x-axis) and pTau+TD139 versus pTau (y-axis). Upregulated DEGs are shown in the right part (pTau-activated genes) or upper part (TD139-activated genes) of the graph, and downregulated DEGs are shown in the left part (pTau-inhibited genes) or lower part (TD139-inhibited genes) of the graph. Red dots and blue dots indicate upregulated and downregulated DEGs, respectively, while green dots indicate DEGs normalized by Gal3 inhibition (TD139). (D) GO enrichment analysis of DEGs upregulated under early pTau effects in iMGL identified by RNA-Seq. (E) GO enrichment analysis of downregulated DEGs identified in pTau plus TD139 versus pTau iMGL. (F and G) q-RT-PCR analysis of proinflammatory genes (IL1α, IL1β, IL6, and TNFα) in iMGL treated with pTau for 6 hours, n = 3 iMGL line, ***P < 0.001, ****P < 0.0001. (H) ELISA of conditioned medium collected from iMGL (iMCM) treated with pTau and a Gal3 inhibitor, n = 6, 3 iMGL lines from 2 independent differentiations, pTau versus Con ****P < 0.0001, and pTau+TD139 versus pTau, ####P < 0.0001. (I) Schematic diagram illustrating the effect of pTau and Gal3 inhibition on microglial activation.
Figure 3
Figure 3. Gal3 in free form and in EVs exacerbates the effect of pathological tau.
(A and B) Immunoblot analysis and quantification of MC1 in SY5Y-tau cells treated with iMCM collected from each group. (C and D) Immunoblot analysis and quantification of MC1 following pTau iMCM and anti-Gal3 neutralizing antibody coincubation (3 μg/mL). (E and F) Immunoblot analysis and quantification of MC1 in SY5Y-tau cells treated with recombinant Gal3 (rGal3, 1 μM) and a Gal3 neutralizing antibody, n = 6, 3 iMGL lines from 2 independent differentiations for AF. (G and H) EV isolation and NTA quantification of the EV concentration, n = 3 iMGL lines. (I and J) Immunoblot analysis and quantification of MC1, Gal3, CD63, and CD81 in EVs, n = 6, 3 iMGL lines from 2 independent differentiations. (K) Slot blot analysis of oligomer proteins in EVs based on A11 signals, n = 3 iMGL lines. (L) Thioflavin-S fluorescence assay to measure in vitro pTau aggregation. Data were analyzed after 20 hours of reaction time. (M and N) Immunoblot analysis and quantification of MC1 on SY5Y-tau cells treated with EVs (10 μg/mL) from different groups, n = 6, 3 iMGL lines from 2 independent differentiations. (O) Schematic diagram illustrating how microglial Gal3 may interact with neurons via 2 independent routes. The data in F and L were analyzed by 1-way ANOVA, while those in B, D, H, J, K, and N were analyzed by 2-way ANOVA with Tukey’s test, and violin plots show medians with 25th and 75th percentiles, *P < 0.05, **P < 0.01, ***P < 0.001, ****P < 0.0001.
Figure 4
Figure 4. Gal3-associated microglial (GAM) genes.
(AC) IHC staining and quantification of microglia and Gal3 in the CA1 region of the hippocampus in Tau22 mice, n = 3 for WT and n = 5 for Tau22, 3 fields per animal. (D) Schematic diagram illustrating single-cell microglial isolation. (E) UMAP plot showing twelve microglial clusters and nonmicroglial clusters identified from the scRNA-Seq data. (F) UMAP shows the expression of Lgals3 in all microglia. (G) Violin plots show the expression of Lgals3 in microglial clusters. (H) Volcano plot shows the GAM genes identified in Tau22 mice. (I) IPA prediction of direct downstream Gal3-regulated genes. (JK) IHC staining and quantification of microglial activation marker (CD68) on microglia with or without Gal3 expression in Tau22 mice, n = 5 mice in each group, 3 fields per animal. (L) Enrichment map of GAM genes. Clusters were defined based on the REVIGO visualized by the WordCloud app in Cytoscape. Scale bars: 10 μm (B [right] and J); 100 μm (B [left]),. Data were analyzed with the 2-tailed unpaired t test. Violin plots show the median with the 25th and 75th percentiles, ****P < 0.0001.
Figure 5
Figure 5. Loss of Gal3 rescues tauopathy in THY-Tau22 mice.
(A) Schematic diagram illustrating the study design to identify the roles of Gal3 in Tau22 mice. IHC staining and quantification for (B and C) MC1 and (D and E) AT100 in mouse hippocampi, MC1: n = 8 for Tau22/Lgals3+/+, n = 7 for Tau22/Lgals3–/–; AT100: n = 5 mice. Each dot represents the average value of each animal. (F) Immunoblot analysis of sarkosyl soluble mouse hippocampi (11 months) stained for MC1, AT100, Tau5, demethylated PP2A subunit C (inactive PP2Ac), PP2Ac, pGSK-3β Y216, GSK-3β, pCaMKII-α, and CaMKII-α. (G) Quantification of the data in F, n = 7 mice. (H) Quantification of the time to platform in the 5-day training section of the Morris water maze, n = 13 for WT, n = 17 for Lgals3–/–, n = 12 for Tau22/Lgals3+/+, n = 16 for Tau22/Lgals3–/–. (I), Quantification of the time spent in quadrant 4 (Q4, the quadrant with the hidden platform during the training section) versus all other quadrants (a.o., average of 3 other quadrants) on probe trial Day 8. Data are shown as the mean ± SEM. (J and K) IHC staining and quantification of CD68 in Tau22/Lgals3–/– and Tau22/Lgals3+/+ mice, n = 5 mice, 3 fields per animal. (L) IHC staining of Homer 1 and VGLUT1 in the CA1 region of Tau22/Lgals3–/– and control mice. (M) Quantification of the staining in L, n = 8 mice, 3 fields per animal. Scale bars: 500 μm (B and D), 10 μm (J), 2 μm (L). Data in H and M were analyzed by 2-way ANOVA with Tukey’s test. Other data were analyzed with a 2-tailed unpaired t test, and all violin plots show the median with the 25th and 75th percentiles. *P < 0.05, **P < 0.01, ***P < 0.001, ****P < 0.0001.
Figure 6
Figure 6. Deletion of Gal3 ameliorates disease-associated pathways in tauopathy.
(A) RNA isolated from the hippocampi of Tau22/Lgals3–/– and control mice was subjected to RNA-Seq. (B) Scatterplot showing DEGs identified between Tau22/Lgals3+/+ and WT mice and between Tau22/Lgals3–/– and Tau22/Lgals3+/+ mice. Red and blue dots indicate upregulated and downregulated DEGs, respectively, and green dots indicate genes that are normalized in Tau22/Lgals3–/– mice compared with Tau22/Lgals3+/+ mice. (C) Venn diagrams show the numbers of normalized genes in each group. (D and E) GO enrichment analysis of upregulated DEGs in Tau22/Lgals3+/+ versus WT mice, and downregulated DEGs in Tau22/Lgals3–/– versus Tau22/Lgals3+/+ mice. (F) qPCR validation of selected normalized DEGs, n = 4 mice. Data were analyzed by 2-way ANOVA with Tukey’s test. (G and H) Immunoblot detection and quantification of dectin-1 (a.k.a Clec7a) in the hippocampi of Tau22/Lgals3–/– versus Tau22/Lgals3+/+ mice, n = 7 mice. Data were analyzed with the 2-tailed unpaired t test, and violin plots show medians with 25th and 75th percentiles, *P < 0.05, **P < 0.01, ***P < 0.001, ****P < 0.0001.
Figure 7
Figure 7. Gal3 exacerbates amyloid-β–induced tauopathy.
(AC) Immunofluorescence staining of Gal3 and IbaI in iMGL treated with fibrillar amyloid-β (1 μM) for 6 hours, n = 3 iMGL lines, 3 coverslips per iMGL line, 3–4 fields per coverslip. qPCR analysis of (D) LGALS3 and (F) proinflammatory genes in iMGL, n = 3 iMGL lines. (E) Gal3 ELISA of conditioned medium collected from iMGL, n = 3 iMGL lines, 1 line with 2 independent differentiations. (G and H) Immunoblot analysis and quantification of MC1 in cells treated with fibrillar amyloid-β iMCM and TD139 (10 μM, Gal3 inhibition), n = 3 iMGL lines, each line with 2 independent differentiations. (IK), IHC staining and quantification of pTau (AT8) in 11-month-old APP/PS1/Lgals3–/– versus APP/PS1/Lgals3+/+ mice, n = 7 mice. Scale bar: 10 μm. The data in H were analyzed by 2-way ANOVA with Tukey’s test, and those in CF, J, and K were analyzed with the 2-tailed unpaired t test, and violin plots show medians with 25th and 75th percentiles, **P < 0.01, ***P < 0.001, ****P < 0.0001.
Figure 8
Figure 8. Schematic diagram illustrating the roles of Gal3 in microglia-mediated tau transmission and fibrillation.

References

    1. Boza-Serrano A, et al. Galectin-3, a novel endogenous TREM2 ligand, detrimentally regulates inflammatory response in Alzheimer’s disease. Acta Neuropathol. 2019;138(2):251–273. doi: 10.1007/s00401-019-02013-z. - DOI - PMC - PubMed
    1. Forner S, et al. Synaptic impairment in alzheimer’s disease: a dysregulated symphony. Trends Neurosci. 2017;40(6):347–357. doi: 10.1016/j.tins.2017.04.002. - DOI - PubMed
    1. Tanzi RE, Bertram L. Twenty years of the Alzheimer’s disease amyloid hypothesis: a genetic perspective. Cell. 2005;120(4):545–555. doi: 10.1016/j.cell.2005.02.008. - DOI - PubMed
    1. Zhang Y, et al. Amyloid β-based therapy for Alzheimer’s disease: challenges, successes and future. Signal Transduct Target Ther. 2023;8(1):248. doi: 10.1038/s41392-023-01484-7. - DOI - PMC - PubMed
    1. Weigand AJ, et al. Is tau in the absence of amyloid on the Alzheimer’s continuum?: A study of discordant PET positivity. Brain Commun. 2020;2(1):fcz046. doi: 10.1093/braincomms/fcz046. - DOI - PMC - PubMed