

Clinical dimensions along the non-fluent variant primary progressive aphasia spectrum
- PMID: 37988272
- PMCID: PMC10994525
- DOI: 10.1093/brain/awad396
Clinical dimensions along the non-fluent variant primary progressive aphasia spectrum
Abstract
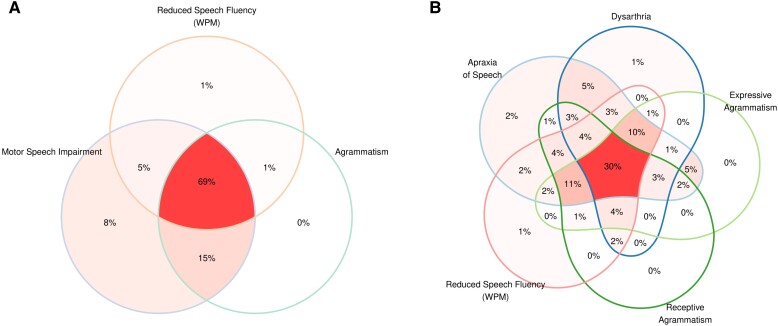
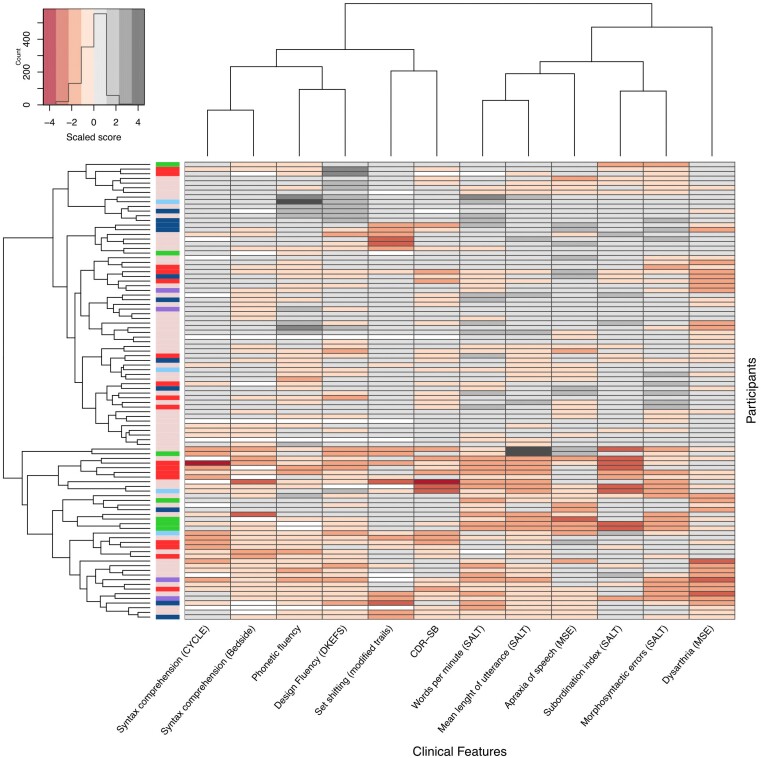
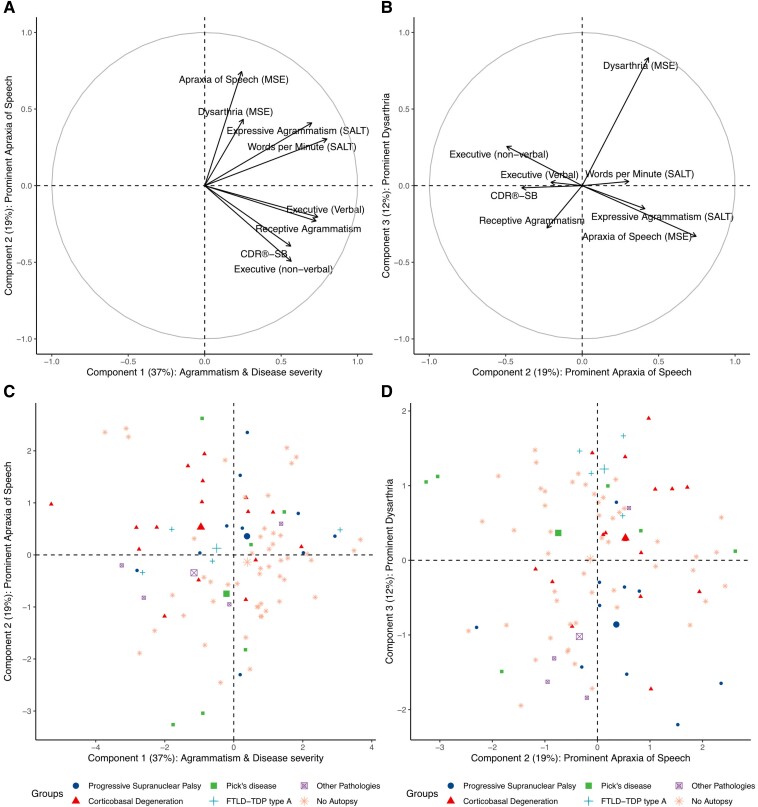
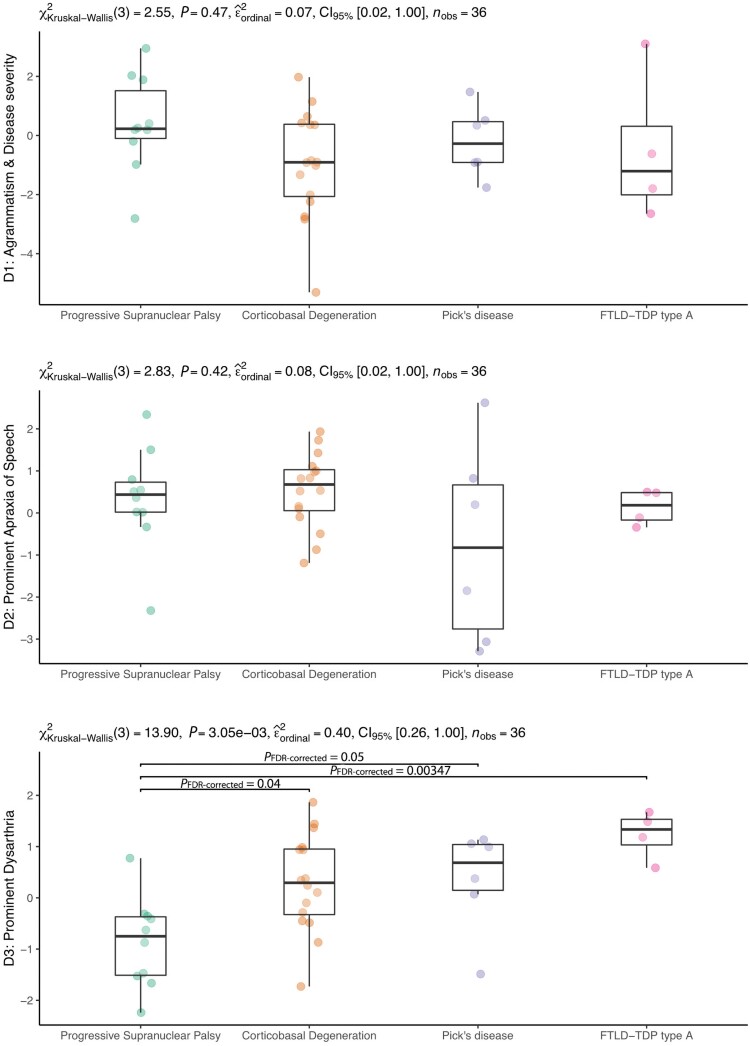
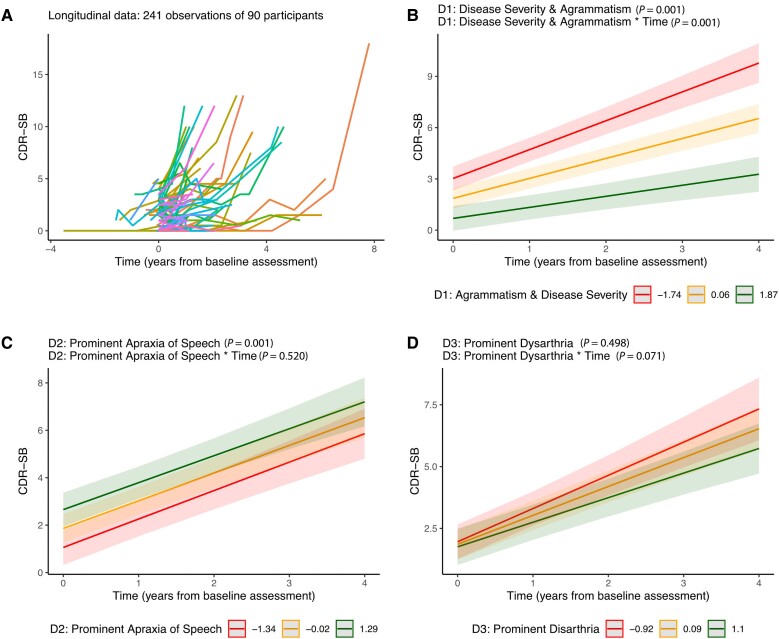
It is debated whether primary progressive apraxia of speech (PPAOS) and progressive agrammatic aphasia (PAA) belong to the same clinical spectrum, traditionally termed non-fluent/agrammatic variant primary progressive aphasia (nfvPPA), or exist as two completely distinct syndromic entities with specific pathologic/prognostic correlates. We analysed speech, language and disease severity features in a comprehensive cohort of patients with progressive motor speech impairment and/or agrammatism to ascertain evidence of naturally occurring, clinically meaningful non-overlapping syndromic entities (e.g. PPAOS and PAA) in our data. We also assessed if data-driven latent clinical dimensions with aetiologic/prognostic value could be identified. We included 98 participants, 43 of whom had an autopsy-confirmed neuropathological diagnosis. Speech pathologists assessed motor speech features indicative of dysarthria and apraxia of speech (AOS). Quantitative expressive/receptive agrammatism measures were obtained and compared with healthy controls. Baseline and longitudinal disease severity was evaluated using the Clinical Dementia Rating Sum of Boxes (CDR-SB). We investigated the data's clustering tendency and cluster stability to form robust symptom clusters and employed principal component analysis to extract data-driven latent clinical dimensions (LCD). The longitudinal CDR-SB change was estimated using linear mixed-effects models. Of the participants included in this study, 93 conformed to previously reported clinical profiles (75 with AOS and agrammatism, 12 PPAOS and six PAA). The remaining five participants were characterized by non-fluent speech, executive dysfunction and dysarthria without apraxia of speech or frank agrammatism. No baseline clinical features differentiated between frontotemporal lobar degeneration neuropathological subgroups. The Hopkins statistic demonstrated a low cluster tendency in the entire sample (0.45 with values near 0.5 indicating random data). Cluster stability analyses showed that only two robust subgroups (differing in agrammatism, executive dysfunction and overall disease severity) could be identified. Three data-driven components accounted for 71% of the variance [(i) severity-agrammatism; (ii) prominent AOS; and (iii) prominent dysarthria]. None of these data-driven LCDs allowed an accurate prediction of neuropathology. The severity-agrammatism component was an independent predictor of a faster CDR-SB increase in all the participants. Higher dysarthria severity, reduced words per minute and expressive and receptive agrammatism severity at baseline independently predicted accelerated disease progression. Our findings indicate that PPAOS and PAA, rather than exist as completely distinct syndromic entities, constitute a clinical continuum. In our cohort, splitting the nfvPPA spectrum into separate clinical phenotypes did not improve clinical-pathological correlations, stressing the need for new biological markers and consensus regarding updated terminology and clinical classification.
Keywords: apraxia of speech; corticobasal degeneration; dysarthria; magnetic resonance imaging; primary progressive aphasia; progressive supranuclear palsy.
© The Author(s) 2023. Published by Oxford University Press on behalf of the Guarantors of Brain.
Conflict of interest statement
I.I.-G. reported receiving personal fees from Nutricia, Esteve, UCB, and Neuraxpharm Spain outside the submitted work. J.d.L. reported receiving grants from the Alzheimer’s Association outside the submitted work. L.T.G. reported receiving grants from the National Institutes of Health (NIH), Rainwater Charitable Foundation, and Weill Neuroscience Institute outside the submitted work. S.S. reports consulting fees from Techspert.io, Precision Xtract, and Acsel Health outside the submitted work. A.L.B. reported receiving grants from NIH and grants from Rainwater Charitable Foundation during the conduct of the study; receiving grants from NIH, the Tau Research Consortium, the Association for Frontotemporal Degeneration, Bluefield Project to Cure Frontotemporal Dementia, Corticobasal Degeneration Solutions, the Alzheimers Drug Discovery Foundation and the Alzheimer’s Association; consulting for Applied Genetic Therapies, Alector, Arkuda, Arvinas, AZTherapeutics, Boehringer Ingelheim, GlaxoSmithKline, Humana, Lundbeck, Oligomerix, Ono, Roche, Samumed, Stealth, Third Rock, Transposon, TrueBinding, and Wave; receiving stock and options from Alector Stock/options; receiving options from Arvinas, Arkuda, AZTherapies, and True Binding; receiving grants from Biogen, Eisai, and Regeneron; and receiving personal fees from Denali, GlaxoSmithKline, Humana, Boeringher Ingelheim, Oscotec, Oligomerix, Roche, Transposon, and Wave outside the submitted work. No other disclosures were reported. B.L.M. reported receiving grants from NIH and receiving royalties from Cambridge University Press, Guilford Publications, Johns Hopkins Press, Oxford University Press, Taylor & Francis Group, Elsevier, and UpToDate outside the submitted work. W.W.S. reported receiving personal fees from BridgeBio, GLG Council, Guidepoint Global, and Corcept Therapeutics outside the submitted work.
Figures
References
Publication types
MeSH terms
Grants and funding
- P50 AG023501/AG/NIA NIH HHS/United States
- R21 AG068757/AG/NIA NIH HHS/United States
- K24 AG045333/AG/NIA NIH HHS/United States
- U01 AG057195/AG/NIA NIH HHS/United States
- K24 AG053435/AG/NIA NIH HHS/United States
- U01 AG052943/AG/NIA NIH HHS/United States
- P30 AG062422/AG/NIA NIH HHS/United States
- R01 AG032306/AG/NIA NIH HHS/United States
- RF1 NS050915/NS/NINDS NIH HHS/United States
- R01 NS050915/NS/NINDS NIH HHS/United States
- U01 AG045390/AG/NIA NIH HHS/United States
- U54 NS092089/NS/NINDS NIH HHS/United States
- K24 DC015544/DC/NIDCD NIH HHS/United States
- AG053435/NH/NIH HHS/United States
- K23 DC018021/DC/NIDCD NIH HHS/United States
- R01 AG038791/AG/NIA NIH HHS/United States
- R01 AG075802/AG/NIA NIH HHS/United States
- U19 AG063911/AG/NIA NIH HHS/United States
- ALZ/Alzheimer's Association/United States
- P01 AG019724/AG/NIA NIH HHS/United States
- R01 DC016291/DC/NIDCD NIH HHS/United States
- K08 AG052648/AG/NIA NIH HHS/United States
- ALZ UK-21-720973/ALZS_/Alzheimer's Society/United Kingdom
