. 2023 Nov 21:12:RP88919.
doi: 10.7554/eLife.88919.

Functional ultrasound imaging of stroke in awake rats

Affiliations

Functional ultrasound imaging of stroke in awake rats

Clément Brunner et al. Elife. .

Abstract

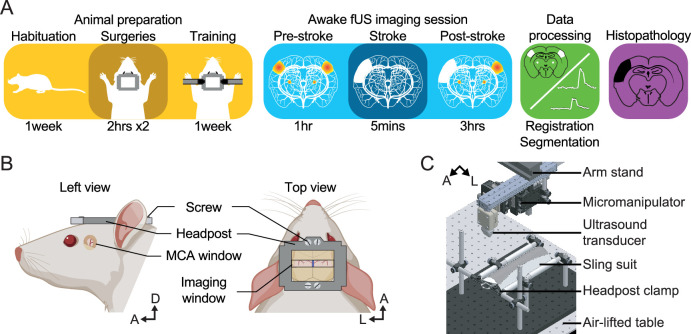
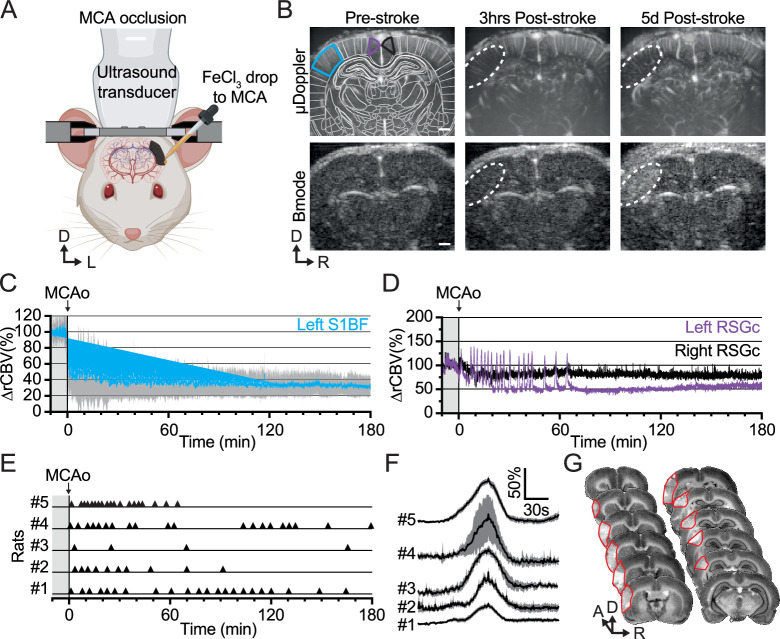
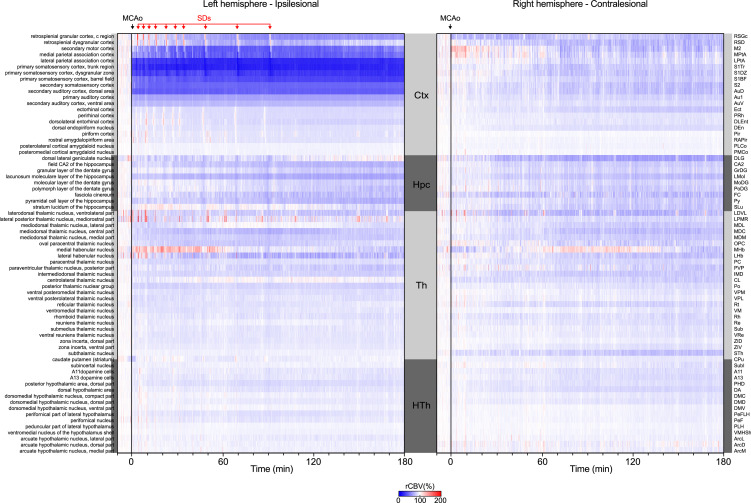
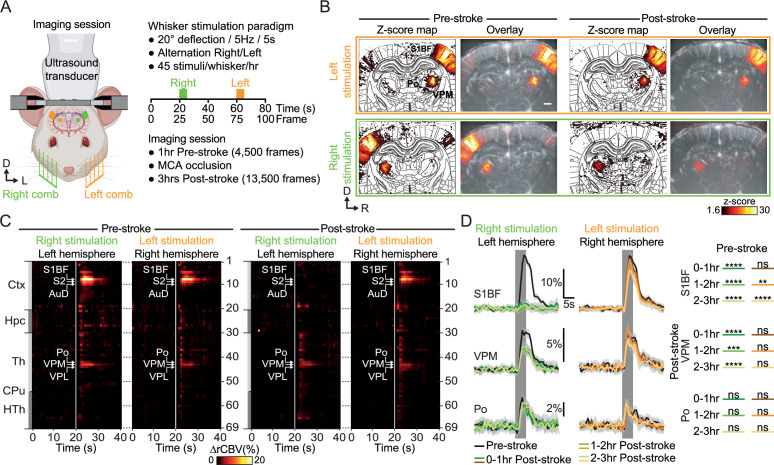
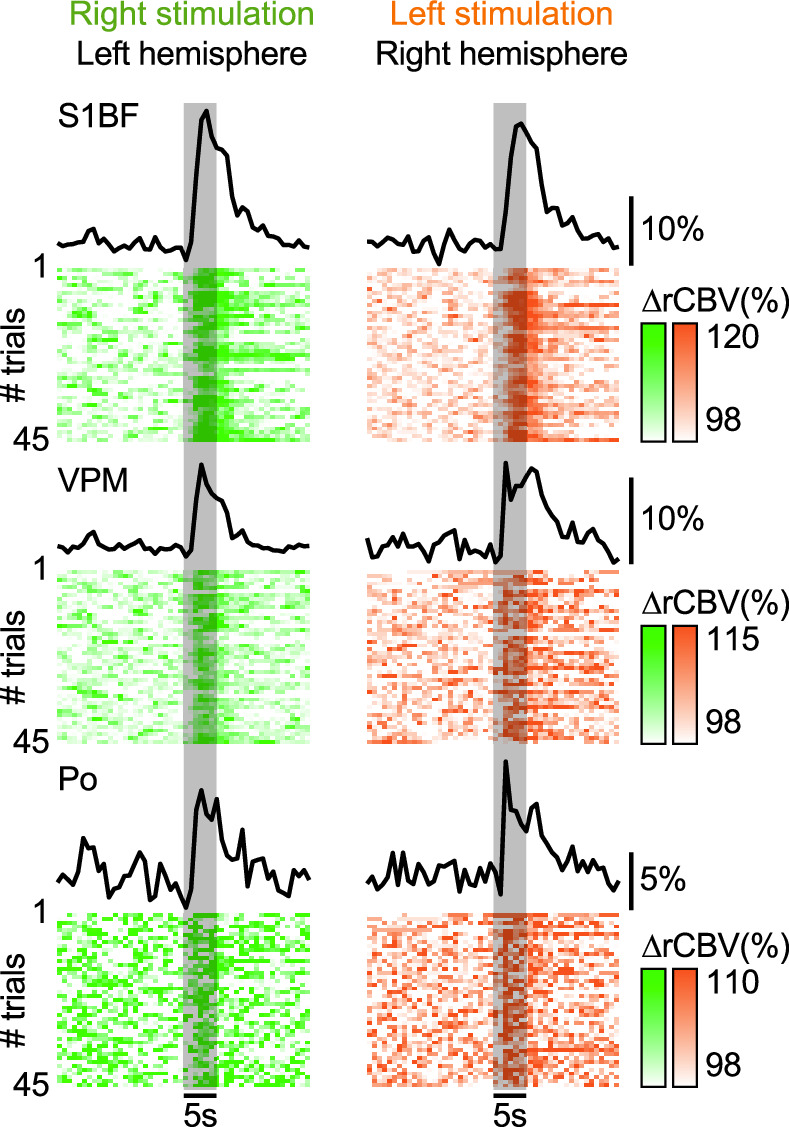
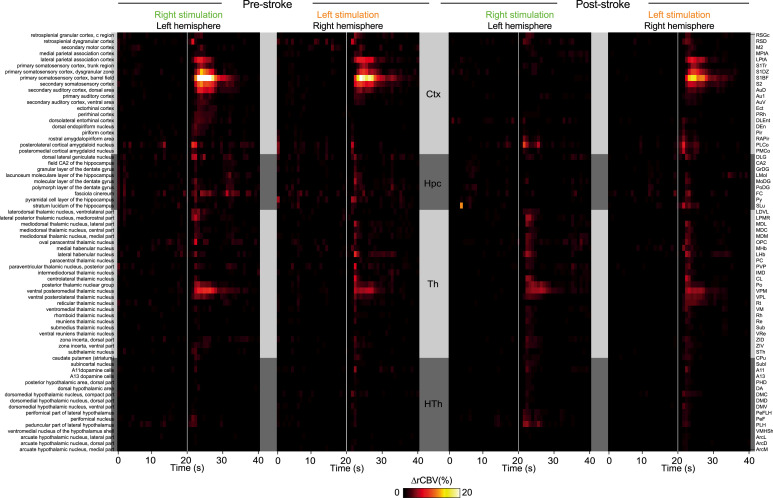
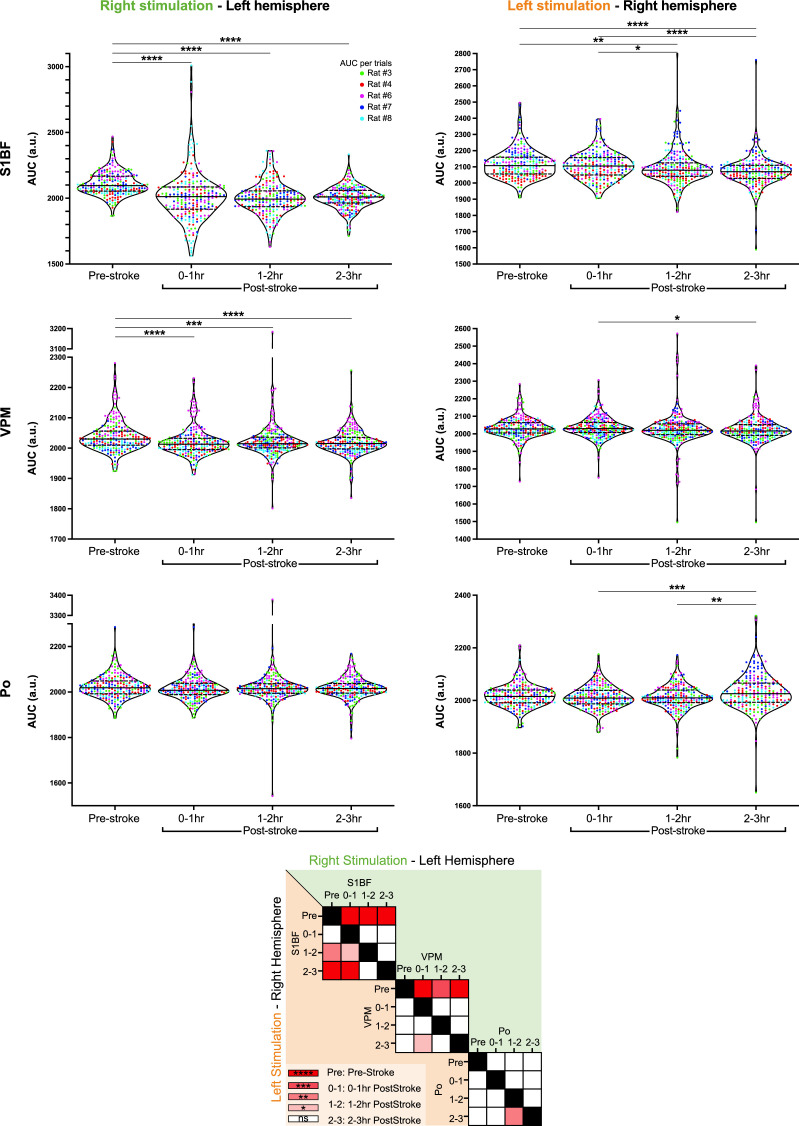
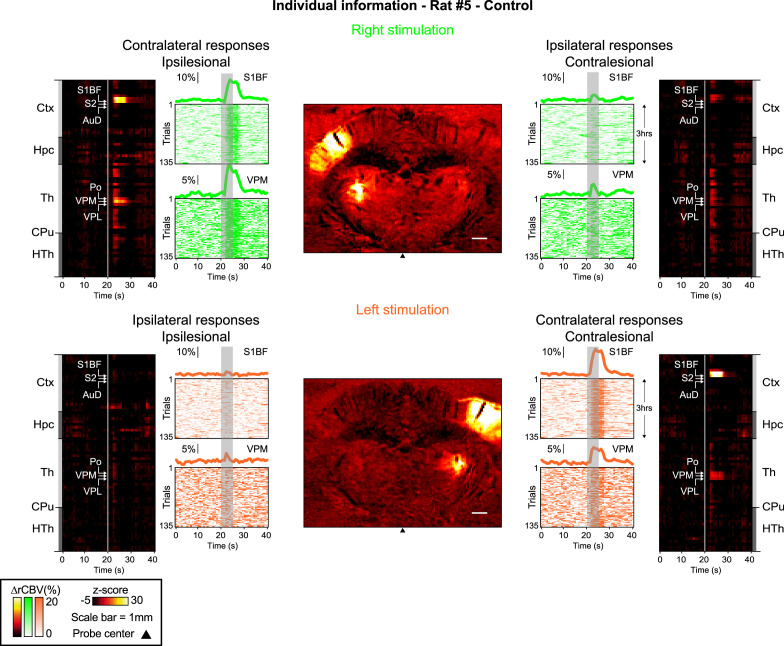
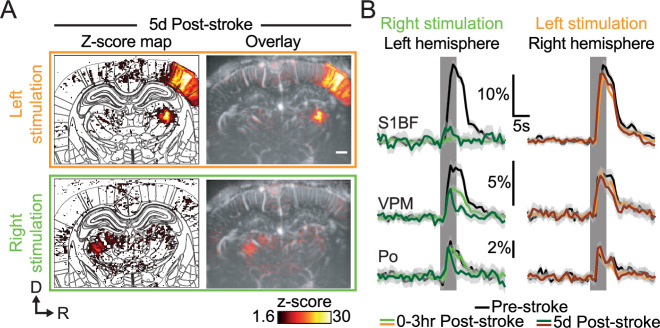
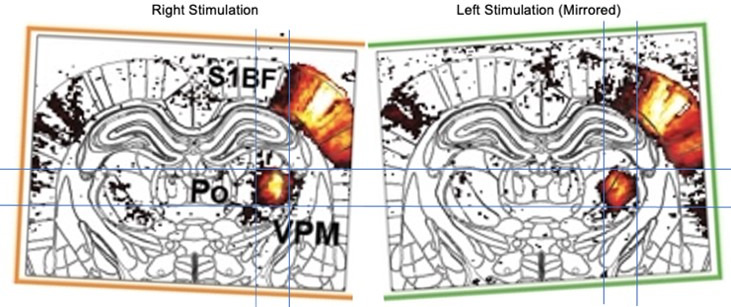
Anesthesia is a major confounding factor in preclinical stroke research as stroke rarely occurs in sedated patients. Moreover, anesthesia affects both brain functions and the stroke outcome acting as neurotoxic or protective agents. So far, no approaches were well suited to induce stroke while imaging hemodynamics along with simultaneous large-scale recording of brain functions in awake animals. For this reason, the first critical hours following the stroke insult and associated functional alteration remain poorly understood. Here, we present a strategy to investigate both stroke hemodynamics and stroke-induced functional alterations without the confounding effect of anesthesia, i.e., under awake condition. Functional ultrasound (fUS) imaging was used to continuously monitor variations in cerebral blood volume (CBV) in +65 brain regions/hemispheres for up to 3 hr after stroke onset. The focal cortical ischemia was induced using a chemo-thrombotic agent suited for permanent middle cerebral artery occlusion in awake rats and followed by ipsi- and contralesional whiskers stimulation to investigate on the dynamic of the thalamocortical functions. Early (0-3 hr) and delayed (day 5) fUS recording enabled to characterize the features of the ischemia (location, CBV loss), spreading depolarizations (occurrence, amplitude) and functional alteration of the somatosensory thalamocortical circuits. Post-stroke thalamocortical functions were affected at both early and later time points (0-3 hr and 5 days) after stroke. Overall, our procedure facilitates early, continuous, and chronic assessments of hemodynamics and cerebral functions. When integrated with stroke studies or other pathological analyses, this approach seeks to enhance our comprehension of physiopathologies towards the development of pertinent therapeutic interventions.

Keywords: awake rat; functional diaschisis; functional ultrasound imaging; ischemic stroke; neuroscience; rat; thalamocortical circuit.


Conflict of interest statement

CB, GM, AU No competing interests declared

Figures

Figure 1.
Figure 1.. Experimental procedure.
(A) Workflow for brain imaging of awake head-fixed rats including, from left to right: animal preparation (habituation to the bench, implantation of cranial windows, training), functional ultrasound (fUS) imaging of stroke induction and brain functions, data processing, and histopathology. (B) Overview of the headpost implantation and cranial windows developed for combined MCAo (left) and brain imaging (right) under awake conditions. (C) Computer-aided design of the experimental apparatus where the animal is placed and secured in a suspended sling suit and the head fixed by the means of clamps holding the headpost implanted to the rat skull. A, Anterior; D, Dorsal; L, Left.
Figure 2.
Figure 2.. Ferric chloride (FeCl3)-stroke induction under awake conditions.
(A) Front view representation of functional ultrasound (fUS) imaging during live chemo-thrombosis of the left middle cerebral artery (MCA) with FeCl3 in awake head-fixed rats. (B) Set of typical coronal µDoppler images of the brain microvasculature (top row) and morphological Bmode images (bottom row) before stroke (left), 3 hr (middle), and 5d after stroke onset (right) from the same animal. µDoppler images (top left) were registered and segmented based on a digital version of the rat brain atlas (white outlines). Colored outlines (cyan, purple, and black) delineate regions of interest plotted in (C) and (D). The white dotted region of interest highlights the ischemia in µDoppler images (Top row) and tissue hyper-echogenicity in Bmode (Bottom row). (C) Temporal plot of the average signal (∆rCBV (%), mean ± 95% CI, n=5) in the barrel-field primary somatosensory cortex (S1BF, cyan) from the left hemisphere, affected by the MCA occlusion (MCAo). (D) Temporal plots of the average signal (∆rCBV (%)) in the retrosplenial granular cortex (RSGc) from the affected (purple) and non-affected hemisphere (black) from the same animal. (E) Occurrence of spreading depolarizations after MCAo. Each horizontal line represents one rat; each triangle marker depicts the occurrence of one spreading depolarization. (F) Temporal plots of the average signal change (∆rCBV (%), mean ± 95% CI, respectively black line and gray band) of hemodynamic events associated with spreading depolarizations (centered on the peak) for each rat (#1–5). (G) Typical rat brain cross-sections stained by cresyl violet to evaluate the tissue infarction at 24 hr after FeCl3-induction occlusion of MCA. The infarcted territory is delineated in red. Scale bars: 1 mm. D: Dorsal; L: left; R: right.
Figure 2—figure supplement 1.
Figure 2—figure supplement 1.. Hemodynamic changes (relative cerebral blood volume (rCBV) in %) induced by MCA occlusion (MCAo) in 69 regions located in the ipsilesional (left panel) and contralesional hemisphere (right panel) of the imaged coronal cross-section.
Regions are organized by main anatomical structures (see Supplementary file 2). SDs stands for hemodynamic events associated with spreading depolarizations.
Figure 3.
Figure 3.. Early post-stroke alteration of whisker-to-barrel thalamocortical circuit.
(A) Front view representation of functional ultrasound (fUS) imaging during repetitive stimulation of the left (orange) or right whisker pad (green) with a mechanical comb in awake head-fixed rats. Whisker stimulations were delivered alternately between left and right whisker pads before and early after MCA occlusion (MCAo). Each rat receives 45 stimuli per whisker pad each hour of imaging. (B) Average activity maps (z-score) from one rat depicting evoked functional responses to either left (orange) or right whisker pads stimulation (green) registered with a digital version of the rat Paxinos atlas (white outlines) and overlaid with the corresponding coronal µDoppler image, before (left; Pre-stroke, average of 45 trials) and after stroke induction in the left hemisphere (right; Post-stroke, average of 125 trials). (C) Region-time traces of the average hemodynamic changes (∆rCBV (%)) in response to right (green) or left whisker stimulation (orange) extracted from the contralateral hemisphere (left and right, respectively) before (left; Pre-stroke, n=5, 45 trials/rat) and after stroke induction in the left hemisphere (right; Post-stroke, n=5, 135 trials/rat). Brain regions are ordered by major anatomical structures (see Supplementary file 2). The vertical line represents the stimulus start. S1BF, S2, AuD, VPM, VPL, and Po regions are brain regions significantly activated (all pvalue <0.01; GLM followed by t-test). A larger version of panel C is provided in Figure 3—figure supplement 2. (D) Left, Average response curves from the S1BF, the VPM, and Po regions before (Pre-stroke, black, n=5, 45 trials/rat), and from first to third hour after stroke induction (0–1 hr, 1–2 hr, 2–3 hr Post-stroke, orange and green, n=5, 45 trials/hr/rat). Data are mean ± 95% CI. The vertical bar represents the whisker stimulus. Right, Statistical comparison of the area under the curve (AUC) between pre-stroke and post-stroke response curves for S1BF, VPM, and Po regions (Non-parametric Kruskal-Wallis test corrected with Dunn’s test for multiple comparisons; ns: non-significant; *p<0.05; **p<0.01; ***p<0.001; ****p<0.0001. See also Figure 3—figure supplement 3). Scale bars: 1 mm. D: Dorsal; L: left; R: right; Ctx: Cortex; Hpc: Hippocampus; Th: Thalamus; CPu: Caudate Putamen; HTh: Hypothalamus; S1BF: barrel-field primary somatosensory cortex; S2: Secondary somatosensory cortex; AuD: Dorsal auditory cortex; VPM: Ventral posteromedial nucleus of the thalamus; VPL: Ventral postero-lateral nucleus of the thalamus; Po: Posterior nucleus of the thalamus.
Figure 3—figure supplement 1.
Figure 3—figure supplement 1.. Averaged hemodynamic response curves (∆rCBV in %) of 45 consecutive right (green) or left whisker stimulation (orange; 1 hr recording) extracted in the contralateral S1BF, VPM, and Po regions (top to bottom).
The corresponding individual trials presented below confirmed the stability across the recording. Vertical gray bar, the period of whisker stimulation.
Figure 3—figure supplement 2.
Figure 3—figure supplement 2.. Close-up view of Figure 3C.
Figure 3—figure supplement 3.
Figure 3—figure supplement 3.. Top Panel – Violin plots showing the distribution of the area under the curve (AUC) extracted from hemodynamic response time-courses of individual trials in S1BF (top row), VPM (middle row), and Po regions (bottom row), for stimulation delivered either to the right (left column) or left whisker pad (right column) along all the periods of the recording (Pre-Stroke, 0–1 hr Post-stroke, 1–2 hr Post-Stroke, 2–3 hr Post-Stroke).
Each dot represents an individual trial, each color depicts a rat. Bottom Panel – Matrix comparing AUC from S1BF, VPM, and Po for right (green - top right diagonal) or left stimulation (orange - bottom left diagonal) at Pre-Stroke, 0–1 hr Post-stroke, 1–2 hr Post-Stroke, and 2–3 hr Post-Stroke timepoints. AUC were compared and analyzed using a non-parametric Kruskal-Wallis test corrected for multiple comparison using a Dunn’s test.
Figure 3—figure supplement 4.
Figure 3—figure supplement 4.. Activity maps, region-time traces of the 69 brain regions imaged, mean and individual time-courses for all trials (left and right stimuli - including contra- and ipsilateral traces) and imaging timepoints (Control, Pre-Stroke, Post-Stroke) for all the rats included in this work.
Figure 4.
Figure 4.. Late post-stroke alteration of whisker-to-barrel thalamocortical circuit.
(A) Activity maps (z-score; average of 45 trials) depicting evoked functional responses to left (orange) or right whisker pads stimulation (green) 5d after stroke induction. Z-score maps are registered with the Paxinos atlas (white outlines; Left) and overlaid with the corresponding coronal µDoppler image (Right). (B) Left; Average response curves to left and right whisker stimulation (orange and green; respectively) extracted from S1BF, VPM, and Po before (Pre-stroke, black, n=2, 45 trials/rat), 0–3 hr (0–3 hr Post-Stroke; light orange/green, n=2, 45 trials/hr/rat) and 5d after stroke induction (5d Post-stroke, dark orange/green, n=2, 45 trials/rat). Data are mean ± 95% CI. The vertical bar represents the whisker stimulus. Scale bars: 1 mm. D: Dorsal; R: right; S1BF: barrel-field primary somatosensory cortex; VPM: Ventral posteromedial nucleus of the thalamus; Po: Posterior nucleus of the thalamus.
Author response image 1.

Update of

References

    1. Abo M, Chen Z, Lai LJ, Reese T, Bjelke B. Functional recovery after brain lesion--contralateral neuromodulation: an fMRI study. Neuroreport. 2001;12:1543–1547. doi: 10.1097/00001756-200105250-00048. - DOI - PubMed
    1. Adibi M. Whisker-mediated touch system in rodents: From neuron to behavior. Frontiers in Systems Neuroscience. 2019;13:40. doi: 10.3389/fnsys.2019.00040. - DOI - PMC - PubMed
    1. Ayata C, Dunn AK, Gursoy-Özdemir Y, Huang Z, Boas DA, Moskowitz MA. Laser speckle flowmetry for the study of cerebrovascular physiology in normal and ischemic mouse cortex. Journal of Cerebral Blood Flow & Metabolism. 2004;24:744–755. doi: 10.1097/01.WCB.0000122745.72175.D5. - DOI - PubMed
    1. Ayata C, Lauritzen M. Spreading depression, spreading depolarizations, and the cerebral vasculature. Physiological Reviews. 2015;95:953–993. doi: 10.1152/physrev.00027.2014. - DOI - PMC - PubMed
    1. Aydin C, Grace CE, Gordon CJ. Effect of physical restraint on the limits of thermoregulation in telemetered rats. Experimental Physiology. 2011;96:1218–1227. doi: 10.1113/expphysiol.2011.060301. - DOI - PubMed

Publication types