. 2023 Nov 28;120(48):e2303562120.
doi: 10.1073/pnas.2303562120. Epub 2023 Nov 21.

Parametric information about eye movements is sent to the ears

Affiliations

Parametric information about eye movements is sent to the ears

Stephanie N Lovich et al. Proc Natl Acad Sci U S A. .

Abstract

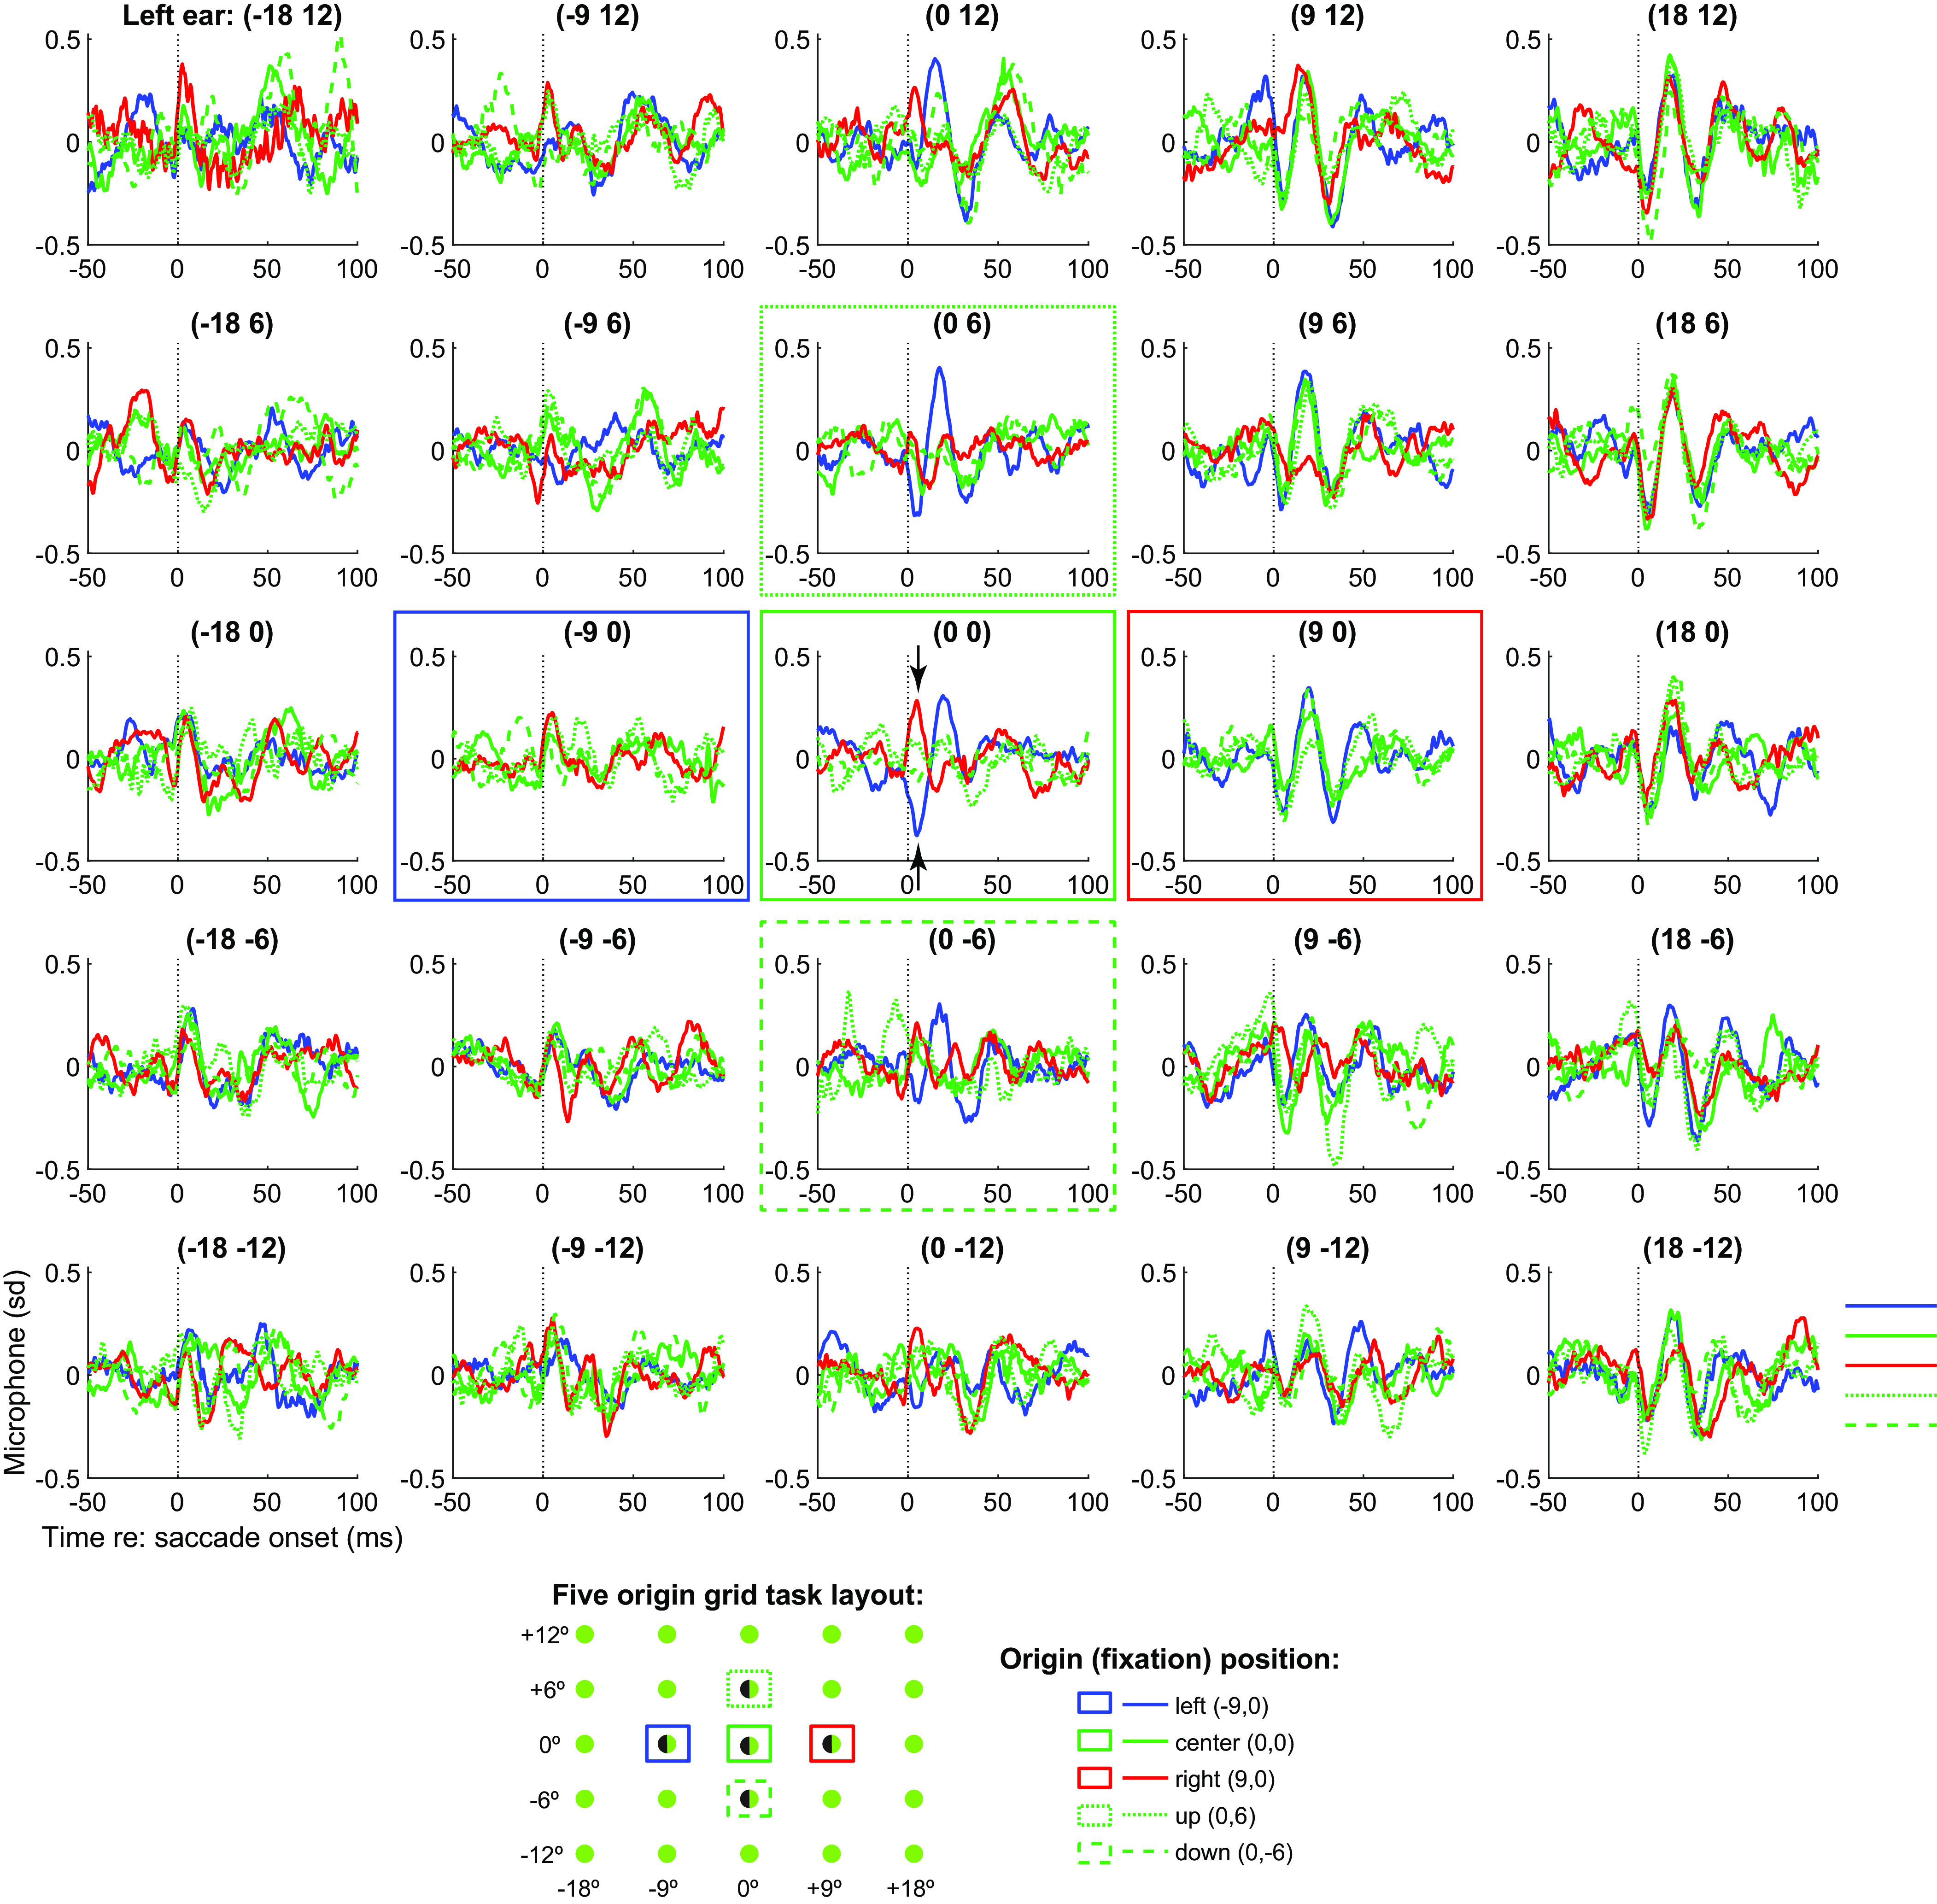
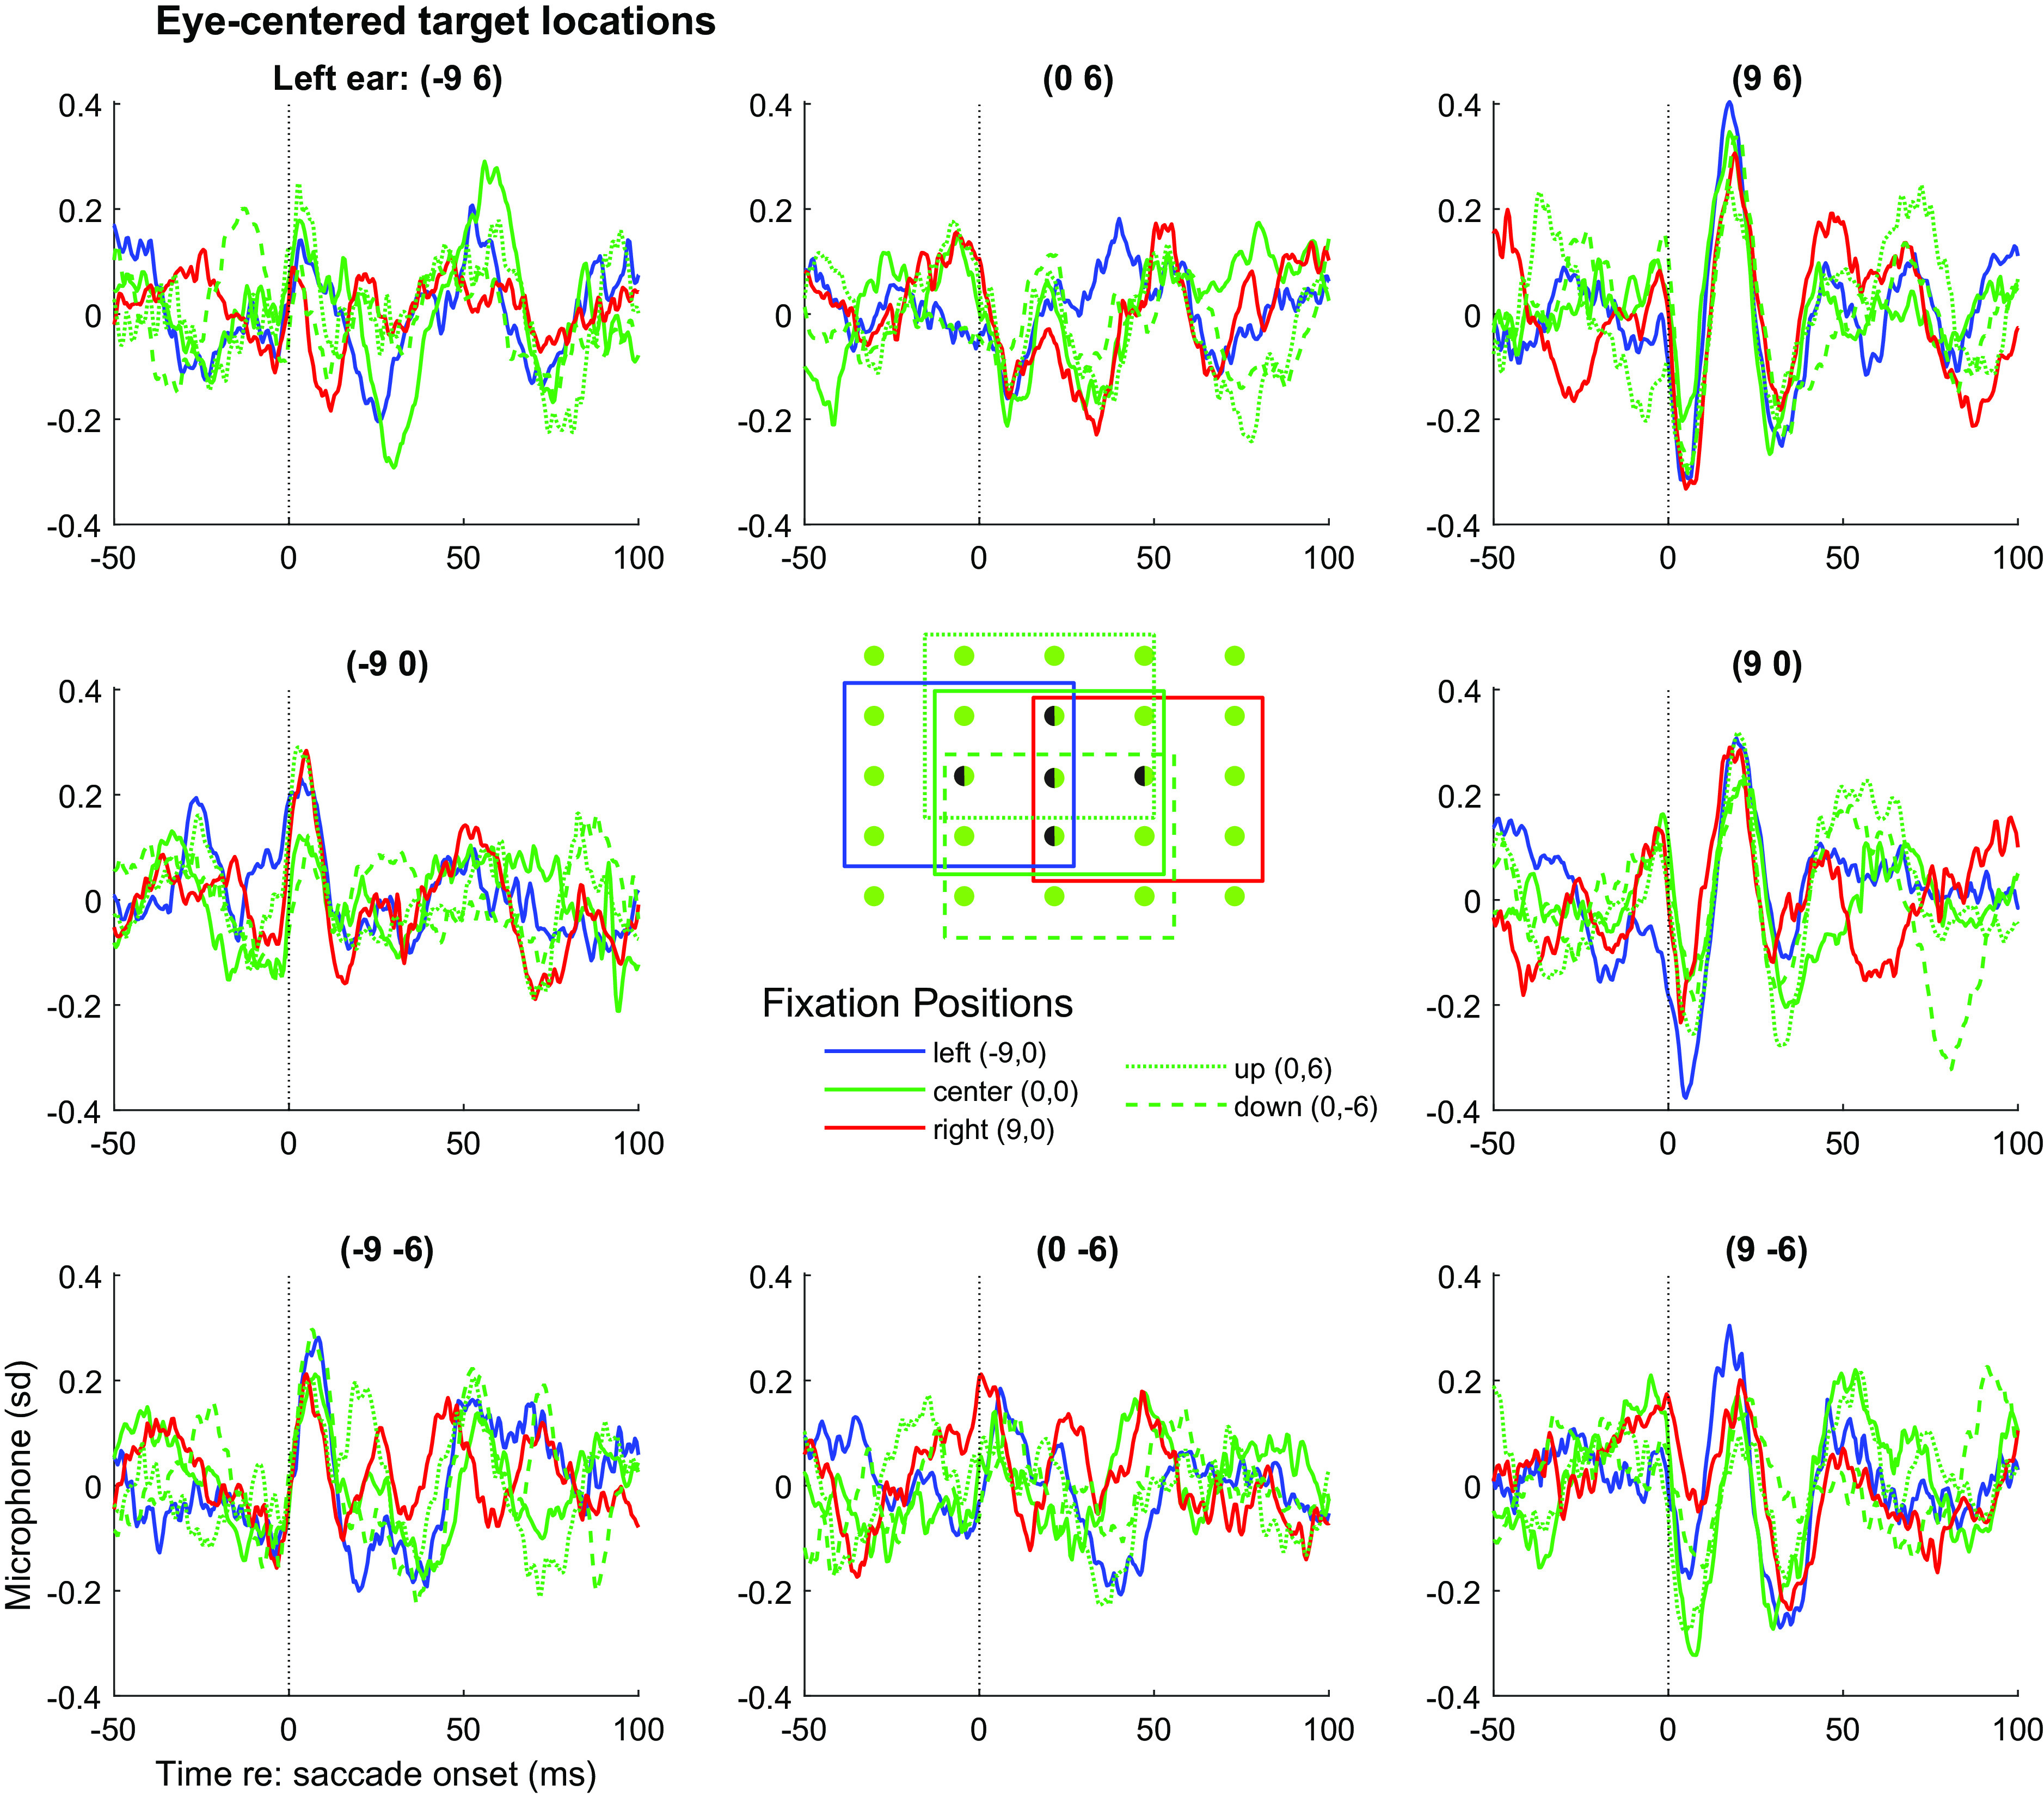
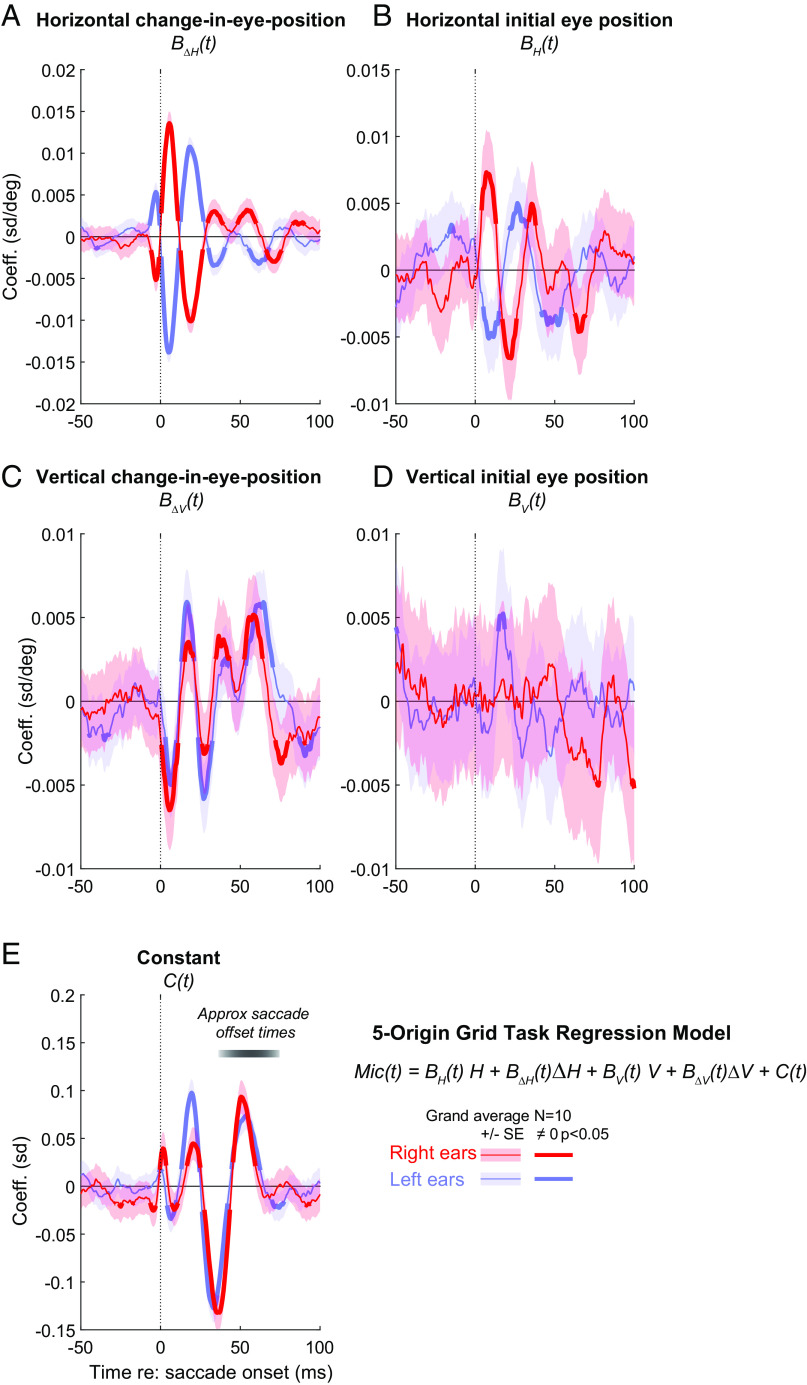
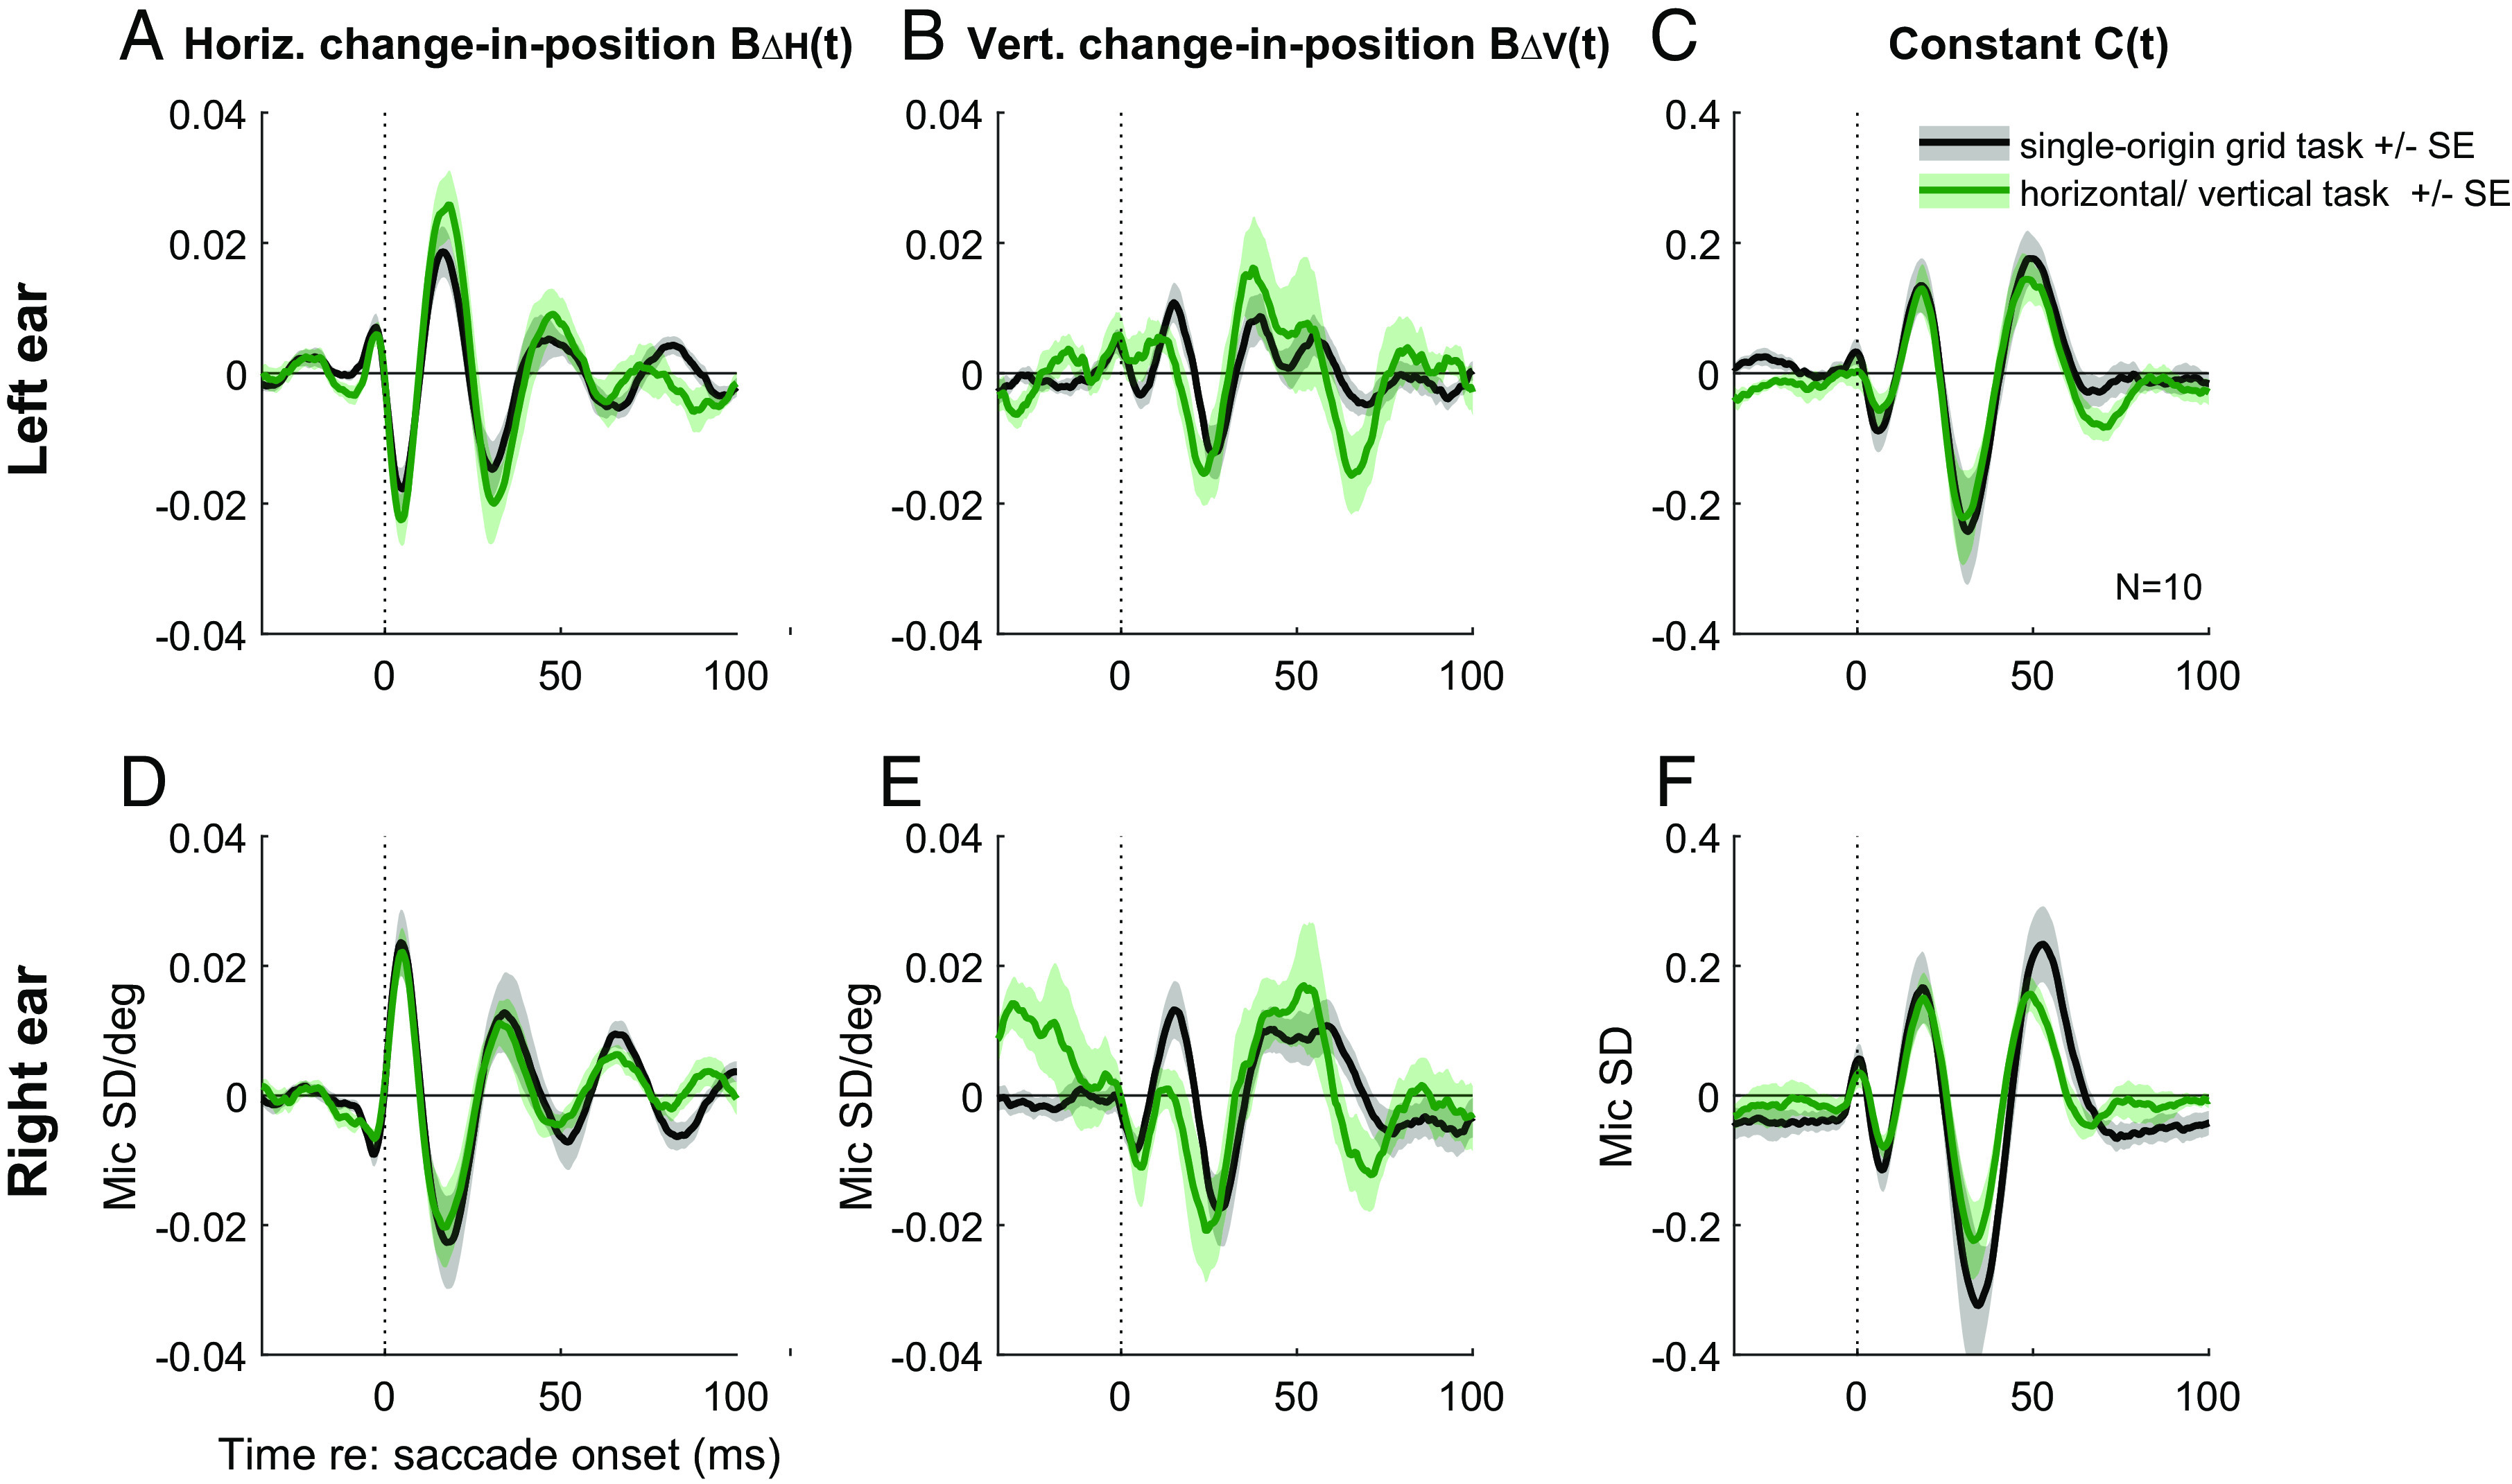
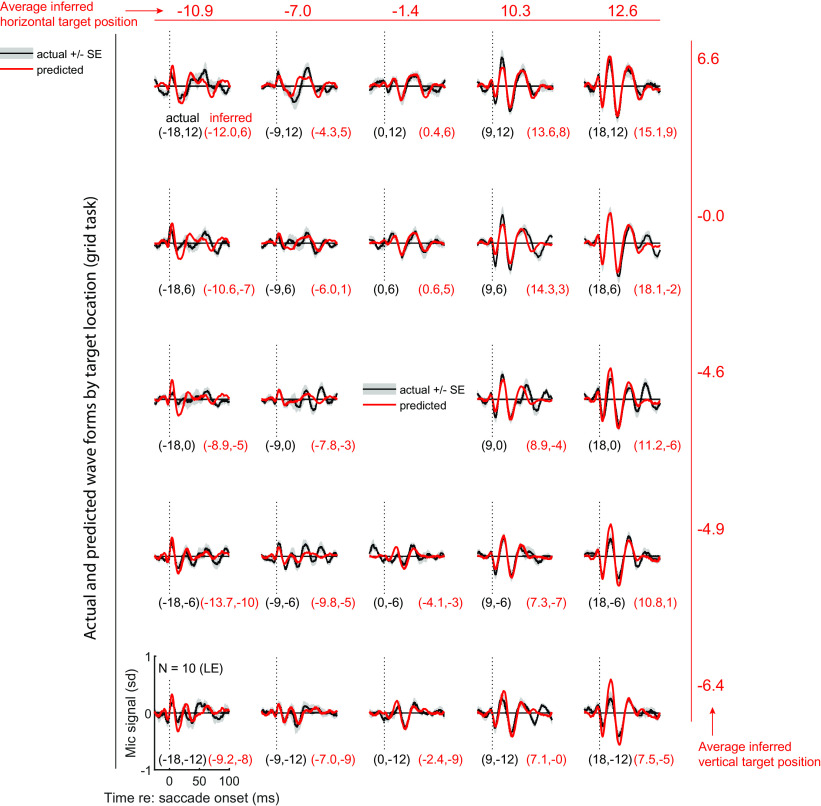
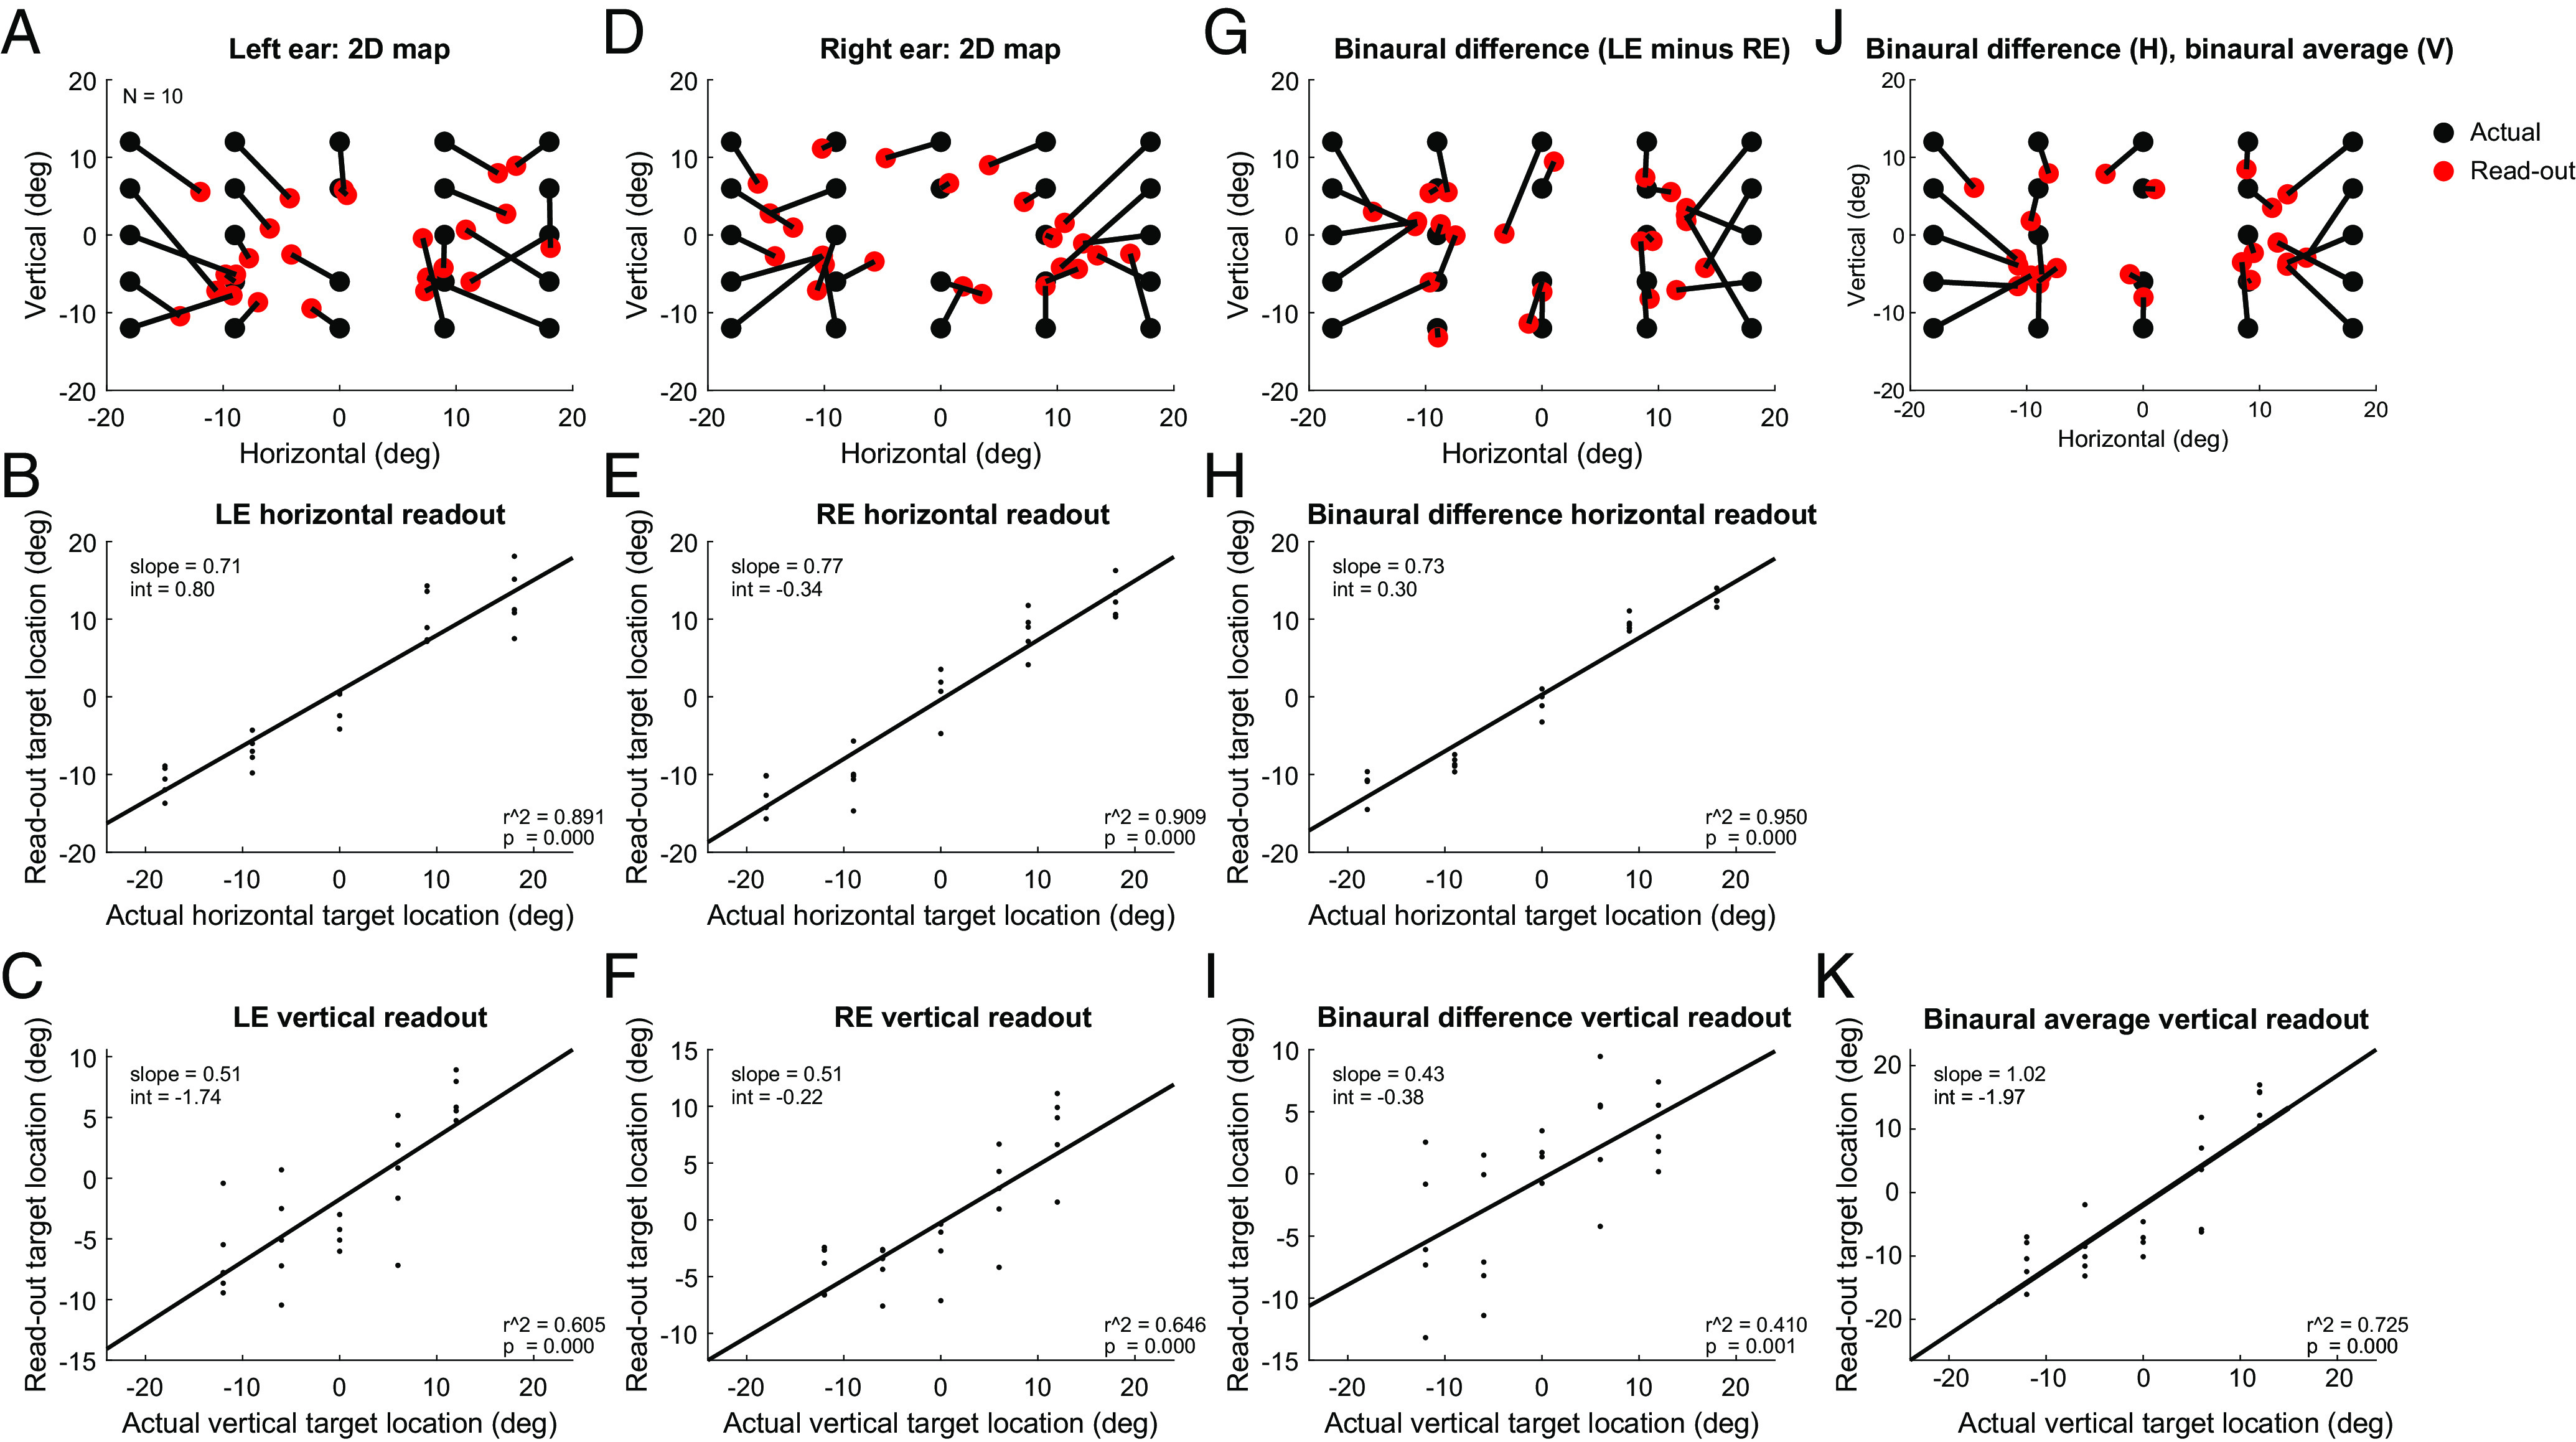
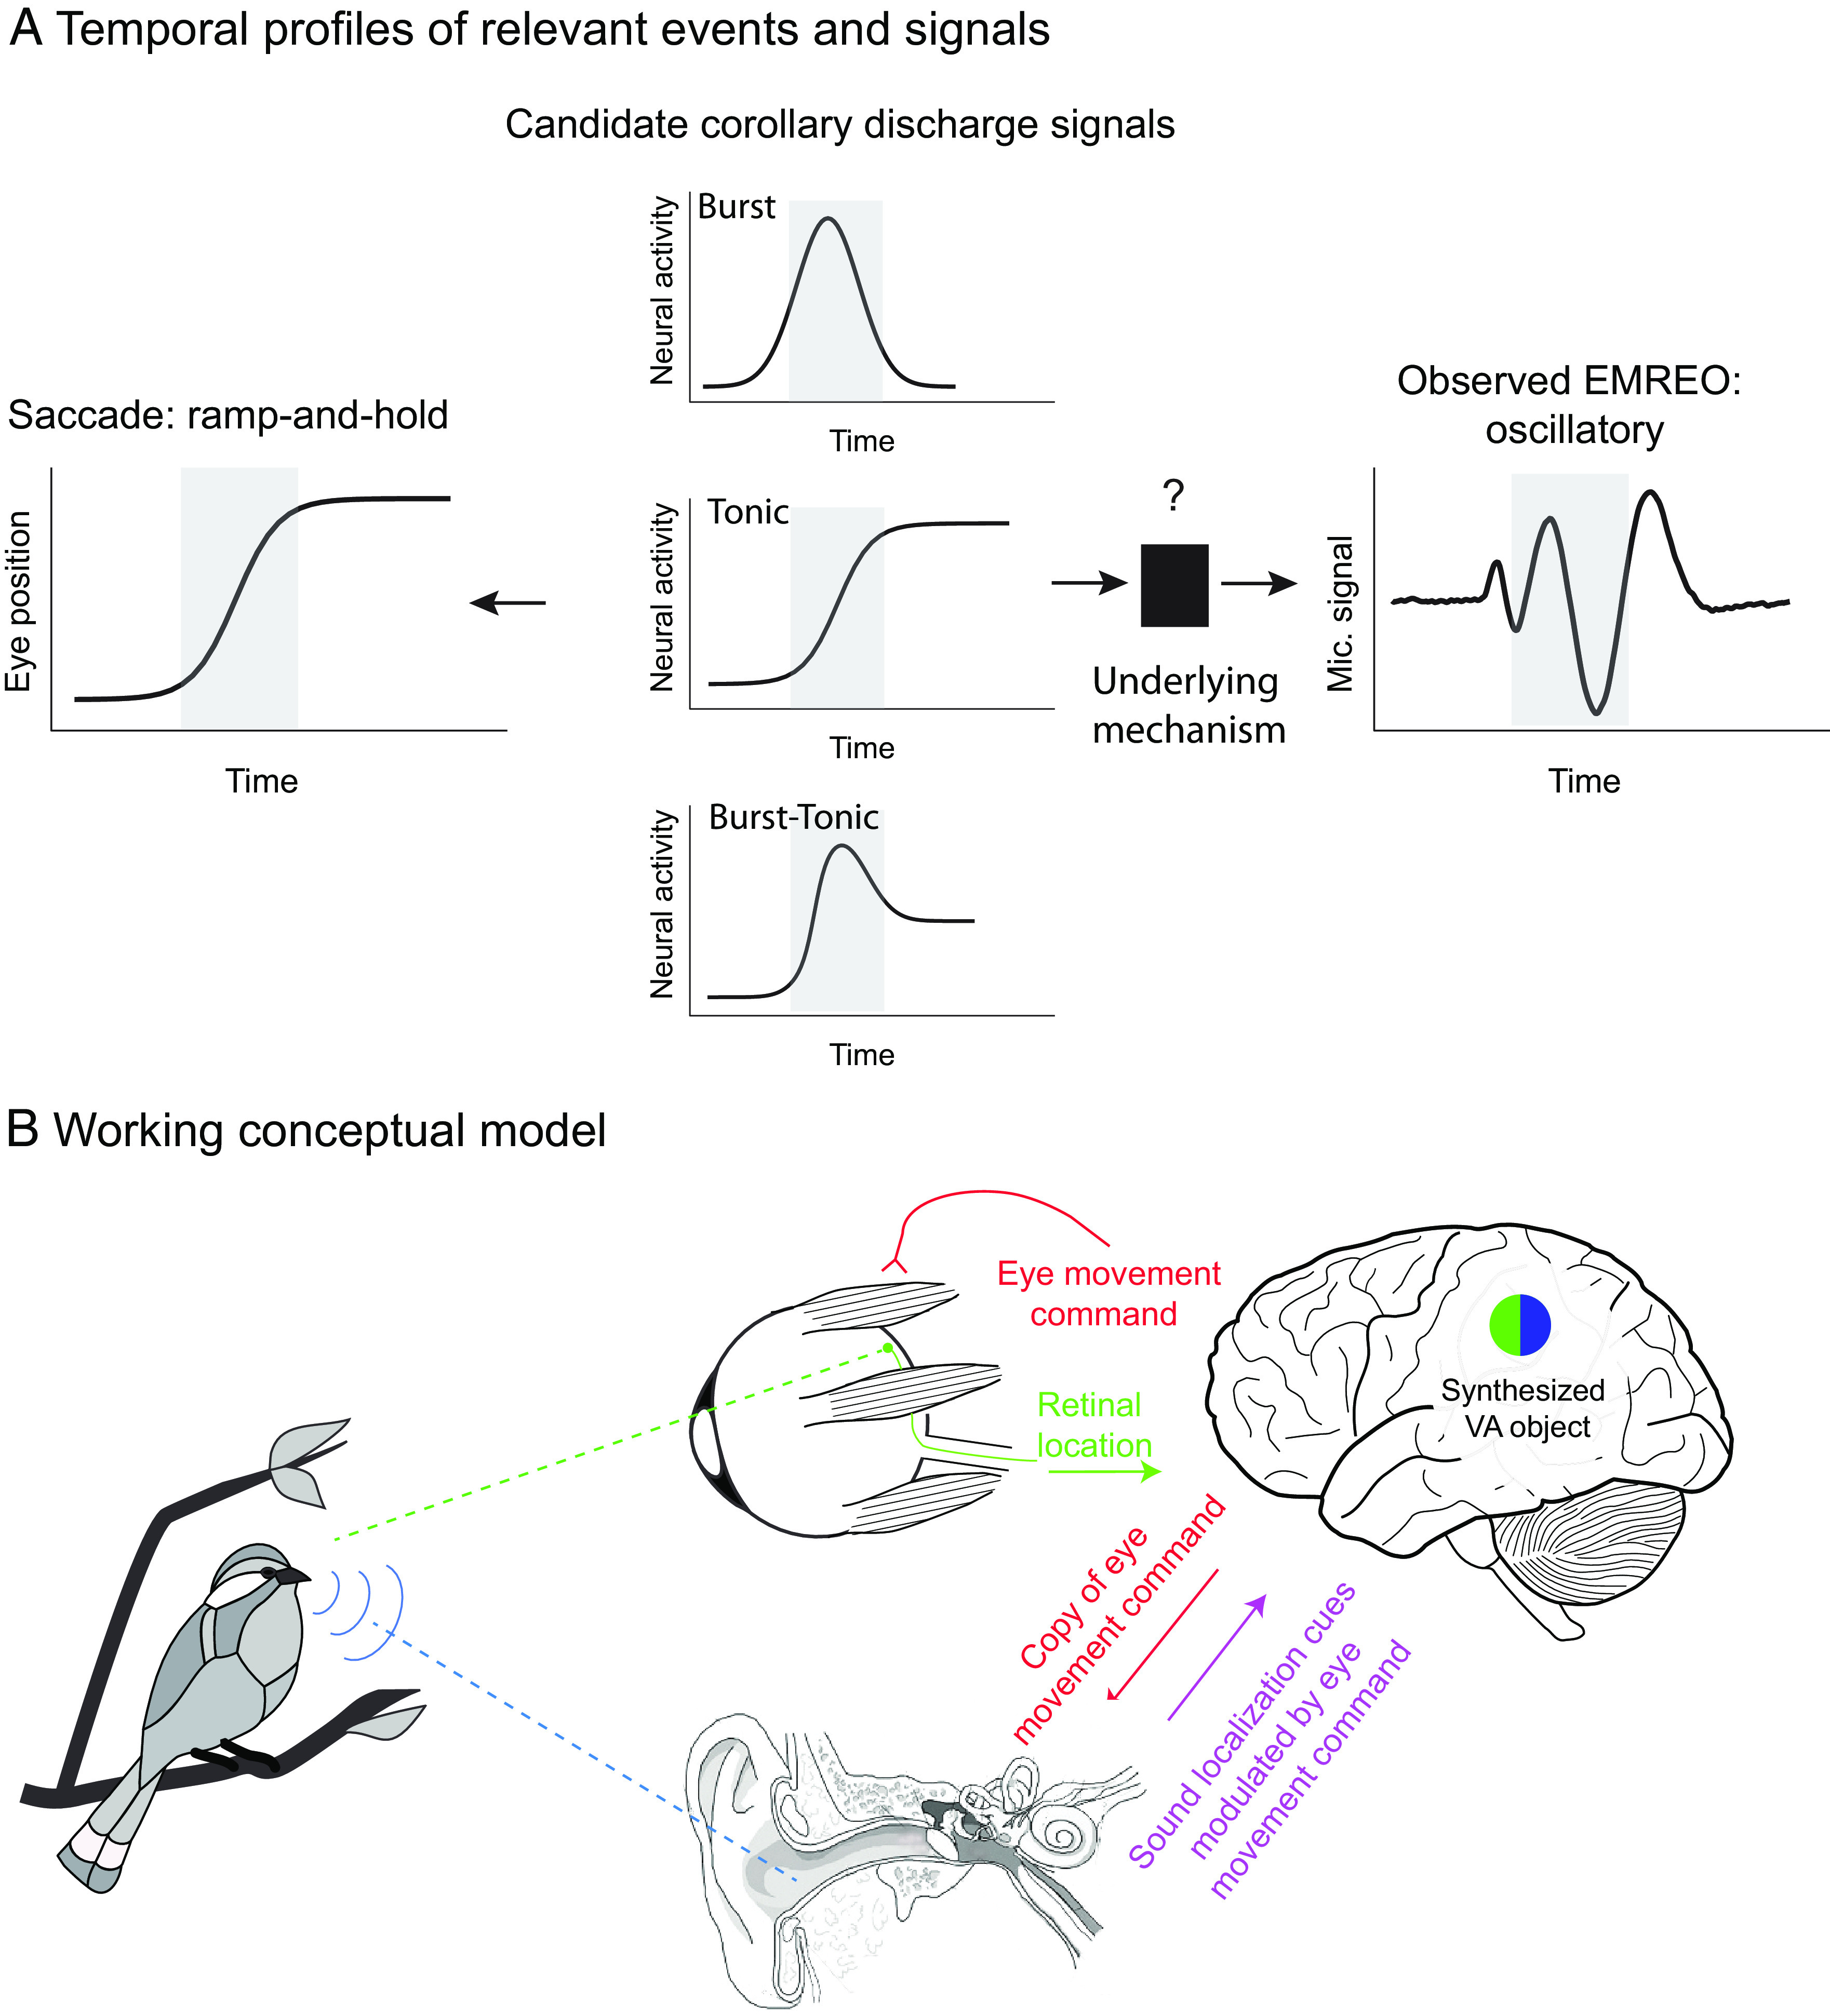
Eye movements alter the relationship between the visual and auditory spatial scenes. Signals related to eye movements affect neural pathways from the ear through auditory cortex and beyond, but how these signals contribute to computing the locations of sounds with respect to the visual scene is poorly understood. Here, we evaluated the information contained in eye movement-related eardrum oscillations (EMREOs), pressure changes recorded in the ear canal that occur in conjunction with simultaneous eye movements. We show that EMREOs contain parametric information about horizontal and vertical eye displacement as well as initial/final eye position with respect to the head. The parametric information in the horizontal and vertical directions can be modeled as combining linearly, allowing accurate prediction of the EMREOs associated with oblique (diagonal) eye movements. Target location can also be inferred from the EMREO signals recorded during eye movements to those targets. We hypothesize that the (currently unknown) mechanism underlying EMREOs could impose a two-dimensional eye-movement-related transfer function on any incoming sound, permitting subsequent processing stages to compute the positions of sounds in relation to the visual scene.

Keywords: coordinate transformations; otoacoustic emissions; reference frames; saccades; sound localization.


Conflict of interest statement

Competing interests statement:The authors declare no competing interest.

Figures

Fig. 1.
Fig. 1.
EMREOs recorded during the five-origin grid task. Each panel shows the grand average EMREO signal generated when saccades were made to that location on the screen (average of N = 10 subjects’ individual left ear averages). For example, the Top Right panel shows microphone recordings during saccades to the top right (contralateral) target location, and the color and line styles of each trace in that panel correspond to saccades from different initial fixation points. e.g., the red traces originated from the rightward fixation, the blue from the leftward fixation etc., as indicated by the legend and boxes of the same color and line style. Both magnitude and phase vary as a function of initial eye position and target location, with contralateral responses being larger than ipsilateral. Phase reversal occurs based on the location of the target with respect to the initial fixation position, as can be seen for the central target location (Central), where the EMREOs evoked for saccades from the rightward fixation (red traces) show an opposite phase relationship as those evoked for saccades from the leftward fixation (blue traces). Corresponding grand averages for right ear data are shown in SI Appendix, Fig. S3. These data are presented in Z-units; the peak-equivalent sound levels for 18 degree horizontal targets are roughly 55 to 56 dB SPL; see SI Appendix, Fig. S2 for the mean and distributions across the subject population (range ~49 to 64 dB SPL).
Fig. 2.
Fig. 2.
Replotting the grand average EMREOs as a function of relative target location shows better, but not perfect, correspondence of the EMREOs across different fixation positions. The data shown are a subset of those shown in Fig. 1, but here each panel location corresponds to a particular target location defined relative to the associated fixation position. The color/linestyle indicates the associated relative fixation position. For example, the waveforms in the upper right panel all involved 9° rightward and 6° upward saccades; the red trace in that panel indicates those that originated from the 9° right fixation; the blue those from the 9° left fixation etc. Only relative target locations that existed for all 5 fixation positions are plotted, as indicated by the inset. Corresponding right ear data are shown in SI Appendix, Fig. S4.
Fig. 3.
Fig. 3.
Regression analysis of EMREOs shows contributions from multiple aspects of eye movement: horizontal change-in-eye position (A), horizontal initial eye position (B), and vertical change-in-eye-position (C). The contribution of vertical initial eye position was weaker (D). Finally, the constant component showed a contribution that was also consistent across saccades (E). The regression involved modeling the microphone signal at each time point, and each panel shows the time varying values of the coefficients associated with the different aspects of the eye movement (horizontal vs. vertical, change-in-position and initial position). The regressions were fit to individual subjects’ microphone recordings and plotted here as grand averages of these regression coefficients across the N = 10 subjects tested in the 5-origin grid task. Microphone signals were z-scored in reference to baseline variability during a period −150 to 120 ms prior to saccade onset. Results are presented in units of SD (panel E) or SD per degree (panels AD). Shaded areas represent ±SEM.
Fig. 4.
Fig. 4.
Different tasks generate similar regression coefficient curves. Grand average of the regression results for the single-origin grid (black lines) and horizontal/vertical (green lines) tasks. The horizontal change-in-position (A), the vertical change in position (B), and the constant component (C) are shown for the left ear. The lines and shading represent the average and SE of the coefficient values across the same 10 subjects for the two tasks. The same information is also shown for the right ear (D–F).See SI Appendix, Fig. S5 for corresponding findings among the individual subjects.
Fig. 5.
Fig. 5.
Regression coefficients fit to microphone recordings from the horizontal/vertical-saccade task can be used to predict the waveforms observed in the grid task and their corresponding target locations. Combined results for all N = 10 participants’ left ears. The black traces indicate the grand average of all the individual participants’ mean microphone signals during the single-origin grid task, with the shading indicating ± the SE across participants. The red traces show an estimate of the EMREO at that target location based only on regression coefficients measured from the horizontal/vertical task. Black values in parentheses are the actual horizontal and vertical coordinates for each target in the grid task. Corresponding red values indicate the inferred target location based on solving a multivariate regression which fits the observed grid task microphone signals in a time window (−5 to 70 ms with respect to saccade onset) to the observed regression weights from the horizontal/vertical task for each target location. The averages of these values in the horizontal and vertical dimensions are shown across the top and right sides. See Fig. 6 for additional plots of the inferred vs actual target values and SI Appendix, Fig. S6 for corresponding right-ear data.
Fig. 6.
Fig. 6.
Multiple ways of reading out target location from the ear canal recordings. As in Fig. 5 and SI Appendix, Fig. S6, the relationship between EMREOs and eye movements was quantitatively modelled using Eq. 2 and the ear canal data recorded in the horizontal/vertical task. Inferred grid task target location was read out by solving Eq. 2 for ΔH and ΔV using the coefficients as fit from the horizontal/vertical task and the microphone values as observed in the single-origin grid task; see main text for details. (A) Inferred target location (red) compared to actual target location (black), based on the left ear (same data as in Fig. 5). (B) Horizontal component of the read-out target vs the actual horizontal component (left ear microphone signals). (C) Same as (B) but for the vertical component. (DF) Same as AC but for the right ear. (GI) Same as (AC) and (DF) but computed using the binaural difference between the microphone signals (left ear—right ear). (J and K) A hybrid read-out model (J) using binaural difference in the horizontal dimension (H) and binaural average in the vertical dimension (K). Related findings at the individual subject level are provided in SI Appendix, Fig. S7.
Fig. 7.
Fig. 7.
Temporal profiles of relevant signals and working conceptual model for how EMREOs might relate to our ability to link visual and auditory stimuli in space. (A) Temporal profiles of signals. The EMREO is oscillatory, whereas the eye movement to which it is synchronized involves a ramp-and-hold temporal profile. Candidate source neural signals in the brain might exhibit a ramp-and-hold (tonic) pattern, suggesting a ramp-and-hold-like underlying effect on an as-yet-unknown peripheral mechanism, or could derive from other known temporal profiles including bursts of activity time-locked to saccades. (B) Working conceptual model. The brain causes the eyes to move by sending a command to the eye muscles. Each eye movement shifts the location of visual stimuli on the retinal surface. A copy, possibly a highly transformed one, of this eye movement command is sent to the ear, altering ear mechanics in some unknown way. When a sound occurs, the ascending signal to the brain will depend on the combination of its location in head-centered space (based on the physical values of binaural timing and level differences and spectral cues) and aspects of recent eye movements and fixation position. This hybrid signal could then be readout by the brain.

Similar articles

Cited by

References

    1. Groh J. M., Sparks D. L., Two models for transforming auditory signals from head-centered to eye- centered coordinates. Biol. Cybernetics 67, 291–302 (1992). - PubMed
    1. Boucher L., Groh J. M., Hughes H. C., Afferent delays and the mislocalization of perisaccadic stimuli. Vis. Res. 41, 2631–2644 (2001). - PubMed
    1. Metzger R. R., Mullette-Gillman O. A., Underhill A. M., Cohen Y. E., Groh J. M., Auditory saccades from different eye positions in the monkey: Implications for coordinate transformations. J. Neurophysiol. 92, 2622–2627 (2004). - PubMed
    1. Caruso V. C., Pages D. S., Sommer M. A., Groh J. M., Compensating for a shifting world: Evolving reference frames of visual and auditory signals across three multimodal brain areas. J. Neurophysiol. 126, 82–94 (2021). - PMC - PubMed
    1. Fu K. M., et al. , Timing and laminar profile of eye-position effects on auditory responses in primate auditory cortex. J. Neurophysiol. 92, 3522–3531 (2004). - PubMed

LinkOut - more resources