. 2024 Feb:108:56-62.
doi: 10.1016/j.gaitpost.2023.11.008. Epub 2023 Nov 17.

Reliability and minimal detectable change of stiffness and other mechanical properties of the ankle joint in standing and walking

Affiliations

Reliability and minimal detectable change of stiffness and other mechanical properties of the ankle joint in standing and walking

Luis H Cubillos et al. Gait Posture. 2024 Feb.

Abstract

Background: Ankle joint stiffness and viscosity are fundamental mechanical descriptions that govern the movement of the body and impact an individual's walking ability. Hence, these internal properties of a joint have been increasingly used to evaluate the effects of pathology (e.g., stroke) and in the design and control of robotic and prosthetic devices. However, the reliability of these measurements is currently unclear, which is important for translation to clinical use.

Research question: Can we reliably measure the mechanical impedance parameters of the ankle while standing and walking?

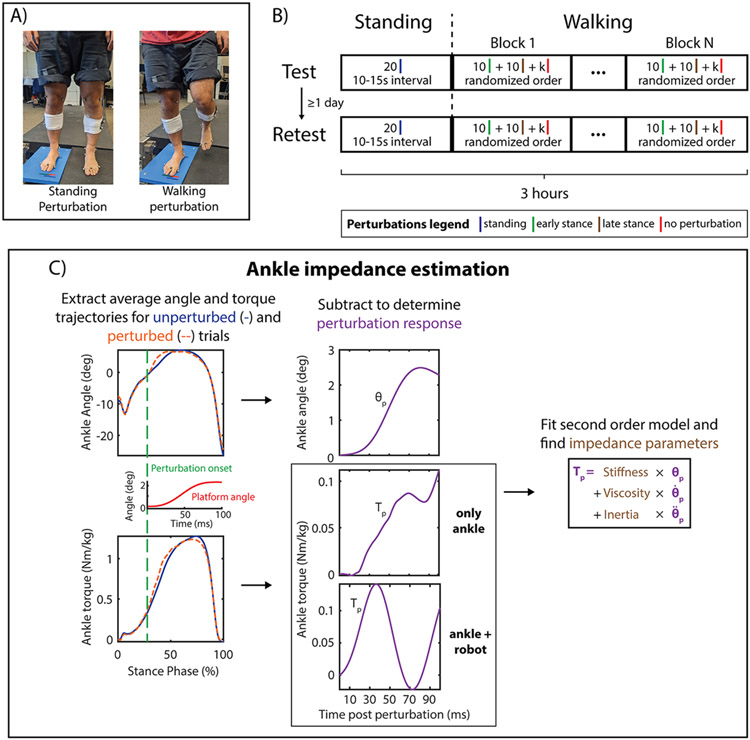
Methods: Eighteen able-bodied individuals volunteered to be tested on two different days separated by at least 24 h. Participants received several small random ankle dorsiflexion perturbations while standing and during the stance phase of walking using a custom-designed robotic platform. Three-dimensional motion capture cameras and a 6-component force plate were used to quantify ankle joint motions and torque responses during normal and perturbed conditions. Ankle mechanical impedance was quantified by computing participant-specific ensemble averages of changes in ankle angle and torque due to perturbation and fitting a second-order parametric model consisting of stiffness, viscosity, and inertia. The test-retest reliability of each parameter was assessed using intraclass correlation coefficients (ICCs). We also computed the minimal detectable change (MDC) for each impedance parameter to establish the smallest amount of change that falls outside the measurement error of the instrument.

Results: In standing, the reliability of stiffness, viscosity, and inertia was good to excellent (ICCs=0.67-0.91). During walking, the reliability of stiffness and viscosity was good to excellent (ICCs=0.74-0.84) while that of inertia was fair to good (ICCs=0.47-0.68). The MDC for a single subject ranged from 20%- 65% of the measurement mean but was higher (>100%) for inertia during walking.

Significance: Results indicate that dynamic measures of ankle joint impedance were generally reliable and could serve as an adjunct clinical tool for evaluating gait impairments.

Keywords: Biomechanics; Joint stiffness; Neural control; Rehabilitation; Robot; Stroke.


Conflict of interest statement

Declaration of Competing Interest All authors declare that they have no conflict of interest.

Figures

Figure 1:
Figure 1:
Experimental protocol and ankle impedance estimation method. (A) Each session was split into a standing block and multiple walking blocks. The left image shows an example of a standing perturbation, while the right one is of a walking perturbation, both for a right-leg dominant participant. The blue platform shown in the picture conveys the perturbation and measures the ground reaction forces. (B) The Test and Retest sessions were replicas of each other and were scheduled with at least one day between them. Each session started with a standing block, where participants received 20 perturbations with a 10 to 15 seconds inter-perturbation delay. During a walking block, 20 perturbations were applied: 10 during the early stance and 10 more during the late stance. For each walking trial, there was a 50% chance of applying a perturbation, which means that not all trials contain a perturbation (represented by k unperturbed trials in the figure). (C) Description of the method used to estimate impedance from measured ankle angle and torque while walking. First, ankle angle and torque (with and without the robot’s inertia) are extracted from perturbed and unperturbed trials; the platform angle for a sample perturbation is shown in red (left). Then, the ensemble trajectory of the unperturbed trials is subtracted from each perturbed trial trajectory to view the perturbation-only response, and a 100ms window around the perturbation is extracted (10ms before perturbation, 90ms after perturbation; middle part of the figure). The average subtracted angle (with the offset removed) is then numerically differentiated [43] to extract velocity and acceleration. Finally, angle, velocity, and acceleration are used to fit a second-order model to the average subtracted torque response (with the offset removed) and find the impedance parameters (right). Please refer to the online version for a color version of this figure.
Figure 2:
Figure 2:
Correlation and Bland-Altman plots for the stiffness and viscosity parameters between sessions for standing and walking. (A)-(D) show the correlation plots between the Test and Retest sessions for stiffness (first column) and viscosity (second column) during standing (first row) and walking (second row). Blue circles represent values from individual values in the “only ankle” case. Orange squares represent individual values in the “ankle + robot” case. The blue and orange segmented lines represent a linear fit to the data from the “only ankle” and “ankle + robot” cases, respectively, while the black segmented lines show a line of unit slope and zero intercept for reference. The blue and orange text represents the Pearson correlation coefficient between Test and Retest for each corresponding case. (E)-(H) show the Bland-Altman plots for the Test and Retest sessions for stiffness (first column) and viscosity (second column) during standing (first row) and walking (second row). Blue circles and orange squares represent individual values for the “only ankle” and “ankle + robot” cases, respectively. The x-axis on each plot corresponds to the mean between the Test and Retest sessions for each individual value and the y-axis represents the difference between the sessions. The solid blue and orange lines show the mean difference for each case, while the dotted lines represent the 95% confidence interval (1.96 * SD). Stiffness and viscosity showed good correlation and agreement, being close to the dashed black line in the correlation plots in most cases and remaining inside the 95% confidence interval in the Bland-Altman plots. Note for interpretation of the references to color in the figure legend, please refer to the online version of this article.

References

    1. Epro G, McCrum C, Mierau A, Leyendecker M, Bruggemann GP, Karamanidis K. Effects of triceps surae muscle strength and tendon stiffness on the reactive dynamic stability and adaptability of older female adults during perturbed walking. J Appl Physiol (1985). 2018;124:1541–9. - PubMed
    1. Ho CY, Bendrups AP. Ankle reflex stiffness during unperceived perturbation of standing in elderly subjects. J Gerontol A Biol Sci Med Sci. 2002;57:B344–50. - PubMed
    1. Kim S, Lockhart T. Lower limb control and mobility following exercise training. J Neuroeng Rehabil. 2012;9:15. - PMC - PubMed
    1. Adjei E, Nalam V, Lee H. Sex Differences in Human Ankle Stiffness During Standing Balance. Front Sports Act Living. 2020;2:570449. - PMC - PubMed
    1. Lee H, Ho P, Rastgaar M, Krebs HI, Hogan N. Multivariable Static Ankle Mechanical Impedance With Active Muscles. IEEE Trans Neural Syst Rehabil Eng. 2014;22:44–52. - PubMed

Publication types

LinkOut - more resources