. 2024 Jan 4;32(1):47-59.e7.
doi: 10.1016/j.str.2023.10.010. Epub 2023 Nov 20.

Dissecting the molecular basis for the modulation of neurotransmitter GPCR signaling by GINIP

Affiliations

Dissecting the molecular basis for the modulation of neurotransmitter GPCR signaling by GINIP

Alex Luebbers et al. Structure. .

Abstract

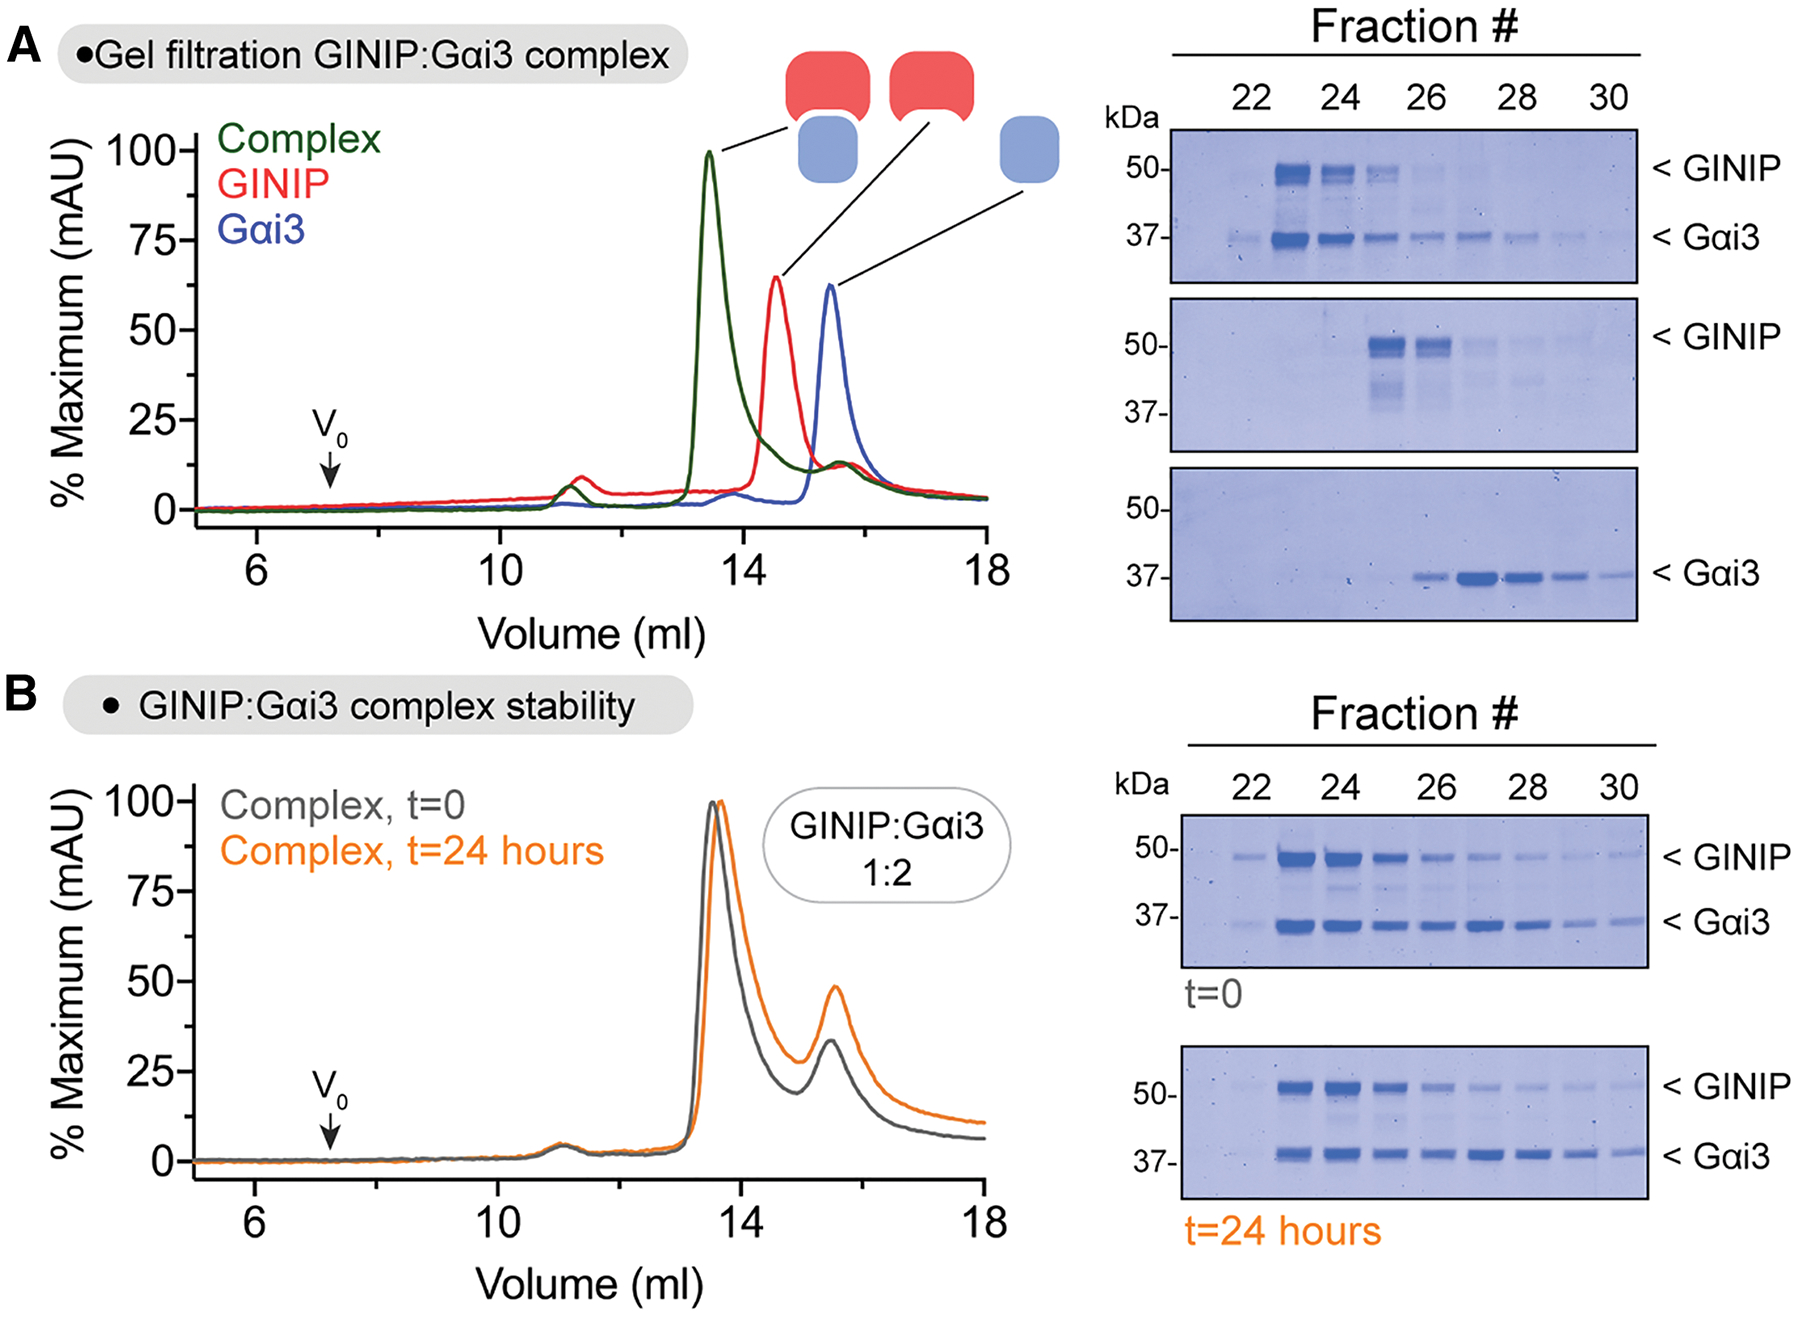
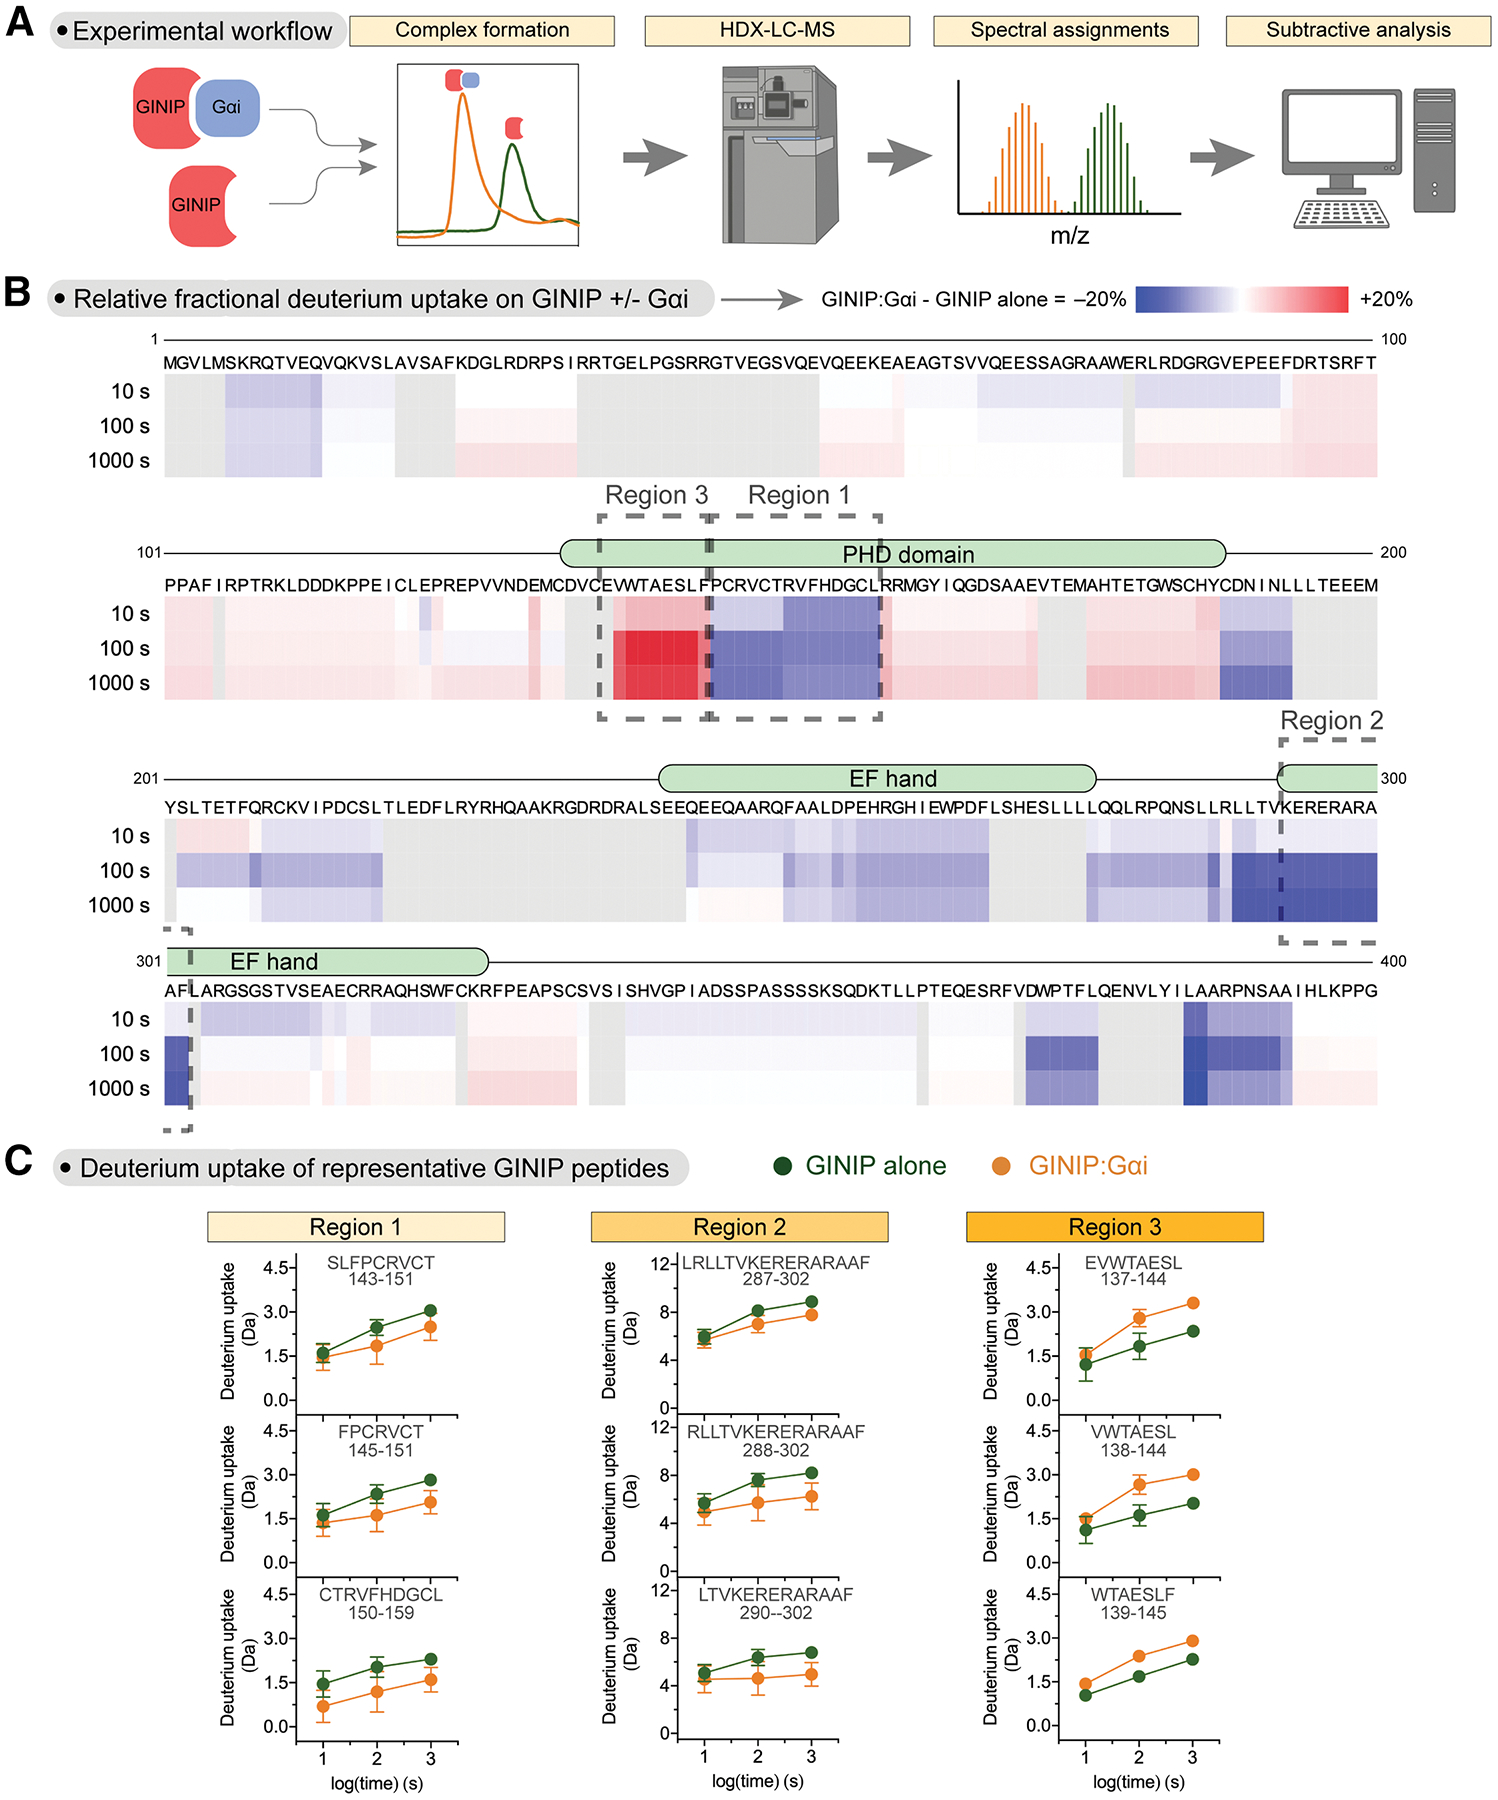
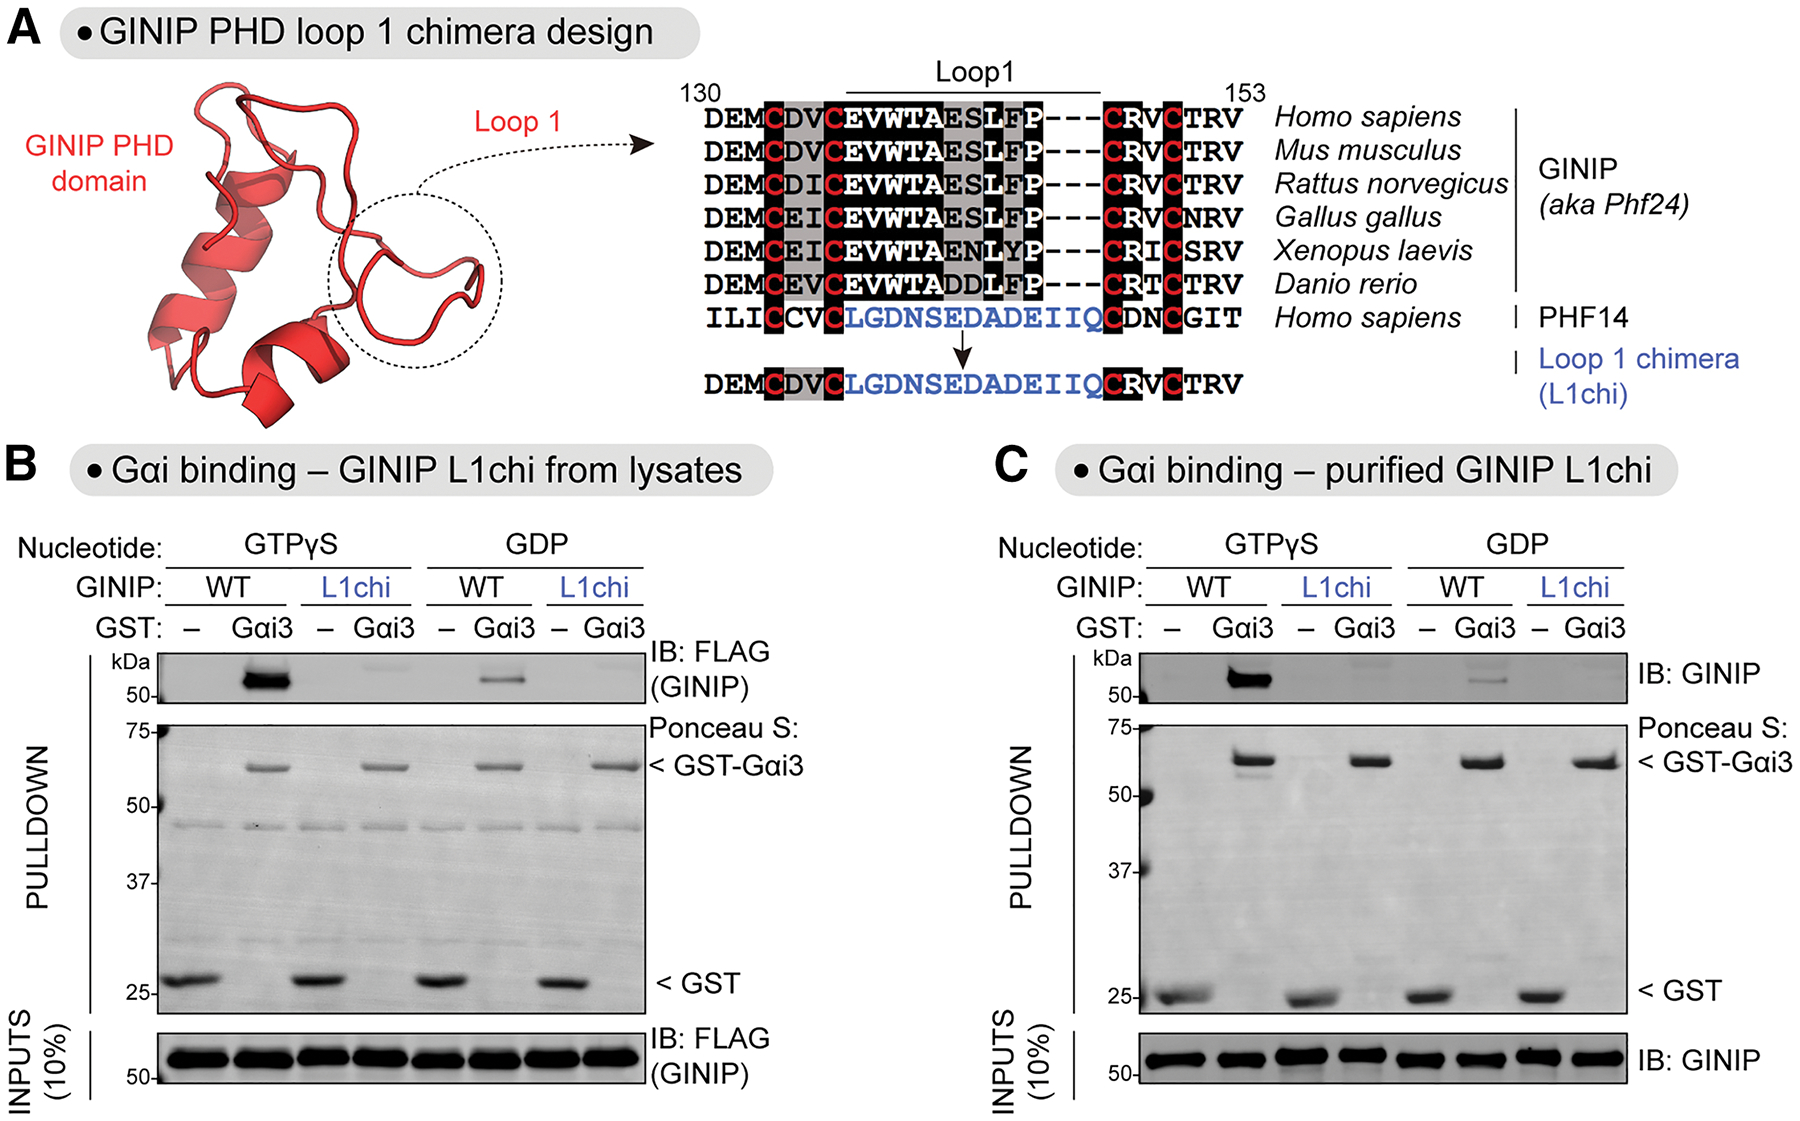
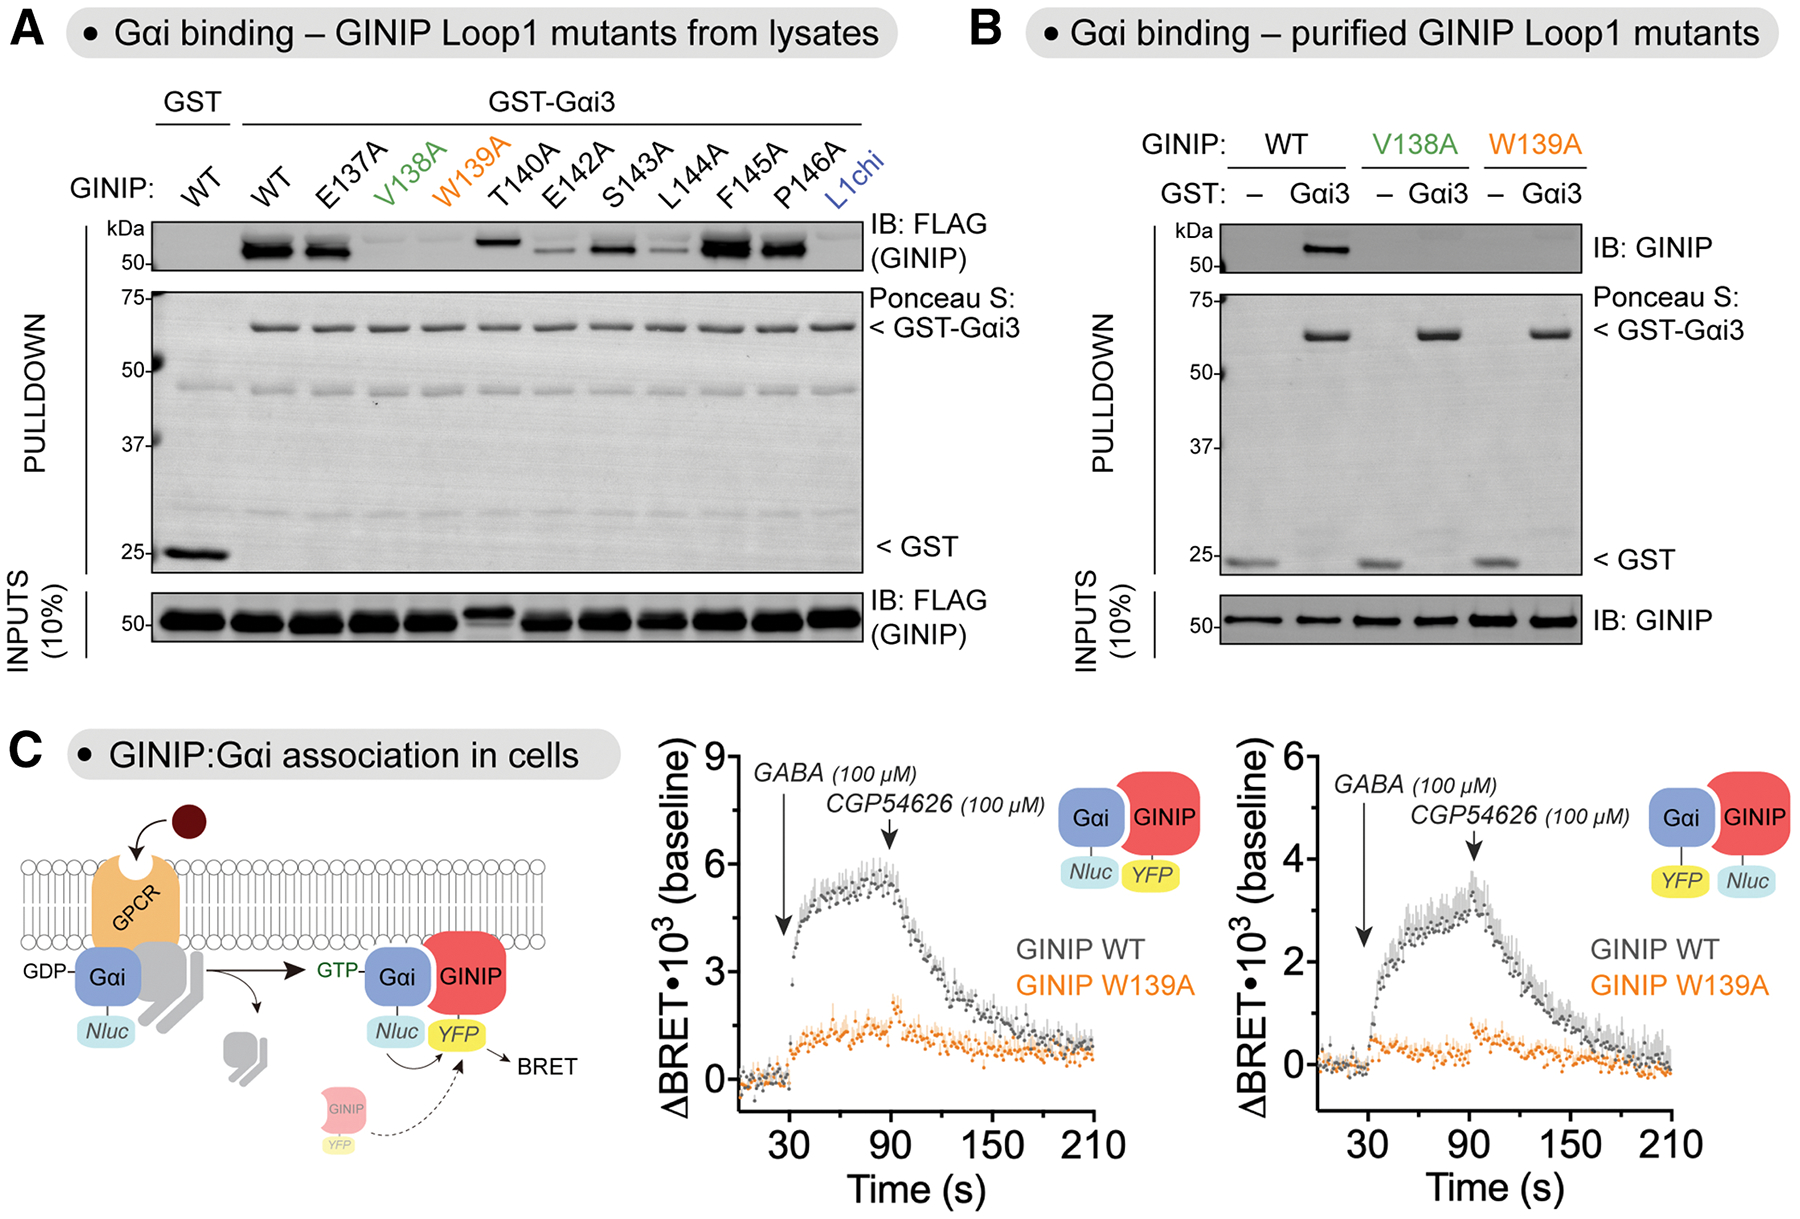
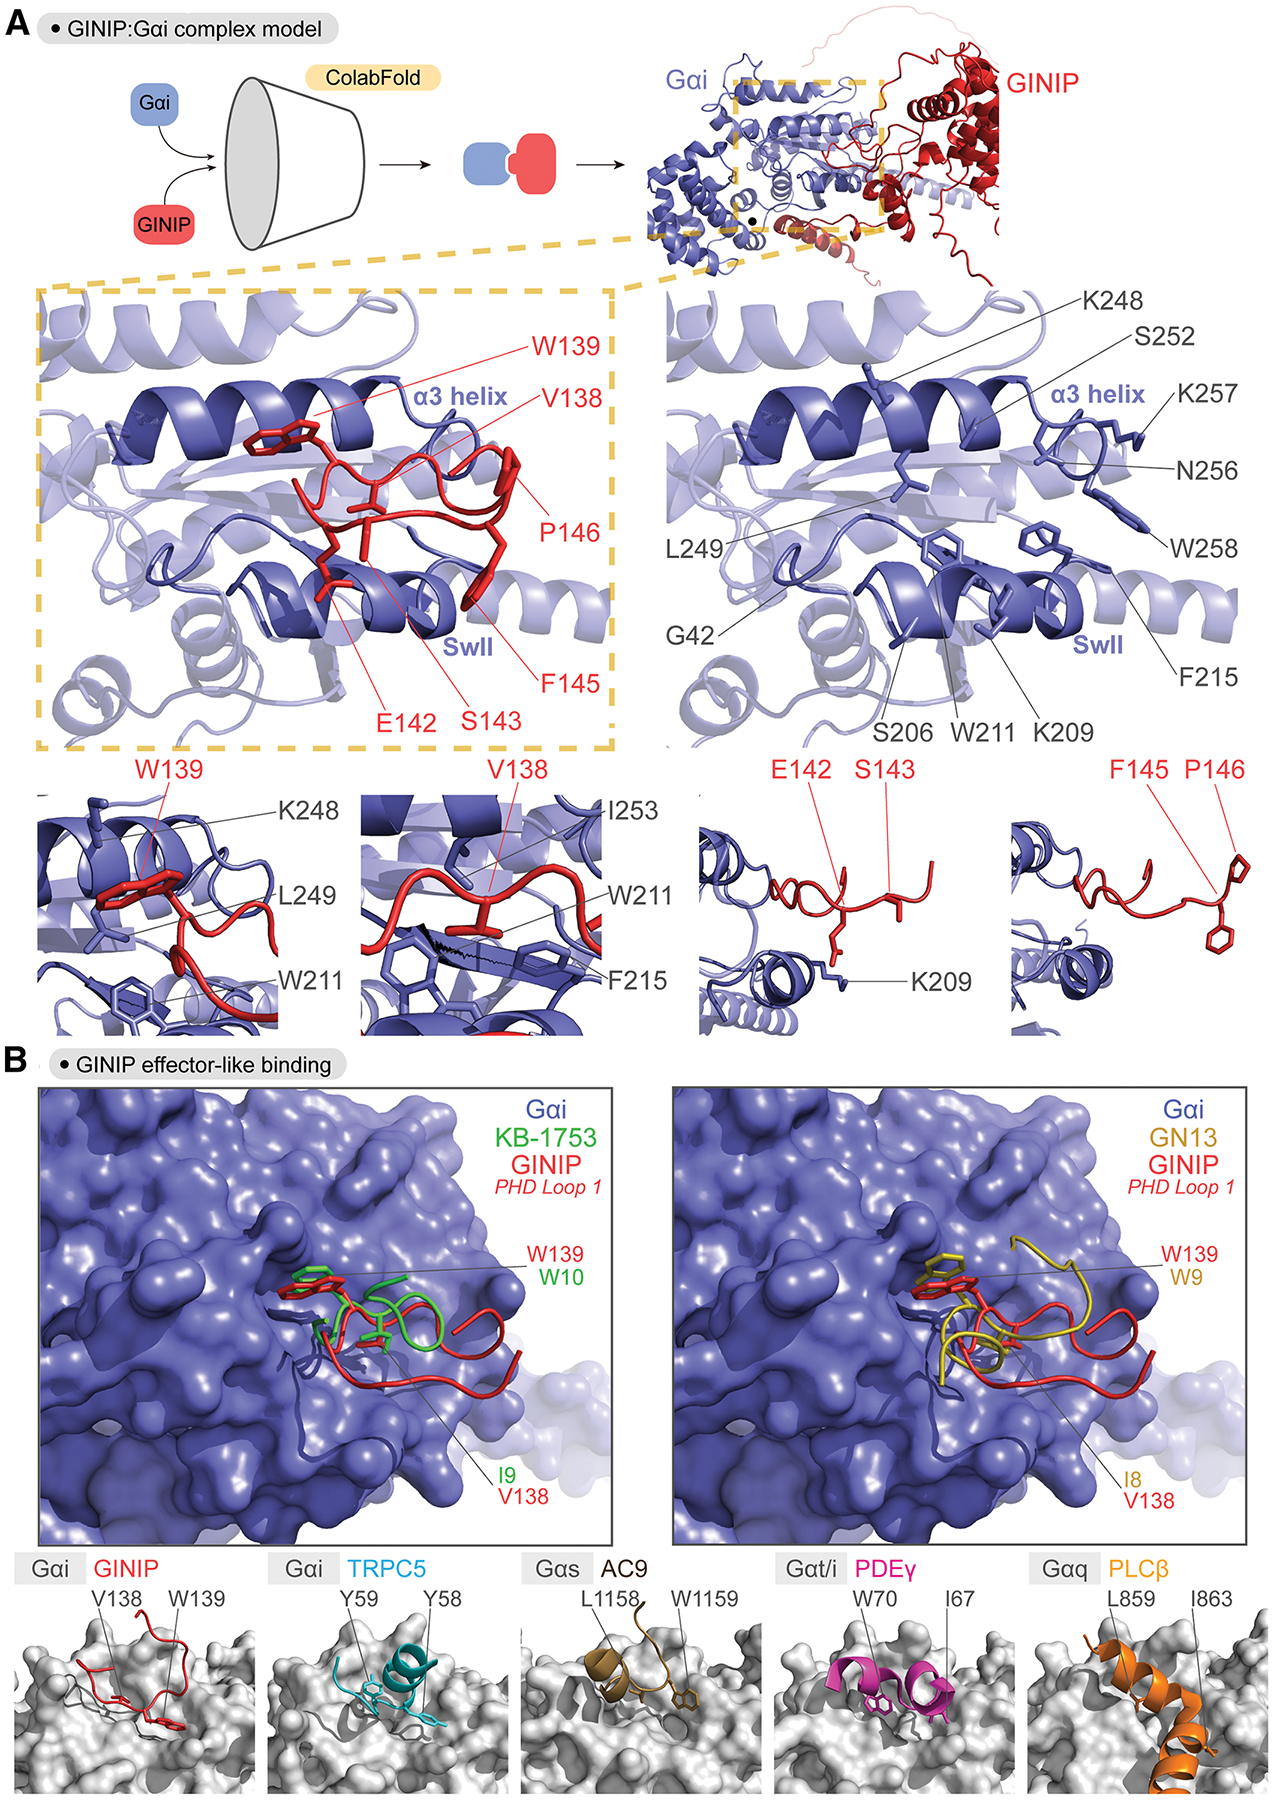
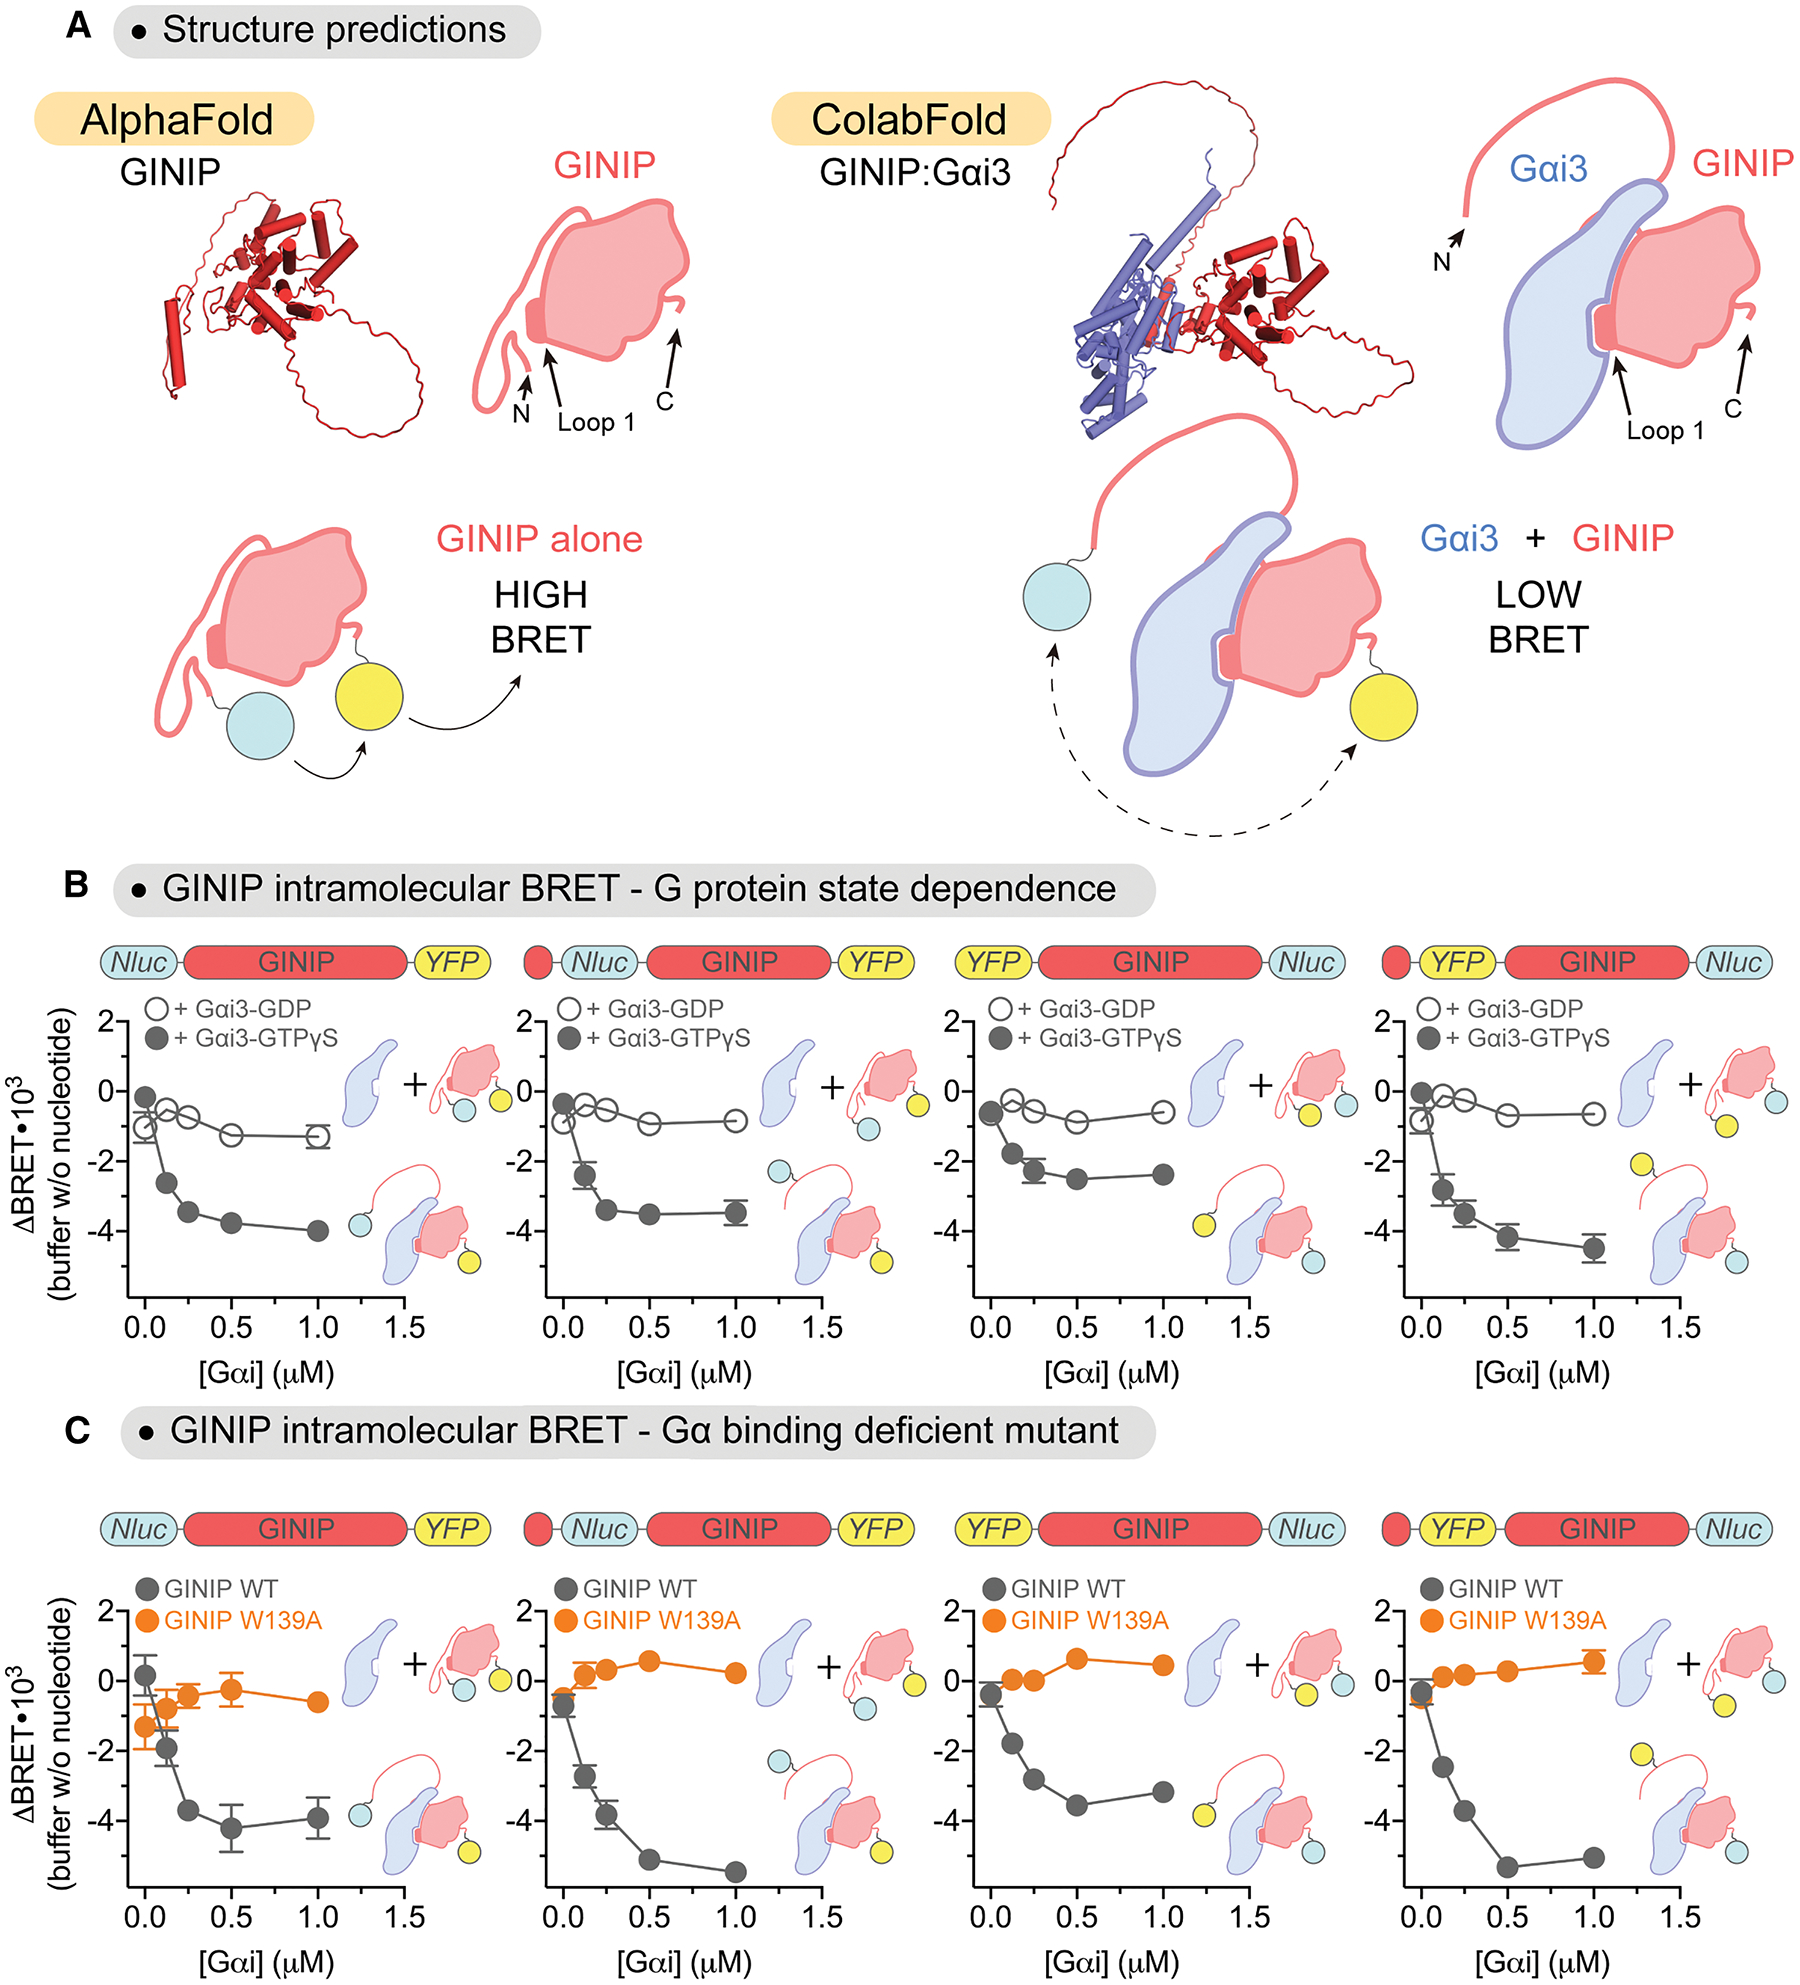
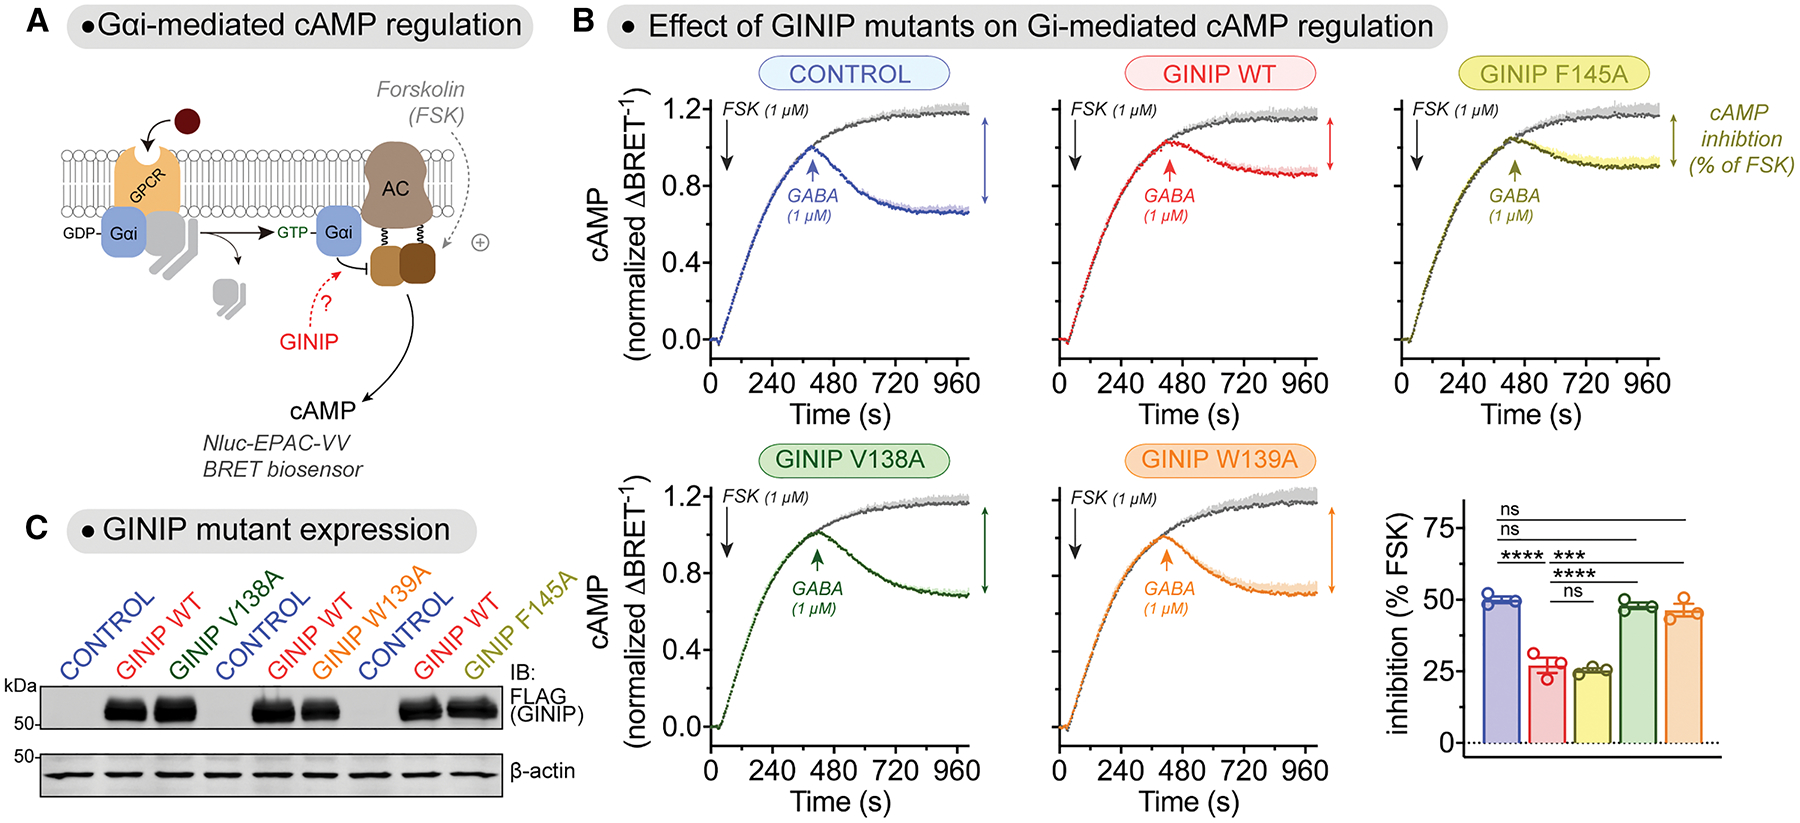
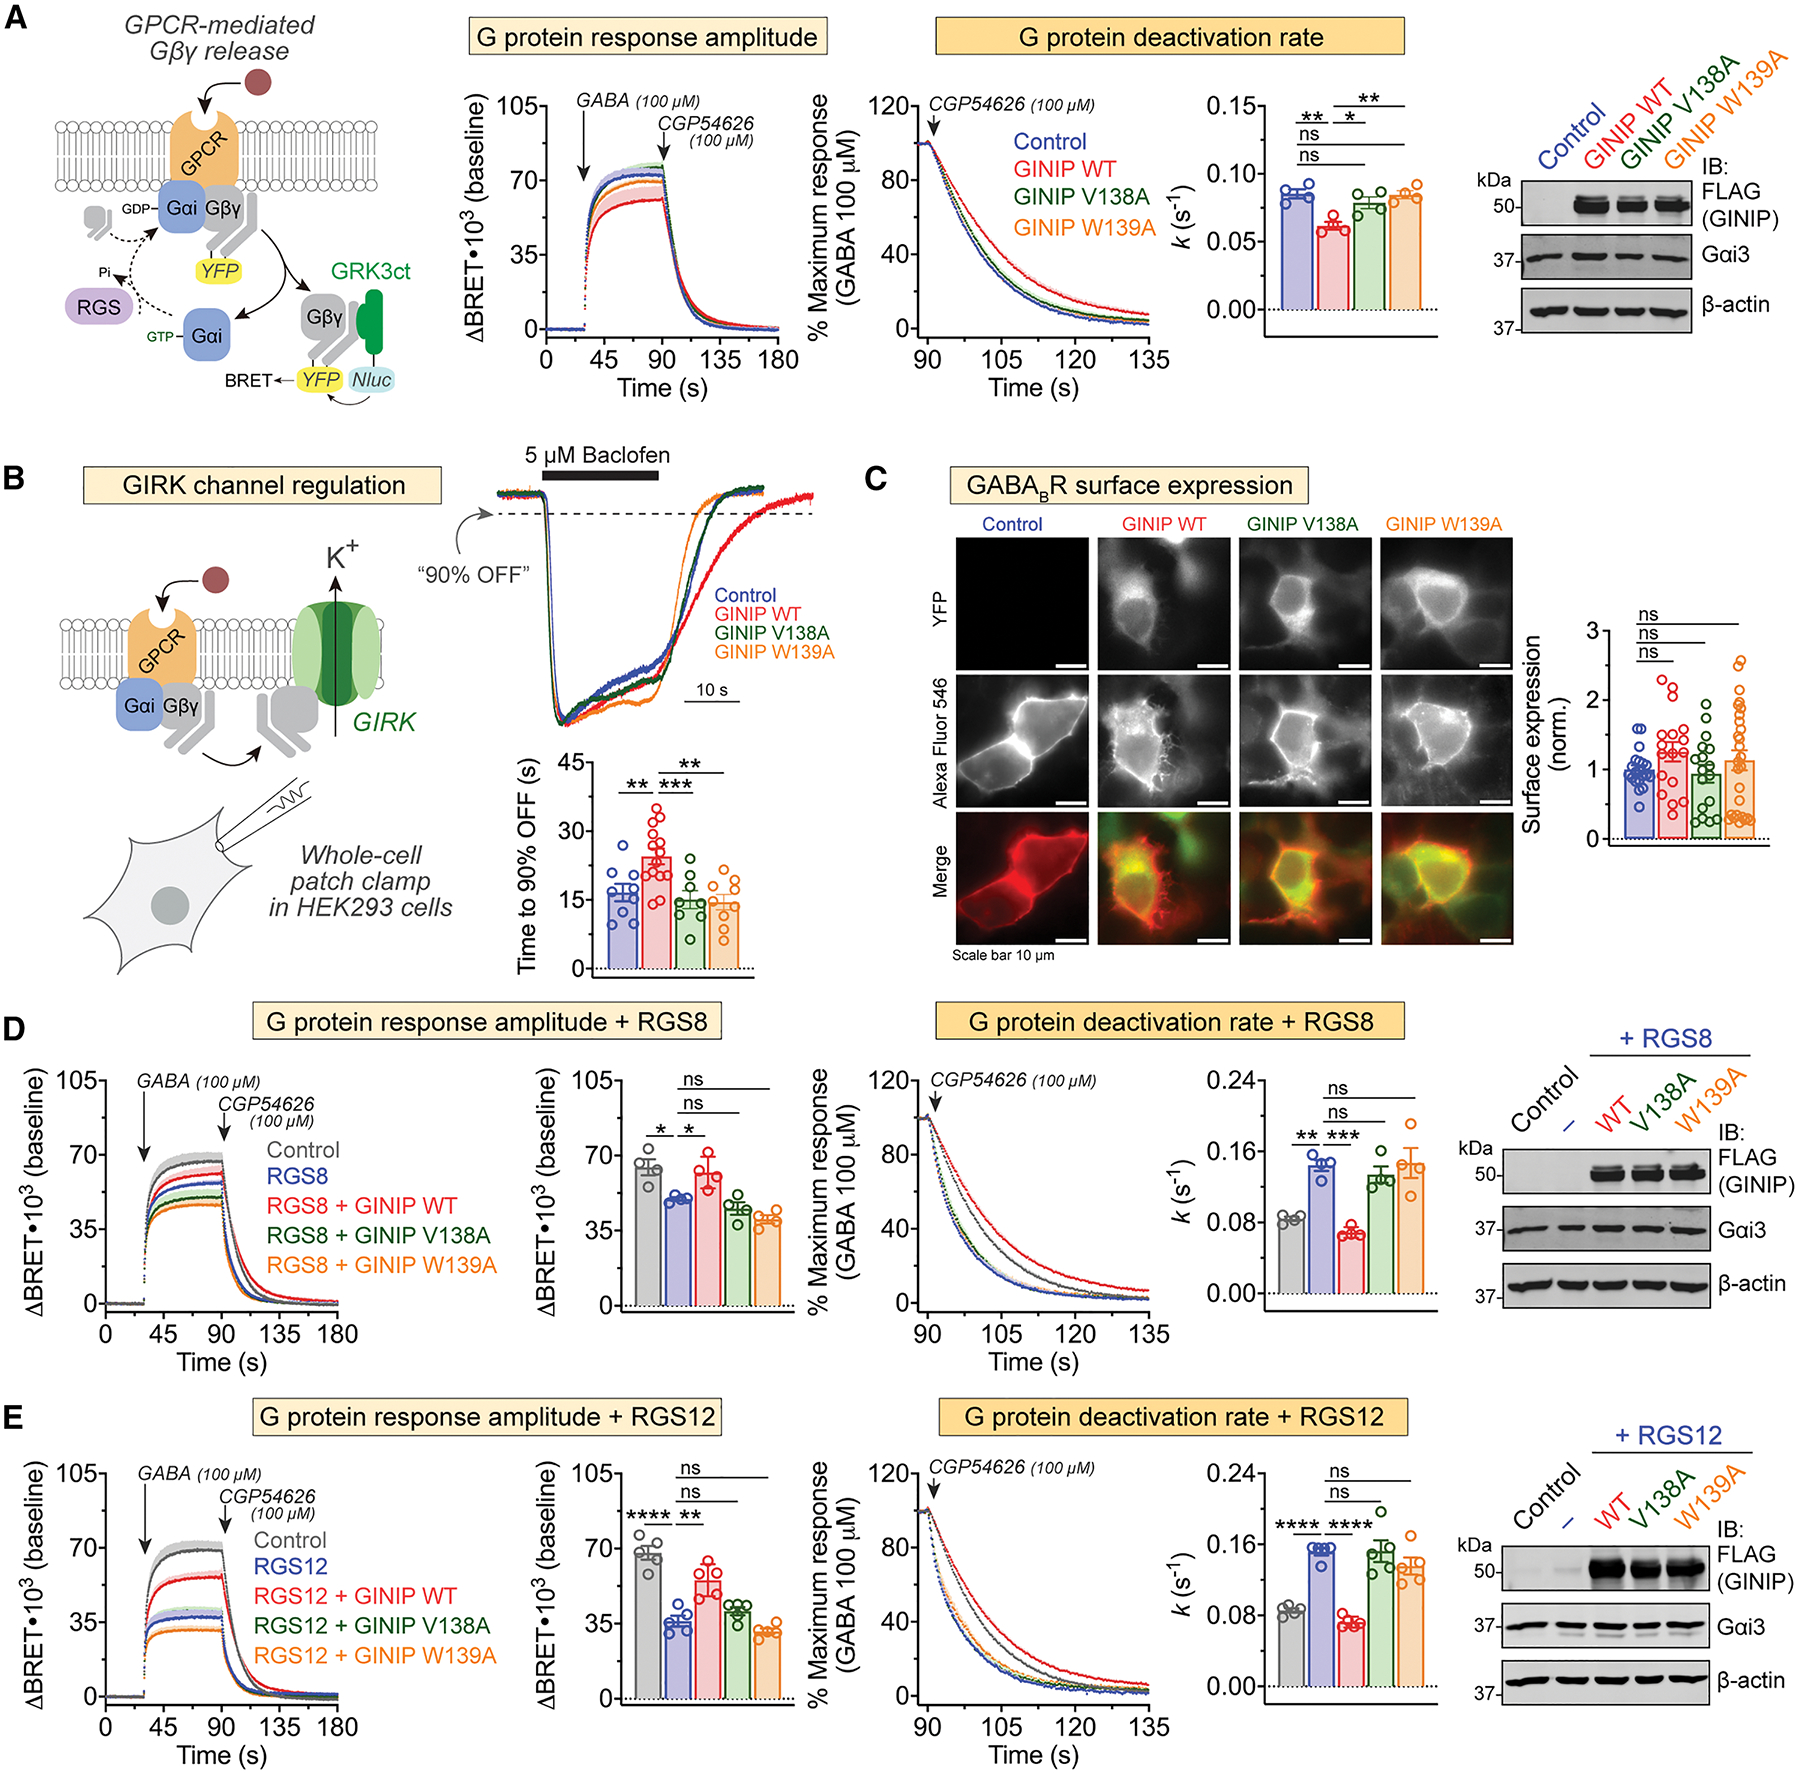
It is well established that G-protein-coupled receptors (GPCRs) stimulated by neurotransmitters are critical for neuromodulation. Much less is known about how heterotrimeric G-protein (Gαβγ) regulation after receptor-mediated activation contributes to neuromodulation. Recent evidence indicates that the neuronal protein GINIP shapes GPCR inhibitory neuromodulation via a unique mechanism of G-protein regulation that controls pain and seizure susceptibility. However, the molecular basis of this mechanism remains ill-defined because the structural determinants of GINIP responsible for binding and regulating G proteins are not known. Here, we combined hydrogen-deuterium exchange mass spectrometry, computational structure predictions, biochemistry, and cell-based biophysical assays to demonstrate an effector-like binding mode of GINIP to Gαi. Specific amino acids of GINIP's PHD domain first loop are essential for G-protein binding and subsequent regulation of Gαi-GTP and Gβγ signaling upon neurotransmitter GPCR stimulation. In summary, these findings shed light onto the molecular basis for a post-receptor mechanism of G-protein regulation that fine-tunes inhibitory neuromodulation.

Keywords: GABA; GAP; GINIP; GPCR; GTPase; KIAA1045; Neuron; Neurotransmitter; PHF24; RGS protein.


Conflict of interest statement

Declaration of interests The authors declare no competing interests.

Figures

Figure 1.
Figure 1.. GINIP forms a stable equimolar complex with Gαi3.
(A) Elution profiles of GINIP and Gαi3 alone or after forming a complex. Left, overlay of gel filtration chromatography curves for GINIP:Gαi3-GTPγS (green), GINIP (red), and Gαi3-GTPγS (blue) run on an Superdex S200 column. Right, Coomassie-stained gels showing selected fractions from the gel filtration chromatography. (B) The GINIP:Gαi3 complex is stable for >24 hours at 4 °C. Left, overlay of gel filtration chromatography curves for a GINIP:Gαi3-GTPγS complex formed by mixed the individual species in a 1:2 molar ratio for 15 minutes (t=0, grey) or for 24 hours (t=24 hours, orange) before application to a Superdex S200 column. Right, Coomassie-stained gels showing selected fractions from the gel filtration chromatography. Representative gel images from 2 independent experiments are shown.
Figure 2.
Figure 2.. HDX-MS reveals altered protein dynamics in distinct regions of GINIP upon binding Gαi.
(A) Schematic of HDX-MS workflow. Concentrated protein samples of GINIP alone or in complex with Gαi3 were subjected to hydrogen deuterium exchange (HDX) for different times before in-line digestion of peptides that were analyzed by LC-MS to calculate the uptake of deuterium per peptide. (B) Gαi3 induces both increases and decreases in deuterium uptake across different regions of GINIP. Stacked heat map of the difference in relative fractional uptake of deuterium by GINIP peptides from the GINIP:Gαi complex relative to GINIP alone at different times (10 s, 100 s, 1000 s), where blue is a decrease in deuterium uptake and red is an increase. White means no difference and grey indicates regions without peptide coverage. Data are the mean differential uptake of quadruplicate from one experiment out of two with similar results. Boxes indicate the regions with the largest decrease in deuterium uptake (Regions 1 and 2) or the largest increase in deuterium uptake (Region 3). (C) Deuterium uptake for GINIP alone or GINIP:Gαi3 at different time points for representative peptides of each one of the three GINIP regions boxed in (B). Deuterium uptake was plotted versus exposure time for three representative peptides of each Region (1–3). Mean ± SD of 4 replicates per time point. p-values are for two-way ANOVA for GINIP alone/GINIP:Gαi x time.
Figure 3.
Figure 3.. Loop 1 of the PHD domain of GINIP is required for binding Gαi.
(A) Design of a GINIP chimeric protein construct replacing first loop of the PHD domain of GINIP (Loop 1) with Loop 1 of the PHD domain of PHF14. Left, AlphaFold 2.0 structure of the PHD domain of GINIP (Uniprot #Q9UPV7). Right, alignment of sequences corresponding to the Loop 1 of GINIP from different species and the Loop 1 of human PHF14 (in blue). Background shading of the alignment was black or grey if the residue was identical or similar, respectively, in ≥50% of the sequences. Red letters highlight PHD domain conserved cysteine residues at the boundaries of Loop 1. (B) GINIP L1chi does not bind to Gαi3-GTPγS. Lysates of HEK293T cells expressing GINIP WT or GINIP L1chi were incubated with GST or GST-Gαi3 immobilized on glutathione-agarose beads in the presence of GDP or GTPγS, as indicated. Bead-bound proteins were detected by Ponceau S staining or by immunoblotting (IB). (C) Purified GINIP L1chi does not bind to Gαi3-GTPγS. Purified His-tagged GINIP WT or GINIP L1chi were incubated with GST or GST-Gαi3 immobilized on glutathione-agarose beads in the presence of GDP or GTPγS as indicated. Bead-bound proteins were detected by Ponceau S staining or by immunoblotting (IB). All protein electrophoresis results are representative of n ≥ 3 experiments.
Figure 4.
Figure 4.. Mutation of V138 or W139 in the Loop 1 of the PDH domain of GINIP precludes binding to Gαi.
(A) Mutation of V138 or W139 in GINIP disrupts binding to Gαi. Lysates of HEK293T cells expressing the indicated GINIP mutants were incubated with GST or GST-Gαi3 immobilized on glutathione-agarose beads in the presence of GDP or GTPγS, as indicated. Bead-bound proteins were detected by Ponceau S staining or by immunoblotting (IB). (B) Purified GINIP V138A or GINIP W139A does not bind to Gαi3-GTPγS. Purified His-tagged GINIP WT, V138A, or W139A were incubated with GST or GST-Gαi3 immobilized on glutathione-agarose beads in the presence of GDP or GTPγS, as indicated. Bead-bound proteins were detected by Ponceau S staining or by immunoblotting (IB). (C) GINIP W139A does not associate with Gαi3-GTP upon GPCR stimulation in cells. Left, diagram of GPCR-mediated activation of Gαi and BRET-based detection of association between donor/acceptor tagged GINIP/Gαi. Center, BRET was measured in HEK293T cells expressing the GABABR, Gαi3-Nluc, and GINIP-YFP WT (grey) or GINIP-YFP W139A (orange), which were treated with GABA and CGP54626 as indicated. Results are expressed as changes in BRET (ΔBRET) relative to the unstimulated baseline. Mean ± S.E.M., n=4. Right, same as in Center, but with Gαi3 and GINIP constructs in which the BRET donor and acceptor proteins were swapped. Mean ± S.E.M., n=4. All protein electrophoresis results are representative of n ≥ 3 experiments.
Figure 5.
Figure 5.. Effector-like binding mode of GINIP Loop 1 on active Gαi
(A) Predicted binding pose of Loop 1 of the PHD domain of GINIP onto the α3/SwII groove of Gαi. Top, protein folding model for the complex of GINIP (red) bound to Gαi (blue) was generated using ColabFold. Middle, images depicting the α3/SwII groove of Gαi (blue) and GINIP Loop 1 (red) displaying select side chains. Bottom, close-up views of regions surrounding the indicated GINIP amino acid side chains. (B) Comparison of the GINIP:Gαi ColabFold model with structures of Gα subunits in complex with other partners suggests an effector-like binding mode for GINIP. Left, Overlay of GINIP’s PHD Loop 1 (red) bound to Gαi (blue) with the Gαi-GTP effector-like peptide KB-1753 (green). Right, Overlay of GINIP’s PHD Loop 1 (red) bound to Gαi (blue) with the Gαs-GTP effector-like peptide GN13 (gold). Bottom row, Structural models of GINIP:Gαi1 (red, Colabfold model), TRPC5:Gαi3 (cyan, PDB ID: 7X6I), AC9:Gαs (brown, PDB ID: 7PDE), PDEγ:Gαt/i (pink, PDB ID: 1FQJ), and PLCβ:Gαq (orange, PDB ID: 7SQ2) show conserved positions and orientation of key hydrophobic residues in effector or effector-like partners that mediate G protein binding. Gα subunits are colored grey.
Figure 6.
Figure 6.. Gαi induces a long-range conformational rearrangement in GINIP.
(A) Top, comparison of structural models of GINIP (red) alone and or in complex with Gαi (blue) suggests displacement of GINIP’s N-termimus from the vicinity of the Loop 1 of the PHD domain upon Gαi binding. Bottom, representative schematic of GINIP intramolecular BRET reporter constructs. Tagging GINIP with both a BRET donor (Nluc, cyan circle) and BRET acceptor (YFP, yellow circle) at the N- and C-terminus could report on G protein-induced long range conformational changes. (B) Gαi3-GTPγS induces a dose-dependent decrease in intramolecular BRET for a series of GINIP constructs. Increasing concentrations of purified His-tagged Gαi3 pre-loaded with GDP (open circles) or GTPγS (closed circles) were added to lysates of HEK293T cells expressing the following GINIP intramolecular reporter constructs: Nluc-GINIP-YFP, Nluc(31)-GINIP-YFP, YFP-GINIP-Nluc, and YFP(31)-GINIP-Nluc (represented as bar diagrams above graphs). Mean ± S.E.M., n=3–4. (C) Gαi-GTPγS does not induce changes in intramolecular BRET for GINIP constructs bearing the W139A mutation. Increasing concentrations of purified His-tagged Gαi3 pre-loaded with GTPγS were added to lysates of HEK293T cells expressing the same GINIP constructs as in (B), either as WT proteins (gray) or bearing the W139A mutation (orange). Mean ± S.E.M., n=3.
Figure 7.
Figure 7.. GINIP V138A and GINIP W139A mutants fail to regulate cAMP cellular levels upon GPCR stimulation.
(A) Diagram of GPCR-mediated activation of Gαi-GTP and subsequent regulation of cAMP levels in cells monitored by BRET. (B) Mutation of GINIP V138 or W139, but not F145, prevents the blockade of cAMP inhibition upon stimulation of GABABR observed with GINIP WT. Kinetic BRET measurements of cAMP levels were carried out in HEK293T cells expressing the GABABR without GINIP (blue) or expressing GINIP WT (red), GINIP F145A (yellow), GINIP V138A (green), or GINIP W139A (orange). Cells were treated with forskolin (FSK) and GABA as indicated. Quantification of the inhibition of FSK-stimulated cAMP upon stimulation of GABABR with GABA is shown in the bar graph on the bottom left corner. Mean ± S.E.M., n=3. ns = not significant, ***p<0.001, ****p<0.0001, one-way ANOVA corrected for multiple comparisons (Tukey). (C) Representative immunoblotting (IB) result confirming equal expression of GINIP WT, GINIP V138A, GINIP W139A, and GINIP F145A in the cells used for the experiments shown in (B).
Figure 8.
Figure 8.. GINIP V138A and GINIP W139A mutants fail to regulate Gβγ responses in cells upon GPCR stimulation.
(A) Mutation of GINIP V138 or W139 prevents the enhancement of Gβγ signaling upon stimulation of GABABR observed with GINIP WT. Left, diagram of G protein activation/deactivation cycle and BRET-based detection of free Gβγ. Center, kinetic BRET measurements were carried out in HEK293T cells expressing the GABABR without GINIP (blue), or expressing GINIP WT (red), GINIP V138A (green), or GINIP W139A (orange). Cells were treated with GABA and CGP54626 as indicated. Right, G protein deactivation rates were determined by normalizing the BRET data to maximum response and fitting the post-antagonist data to an exponential decay curve to extract rate constant values (k). Mean ± S.E.M., n=4. ns = not significant, **p<0.01, one-way ANOVA corrected for multiple comparisons (Tukey). A representative immunoblotting (IB) result confirming equal expression of GINIP WT or mutants, and Gαi3 in these experiments is shown on the right. (B) GINIP WT, but not GINIP V138 or W139, prolongs the duration of Gβγ-induced GIRK channel activity. Whole-cell patch clamp measurements were carried out in HEK293 cells expressing GIRK1 and GABABR without GINIP (blue), or expressing GINIP WT (red), GINIP V138A (green), or GINIP W139A (orange). Cells were perfused with baclofen as for the time indicate by the black horizontal line, followed by washout with buffer. Top, representative, single-cell current traces for each condition. Bottom, quantification of time required for currents to recover to 90% of the peak response after agonist washout. Mean ± S.E.M. of 8–15 cells from three independent experiments. **p<0.01, ***p<0.001, compared with GINIP WT using one-way ANOVA with Dunnett’s multiple comparisons correction. (C) GINIP WT, GINIP V138 or GINIP W139 does not affect surface expression levels of GABABR. HEK293 cells GABAB1, SNAP-tagged GABAB2, and YFP-tagged GINIP constructs, as indicated, were incubated with a cell impermeable SNAP substrate labeled with AlexaFluor 546, followed by imaging. Left, representative images, scale bars are 10 μM. Right, quantification of fluorescence intensity in 18–24 fields from at least three independent experiments. ns = not significant compared with Control using one-way ANOVA with Dunnett’s multiple comparison correction. (D) Mutation of GINIP V138 or W139 prevents the RGS8-mediated regulation of Gβγ signaling upon stimulation of GABABR observed with GINIP WT. BRET experiments were carried out and analyzed as in (A) with cells expressing RGS8 alone (blue), or RGS plus GINIP WT (red), GINIP V138A (green), or GINIP W139A (orange), or neither RGS8 nor GINIP (grey). Quantification of G protein response amplitude was determined 1 minute after agonist stimulation. Mean ± S.E.M., n=4. ns = not significant, *p<0.05, **p<0.01, ***p<0.001, one-way ANOVA corrected for multiple comparisons (Tukey). A representative immunoblotting (IB) result confirming equal expression of GINIP WT or mutants, and Gαi3 in these experiments is shown on the right. (E) Mutation of GINIP V138 or W139 prevents the RGS12-mediated regulation of Gβγ signaling upon stimulation of GABABR observed with GINIP WT. BRET experiments were carried out and analyzed as in (A) with cells expressing RGS12 alone (blue), or RGS plus GINIP WT (red), GINIP V138A (green), or GINIP W139A (orange), or neither RGS12 nor GINIP (grey). Quantification of G protein response amplitude was determined 1 minute after agonist stimulation. Mean ± S.E.M., n=5. ns = not significant, **p<0.01, ****p<0.0001, one-way ANOVA corrected for multiple comparisons (Tukey). A representative immunoblotting (IB) result confirming equal expression of GINIP WT or mutants, and Gαi3 in these experiments is shown on the right.

Update of

References

    1. Roth BL (2019). Molecular pharmacology of metabotropic receptors targeted by neuropsychiatric drugs. Nature structural & molecular biology 26, 535–544. 10.1038/s41594-019-0252-8. - DOI - PMC - PubMed
    1. Weis WI, and Kobilka BK (2018). The Molecular Basis of G Protein-Coupled Receptor Activation. Annual review of biochemistry 87, 897–919. 10.1146/annurev-biochem-060614-033910. - DOI - PMC - PubMed
    1. Greengard P (2001). The neurobiology of slow synaptic transmission. Science 294, 1024–1030.10.1126/science.294.5544.1024. - DOI - PubMed
    1. Zurawski Z, Yim YY, Alford S, and Hamm HE (2019). The expanding roles and mechanisms of G protein-mediated presynaptic inhibition. The Journal of biological chemistry 294, 1661–1670. 10.1074/jbc.TM118.004163. - DOI - PMC - PubMed
    1. Hauser AS, Attwood MM, Rask-Andersen M, Schiöth HB, and Gloriam DE (2017). Trends in GPCR drug discovery: new agents, targets and indications. Nature reviews. Drug discovery 16, 829–842. 10.1038/nrd.2017.178. - DOI - PMC - PubMed

MeSH terms

Substances

LinkOut - more resources