. 2023 Nov 21;14(1):7259.
doi: 10.1038/s41467-023-42637-0.

Potential drivers of the recent large Antarctic ozone holes

Affiliations

Potential drivers of the recent large Antarctic ozone holes

Hannah E Kessenich et al. Nat Commun. .

Abstract

The past three years (2020-2022) have witnessed the re-emergence of large, long-lived ozone holes over Antarctica. Understanding ozone variability remains of high importance due to the major role Antarctic stratospheric ozone plays in climate variability across the Southern Hemisphere. Climate change has already incited new sources of ozone depletion, and the atmospheric abundance of several chlorofluorocarbons has recently been on the rise. In this work, we take a comprehensive look at the monthly and daily ozone changes at different altitudes and latitudes within the Antarctic ozone hole. Following indications of early-spring recovery, the October middle stratosphere is dominated by continued, significant ozone reduction since 2004, amounting to 26% loss in the core of the ozone hole. We link the declines in mid-spring Antarctic ozone to dynamical changes in mesospheric descent within the polar vortex, highlighting the importance of continued monitoring of the state of the ozone layer.


Conflict of interest statement

The authors declare no competing interests.

Figures

Fig. 1
Fig. 1. Total column ozone (TCO) and ozone hole onset and breakup dates from TOMS/OMI observations.
a Zonal mean TCO in Dobson units (DU) across latitudes 60S to 90S shown for the months of Sept., Oct., and Nov. for years 1979–2022 (2002 and 2019 excluded). Error bars for OMI represent the standard deviation of the daily mean TCO measurements (2005–2022). The lines present a linear fit from 2001–2022, with the fit equation shown in the legend. The linear fit uncertainty is quoted at the 95% confidence interval and T = Years since 2001. b Deep ozone hole onset and breakup dates (130 DU, 1 million km2) for years 2005–2022. Missing years do not surpass the TCO/area threshold during the season. The lines present a linear fit from 2005–2022, with the fit equation shown in the legend. The linear fit uncertainty is quoted at the 95% confidence interval and T = Years since 2005.
Fig. 2
Fig. 2. Change in zonal mean MLS/Aura ozone observations for the period of 2004–2022.
Results are presented across latitudes 45S–82S and pressure levels 0.68–215 hPa (approximate altitudes in km given on the right) for the months of a September, b October, and c November. The coloured contours (ppmv/year, contour level intervals are 0.01 ppmv/year) represent the slope of a linear fit across the range of years. All volume mixing ratio changes that are significantly different from zero (at ≥95% level) are indicated with black hatching.
Fig. 3
Fig. 3. Change in daily, zonally averaged MLS/Aura polar (75S–82S) ozone concentration (VMR), from Aug. 21st to Nov. 30th.
Black vertical lines indicate separation between months. A simple linear fit across the range of years (2004–2022) is found, with contour colours representing the slopes (ppmv/year). Changes that are significantly different from zero (at ≥95% level) are indicated with black hatching.
Fig. 4
Fig. 4. October partial column ozone (PCO) over four altitude and latitude ranges of interest derived from MLS observations for 2004–2022.
Red line: PCO for the pressure levels of 5-50 hPa and averaged from 60S to 82S; Pink line: As red line, but now averaged from 75S to 82S; Dark blue line: PCO calculated for pressure levels 1–5 hPa and averaged from 60 S to 82 S; Light blue line: As dark blue line, but now averaged from 45S to 60S. The results from linear fits are shown in the legend, with errors quoted at 95% confidence interval. Here, T = years since 2004, and the percent change in PCO since 2004 is given after the Δ-symbol.
Fig. 5
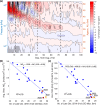
Fig. 5. Indicators of links between ozone and changes in carbon monoxide (CO) and nitrogen dioxide (NO2).
a Change in daily, zonally averaged MLS/Aura polar (75S–82S) CO concentration (VMR), from Aug. 21st to Nov. 30th. Black vertical lines indicate separation between months. A simple linear fit across the range of years (2004–2022) is found, with contour colours representing the slopes (ppbv/year). Changes that are significantly different from zero (at ≥95% level) are indicated with black hatching. b October mean stratospheric NO2 vs. altitude of late-October CO maximum for 2005–2022 and c October partial column ozone (PCO) (from 5 to 50 hPa and 60S–82S) vs. altitude of late-October CO maximum for 2004–2022. The results from a linear fit for b, c are shown in the legends, with error quoted at 95% confidence interval and Alt = altitude of late Oct. CO maximum.

References

    1. World Meteorological Organization. Scientific Assessment of Ozone Depletion: 2022. GAW Report 278, (WMO, Geneva, 2022).
    1. Anderson J, Russell III JM, Solomon S, Deaver LE. Halogen Occultation Experiment confirmation of stratospheric chlorine decreases in accordance with the Montreal Protocol. J. Geophys. Res.: Atmosph. 2000;105:4483–4490. doi: 10.1029/1999JD901075. - DOI
    1. Solomon, P. et al. Rise and decline of active chlorine in the stratosphere. Geophys. Res. Lett.33 (18) 10.1029/2006GL027029 (2006).
    1. Chubachi, S. A Special Ozone Observation at Syowa Station, Antarctica from February 1982 to January 1983. In: Zerefos, C.S., Ghazi, A. (eds.) Atmospheric Ozone, pp. 285–289. Springer, Dordrecht 10.1007/978-94-009-5313-0_58 (1985).
    1. Farman JC, Gardiner BG, Shanklin JD. Large losses of total ozone in Antarctica reveal seasonal ClOx/NOx interaction. Nature. 1985;315:207–210. doi: 10.1038/315207a0. - DOI