. 2023 Nov 21;14(1):7579.
doi: 10.1038/s41467-023-42926-8.

Quantification of ligand and mutation-induced bias in EGFR phosphorylation in direct response to ligand binding

Affiliations

Quantification of ligand and mutation-induced bias in EGFR phosphorylation in direct response to ligand binding

Daniel Wirth et al. Nat Commun. .

Abstract

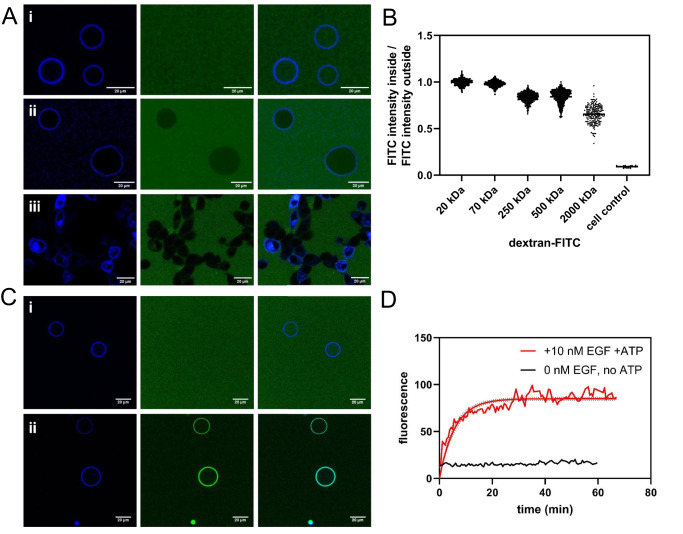
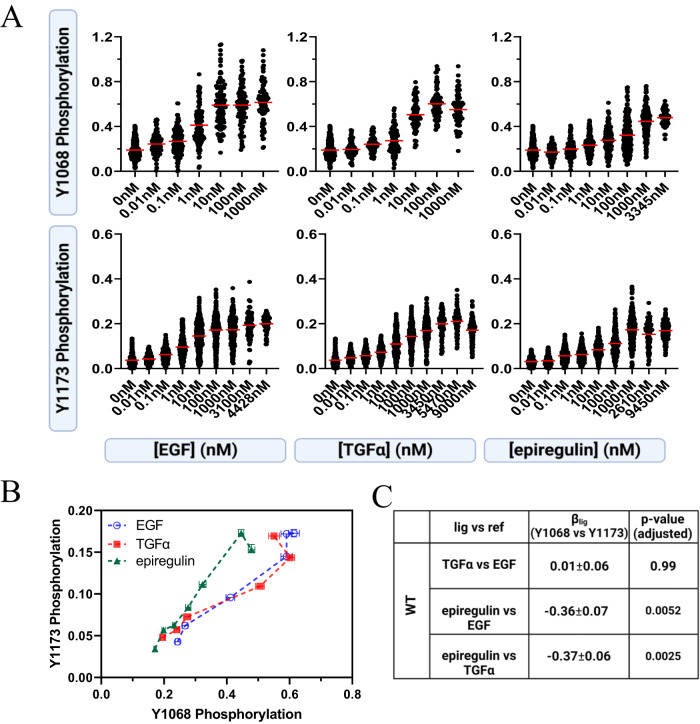
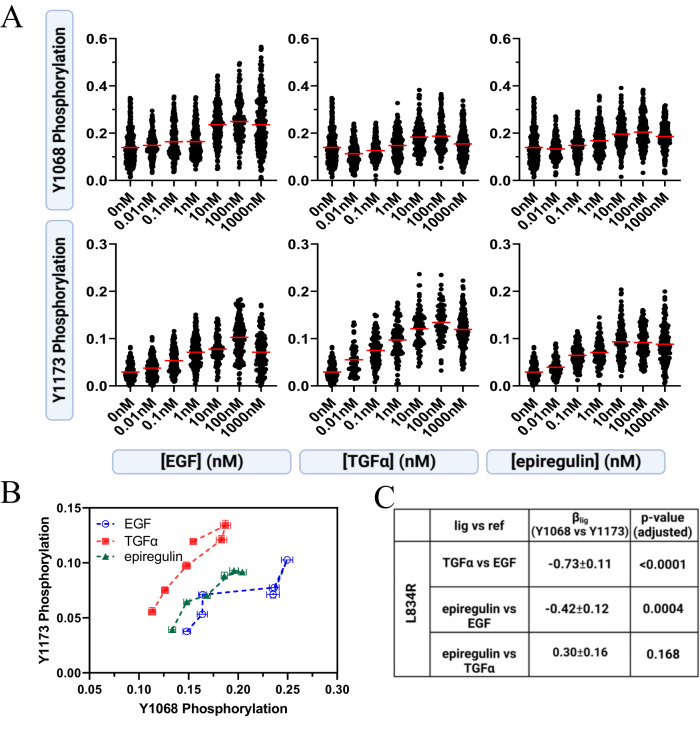
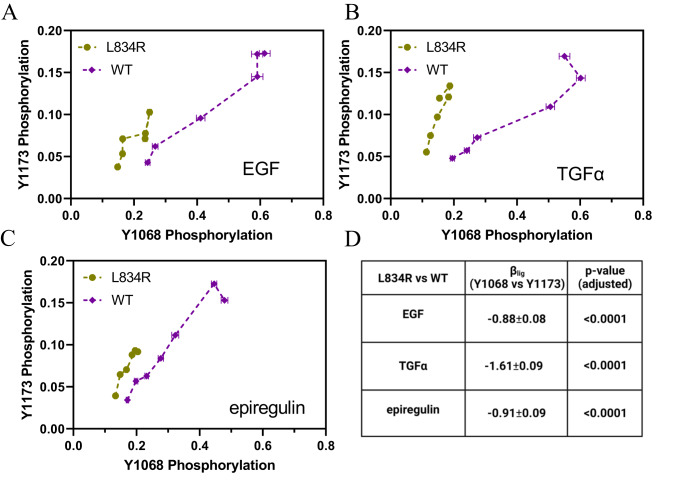
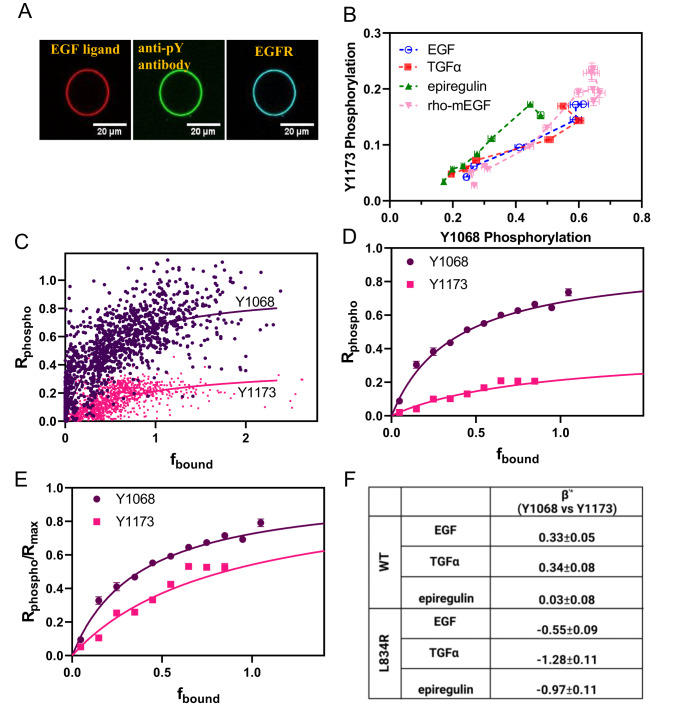
Signaling bias is the ability of a receptor to differentially activate downstream signaling pathways in response to different ligands. Bias investigations have been hindered by inconsistent results in different cellular contexts. Here we introduce a methodology to identify and quantify bias in signal transduction across the plasma membrane without contributions from feedback loops and system bias. We apply the methodology to quantify phosphorylation efficiencies and determine absolute bias coefficients. We show that the signaling of epidermal growth factor receptor (EGFR) to EGF and TGFα is biased towards Y1068 and against Y1173 phosphorylation, but has no bias for epiregulin. We further show that the L834R mutation found in non-small-cell lung cancer induces signaling bias as it switches the preferences to Y1173 phosphorylation. The knowledge gained here challenges the current understanding of EGFR signaling in health and disease and opens avenues for the exploration of biased inhibitors as anti-cancer therapies.


Conflict of interest statement

The authors declare no competing interests.

Figures

Fig. 1
Fig. 1. Plasma membrane derived vesicles as a tool to probe RTK phosphorylation in response to ligand binding.
A Determination of the size cutoff for equilibration across the vesicle membrane. FITC-labeled dextrans of different molecular weights were added to vesicles with FGFR3-mTurquoise in their membrane. Left column: receptor, middle column: dextran, right column: overlay. (i) 70 kDa dextran. The intensity inside the vesicle and outside is the same. (ii) 2000 kDa dextran. The intensity inside the vesicle is lower. Shown are representative images from 11 independent vesicle experiments. (iii) cells, EGFR-mTurquoise + control antibody (rat IgG2bκ-FITC). The antibody does not cross the cell membrane. Shown are representative images from 3 independent cell experiments. B Intensity ratios between FITC-labeled dextran inside and outside of vesicles for dextrans of different molecular weights. Each data point represents the ratio for one vesicle. Data are for 3454 vesicles in 14 independent experiments. C EGFR phosphorylation in vesicles. First column: receptor channel, middle column: antibody channel, right column: overlay. (i) Vesicles derived from CHO cells with EGFR-mTurq incorporated into the vesicle membrane were incubated with 10 μg/mL IgG-FITC isotype control antibody. (ii) Vesicles derived from CHO cells with EGFR-mTurq incorporated into the vesicle membrane were incubated with 100 nM EGF, ATP/salt cocktail, and FITC anti-pY 4G10 antibody. The antibody fluorescence can be seen on the membrane. Representative images from 3 independent experiments with the 4G10 antibody. D Phosphorylation signal on the vesicle membrane over time. The fluorescence of the antibody was measured on the membrane of a single vesicle over time in response to 10 nM EGF with added ATP cocktail (red line). The black line shows a control experiment in the absence of EGF and ATP.
Fig. 2
Fig. 2. Ligand bias for WT EGFR.
A Raw dose response curves for Y1068 and Y1173 phosphorylation per EGFR molecule, for the ligands EGF, TGFα, and epiregulin. Each point represents the ratio of either anti-pY1068 or anti-pY1173 fluorescence and EGFR-mTurq fluorescence for one individual vesicle. Each curve contains ~1000 to ~3000 data points (single vesicles). B Bias plots. Shown are means (symbols) and standard errors (often smaller than symbols). The epiregulin points diverge from the EGF and TGFα points. In total, data are from 11,570 single vesicles over 25 independent experiments. C Bias coefficients and standard errors. Epiregulin is biased toward Y1173 phosphorylation as compared to EGF and TGFα. Ordinary one-way ANOVA, followed by Tukey’s test, was used to determine statistical significance. The p values are adjusted for multiple comparisons.
Fig. 3
Fig. 3. Ligand bias in L834R EGFR phosphorylation.
A Single vesicle dose response curves for Y1068 and Y1173 phosphorylation per EGFR molecule, for EGF, TGFα, and epiregulin. Each point represents the ratio of either anti-pY1068 or anti-pY1173 fluorescence and EGFR-mTurq fluorescence for one individual vesicle. Each curve contains ~1000 to ~1800 data points. B Bias plots. Shown are means (symbols) and standard errors (often smaller than symbols). In total, data are from 8009 vesicles in 23 independent experiments. C Bias coefficients and their standard errors. Ordinary one-way ANOVA, followed by Tukey’s test, was used to determine statistical significance. The p values are adjusted for multiple comparisons.
Fig. 4
Fig. 4. L834R mutation-induced bias.
AC L834R-induced bias plots in the presence of EGF, TGFα, and epiregulin. Shown are means (symbols) and standard errors (often smaller than symbols). In total, data  are from 11,570 single vesicles over 25 independent experiments for WT and 8009 vesicles for L834R EGFR in 23 independent experiments. D Bias coefficients and their standard errors. Three pair-wise comparisons were performed using two-tailed t-tests. The p values were adjusted for multiple comparisons using the Holm-Sidak correction. The L834R mutation induces statistically significant preference for Y1173 phosphorylation over Y1068 phosphorylation, as compared to the wild-type, in the presence of all three ligands.
Fig. 5
Fig. 5. The rho-mEGF EGFR transducer function.
A One vesicle imaged in three channels at 5 nM rho-mEGF in the presence of ATP/kinase cocktail. B Bias plots for rho-mEGFR and human EGF, TGFα, and epiregulin. EGF and rho-mEGF are not biased ligands. Shown are means and standard errors. In total, data are from 22,670 single vesicles over 34 independent experiments. C Phosphorylation response (fluorescence in the antibody channel divided by the fluorescence in the EGFR channel) vs ligand-bound EGFR fraction for individual vesicles (fluorescence in the ligand channel divided by the fluorescence in the EGFR channel). The x axis is scaled such that the maximum average bound fraction is set to 1, and the y axis is phosphorylation corrected for constitutive (ligand-independent) phosphorylation. The solid lines are the transducer function fits (Eq. (5) to all the single vesicle data. Data are from 2173 individual vesicles for Y1068 and 1987 individual vesicles for Y1173 over 9 independent experiments in which the concentration of rho-mEGF was varied (D) The single-vesicle data has been binned in an interval of 0.1 and is shown along with the fits to all the single vesicle data. Shown are standard errors; if not visible they are smaller than the symbols. E The normalized transducer function, given by Eq. (7), and the calculated standard errors. Data are from 2173 individual vesicles for Y1068 and 1987 individual vesicles for Y1173 over 9 independent experiments. F Absolute bias coefficients calculated using Eqs.(19)–(23).

Similar articles

Cited by

References

    1. Schlessinger J. Receptor tyrosine kinases: legacy of the first two decades. Cold Spring Harb. Perspect. Biol. 2014;6:a008912. doi: 10.1101/cshperspect.a008912. - DOI - PMC - PubMed
    1. Paul MD, Hristova K. The transition model of RTK activation: A quantitative framework for understanding RTK signaling and RTK modulator activity. Cytokine Growth Factor Rev. 2019;49:23–31. doi: 10.1016/j.cytogfr.2019.10.004. - DOI - PMC - PubMed
    1. Lemmon MA, Schlessinger J. Cell Signaling by Receptor Tyrosine Kinases. Cell. 2010;141:1117–1134. doi: 10.1016/j.cell.2010.06.011. - DOI - PMC - PubMed
    1. Karl K, Hristova K. Pondering the mechanism of receptor tyrosine kinase activation: The case for ligand-specific dimer microstate ensembles. Curr. Opin. Struct. Biol. 2021;71:193–199. doi: 10.1016/j.sbi.2021.07.003. - DOI - PMC - PubMed
    1. Kenakin T. Biased Receptor Signaling in Drug Discovery. Pharmacol. Rev. 2019;71:267–315. doi: 10.1124/pr.118.016790. - DOI - PubMed

Publication types