. 2023 Nov 21;14(1):7572.
doi: 10.1038/s41467-023-43378-w.

SETD2 deficiency accelerates sphingomyelin accumulation and promotes the development of renal cancer

Affiliations

SETD2 deficiency accelerates sphingomyelin accumulation and promotes the development of renal cancer

Hanyu Rao et al. Nat Commun. .

Abstract

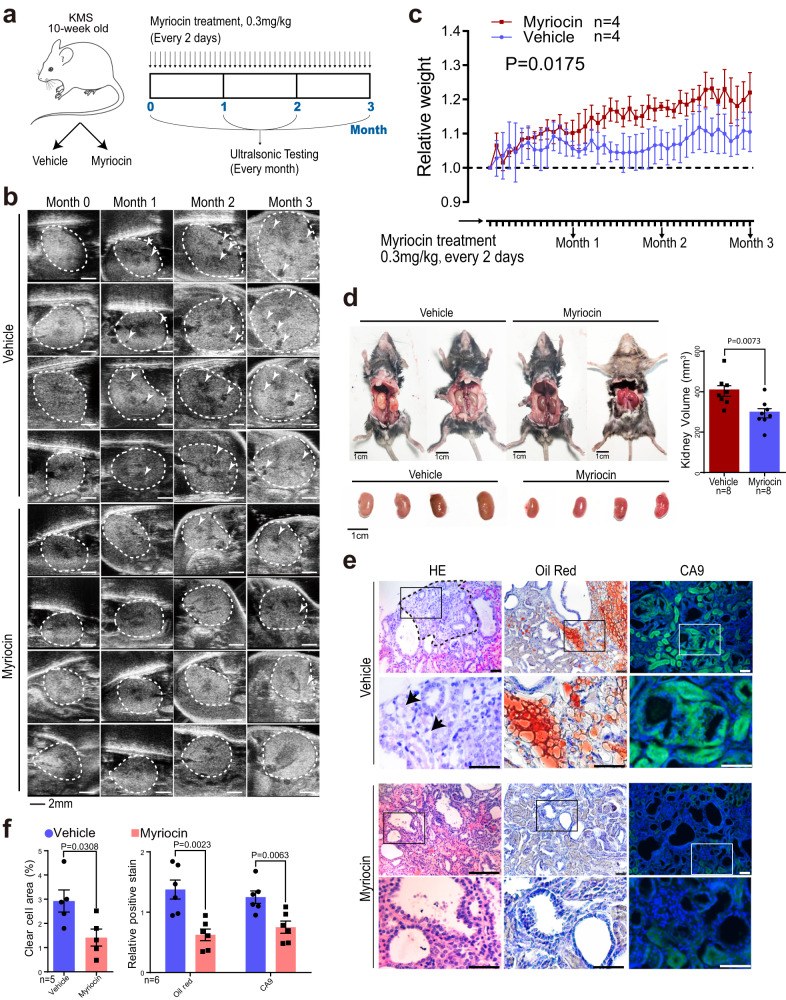
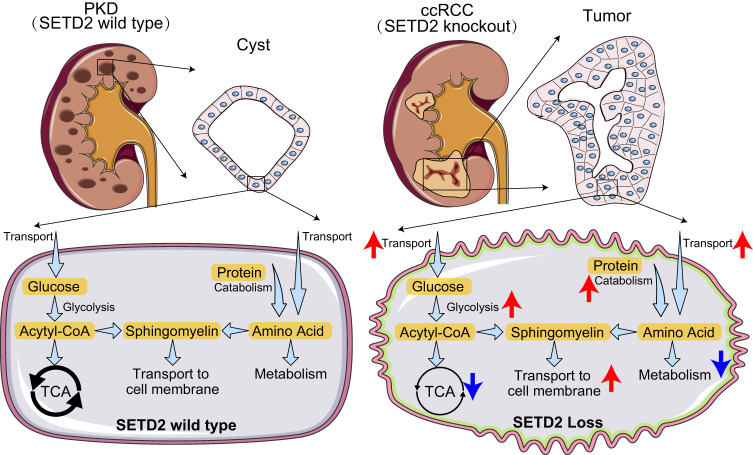
Patients with polycystic kidney disease (PKD) encounter a high risk of clear cell renal cell carcinoma (ccRCC), a malignant tumor with dysregulated lipid metabolism. SET domain-containing 2 (SETD2) has been identified as an important tumor suppressor and an immunosuppressor in ccRCC. However, the role of SETD2 in ccRCC generation in PKD remains largely unexplored. Herein, we perform metabolomics, lipidomics, transcriptomics and proteomics within SETD2 loss induced PKD-ccRCC transition mouse model. Our analyses show that SETD2 loss causes extensive metabolic reprogramming events that eventually results in enhanced sphingomyelin biosynthesis and tumorigenesis. Clinical ccRCC patient specimens further confirm the abnormal metabolic reprogramming and sphingomyelin accumulation. Tumor symptom caused by Setd2 knockout is relieved by myriocin, a selective inhibitor of serine-palmitoyl-transferase and sphingomyelin biosynthesis. Our results reveal that SETD2 deficiency promotes large-scale metabolic reprogramming and sphingomyelin biosynthesis during PKD-ccRCC transition. This study introduces high-quality multi-omics resources and uncovers a regulatory mechanism of SETD2 on lipid metabolism during tumorigenesis.


Conflict of interest statement

The authors declare no competing interests.

Figures

Fig. 1
Fig. 1. SETD2 loss leads to lipid accumulation and ccRCC generation in PKD mice.
a Schematic representation of the establishment of PKD and ccRCC mouse model. b Representative images of H&E, Oil-red staining and longitudinal ultrasonic testing. Aberrant areas were indicated by arrows. Kidneys were indicated by white dotted lines in ultrasonic images. c KMS mice exhibited larger aberrant areas (P = 0.0204), thicker renal tubules (P < 0.0001), larger kidney volumes (P = 0.0360), and more positive staining for Oil red (P < 0.0001) and CA9 (P = 0.0009). d Kaplan–Meier survival curve of indicated mice. e General workflow of multi-omics investigations and data analysis. Scale bars, 50 μm. Statistical comparisons were made using a two-tailed Student t test. Data are represented as mean ± SEM. Source data are provided as a Source Data file.
Fig. 2
Fig. 2. Metabolomics analysis reveals sphingomyelin accumulation in SETD2 deficient ccRCC.
a Schematic representation of the metabolomics analyses of KM and KMS mice. b Altered KEGG metabolic pathways in KMS mice compared to KM mice enriched by significantly altered metabolites (VIP > 1). c Differential metabolites between KMS and KM mice (VIP > 1). Top 7 of the most upregulated metabolites are colored in red. d Chemical composition of the mouse renal tubules lipidome using ClassyFire categories to classify the lipids diversity of all annotated lipids across assays. e Relative abundance of representative lipids between KM (n = 5) and KMS (n = 3). Statistical comparisons were made using a two-tailed Student t test. Data are represented as mean ± SEM. f Differential lipids between KMS and KM mice (VIP > 1). Top 2 of the most upregulated lipids are colored in red. Source data are provided as a Source Data file.
Fig. 3
Fig. 3. SETD2 deficient ccRCC displays altered metabolic pathways.
a Schematic representation of the transcriptomics and proteomics analyses of KM and KMS mice. b Heat map of the top 290 altered proteins between KM (n = 9) and KMS (n = 5) mice. Heat map of the top 1072 altered genes between KM (n = 5) and KMS (n = 5) mice. c Volcano plot of gene and protein alterations between KM and KMS mice. Significantly differential proteins (FDR < 0.05 and fold change >1.5) are colored in red (upregulated) and blue (downregulated) in KMS mice compared to KM mice, while others are colored in gray. d Significantly altered KEGG pathways between KM and KMS mice based on differential genes. e Significantly altered KEGG pathways between KM and KMS mice based on differential proteins. f GSEA analysis of upregulated and downregulated pathways in KMS mice compared to KM mice at mRNA (x axis) and protein (y axis) levels based on GO subset in AmiGO database. Normalized enrichment scores (NES) of GO terms are plotted. Source data are provided as a Source Data file.
Fig. 4
Fig. 4. SETD2 deficiency leads to metabolic reprogramming and upregulated sphingomyelin biosynthesis.
a GSEA of KEGG metabolic pathways enriched in KMS mice compared to KM mice. Upregulated and downregulated pathways are shown in red and blue, respectively. b Heat map and quantitative analysis of altered proteins (FDR < 0.05) in upregulated and downregulated pathways between KMS and KM mice. c, d Reprogrammed metabolic pathways in KMS mice compared to KM mice. e Schema of de novo sphingomyelin biosynthesis with upregulated proteins and metabolites in KMS mice compared to KM mice. The most critical representative proteins and metabolites were highlighted in green and yellow, respectively (FDR < 0.05 and fold change >1.5). f KMS mice showed increased TECR (P < 0.0001), KDSR (P = 0.0049), LPCAT3 (P < 0.0001), Palmitic acid (P = 0.0235), and Sphingomyelin d18:1/18:0 (P = 0.0374), d40:1 (P = 0.0299) and d41:1 (P = 0.0198) compared to KM mice. Statistical comparisons were made using a 2-tailed Student’s t test. Data are represented as mean ± SEM. Source data are provided as a Source Data file.
Fig. 5
Fig. 5. SETD2 loss associates with upregulated sphingomyelin biosynthesis in human ccRCC.
a Sample-averaged, normalized and log-transformed change level for altered protein pairs in human and mouse ccRCC. Up- and down-regulated proteins at both mouse and human ccRCC are shown in red and blue, respectively. b Increased PFKP, SLC16A1, KDSR, LPCAT3 and PFKP proteins, as well as decreased HAAO, GOT2, FABP3, IDH3G and GLYCTK proteins were observed in ccRCC samples compared to adjacent normal kidney tissues (P < 0.0001). c The correlation of key protein abundances and protein level of SETD2 in human ccRCC. d Representative immunofluorescent images showing protein levels of SETD2 in ccRCC patients and representative MALDI-IMS images of ccRCC tissue from the same patients. Statistical comparisons were made using a 2-tailed Student’s t test. Data are represented as mean ± SEM. Source data are provided as a Source Data file.
Fig. 6
Fig. 6. Inhibition of sphingomyelin biosynthesis relieves the tumorigenesis symptom caused by SETD2 deletion in mice.
a Graphic illustration of the workflow and course of treatment. b The longitudinal ultrasonic imaging of tumor development in vehicle- and myriocin-treated KMS mice. Kidneys were indicated by white dotted lines. Scale bars = 2 mm. c, d Body weights and kidney volumes of vehicle- and myriocin-treated KMS mice. Scale bars =1 cm. Representative images (e) and metrics (f) showing protein levels and histologic changes upon the treatment of myriocin. Aberrant areas are indicated by black dotted lines and arrows. The area in the box is enlarged on the right. Scale bars, 50 μm. Statistical comparisons were made using a two-tailed Student t test. Data are represented as mean ± SEM. Source data are provided as a Source Data file.
Fig. 7
Fig. 7. SETD2 deficiency accelerates sphingomyelin accumulation and promotes the transition from PKD to ccRCC.
Schematic representing the role of SETD2 deficiency in promoting large-scale metabolic reprogramming and sphingomyelin biosynthesis during PKD-ccRCC transition.

Similar articles

Cited by

References

    1. Bergmann C, et al. Polycystic kidney disease. Nat. Rev. Dis. Prim. 2018;4:50. doi: 10.1038/s41572-018-0047-y. - DOI - PMC - PubMed
    1. Yu T-M, et al. Risk of cancer in patients with polycystic kidney disease: a propensity-score matched analysis of a nationwide, population-based cohort study. Lancet Oncol. 2016;17:1419–1425. doi: 10.1016/S1470-2045(16)30250-9. - DOI - PubMed
    1. Hsieh JJ, et al. Renal cell carcinoma. Nat. Rev. Dis. Prim. 2017;3:17009. doi: 10.1038/nrdp.2017.9. - DOI - PMC - PubMed
    1. Linehan WM, Ricketts CJ. The Cancer Genome Atlas of renal cell carcinoma: findings and clinical implications. Nat. Rev. Urol. 2019;16:539–552. doi: 10.1038/s41585-019-0211-5. - DOI - PubMed
    1. Yong C, Stewart GD, Frezza C. Oncometabolites in renal cancer. Nat. Rev. Nephrol. 2020;16:156–172. doi: 10.1038/s41581-019-0210-z. - DOI - PMC - PubMed

Publication types

Substances