. 2023 Nov 21;13(1):20407.
doi: 10.1038/s41598-023-47715-3.

CaV3.1 channels facilitate calcium wave generation and myogenic tone development in mouse mesenteric arteries

Affiliations

CaV3.1 channels facilitate calcium wave generation and myogenic tone development in mouse mesenteric arteries

Mohammed A El-Lakany et al. Sci Rep. .

Abstract

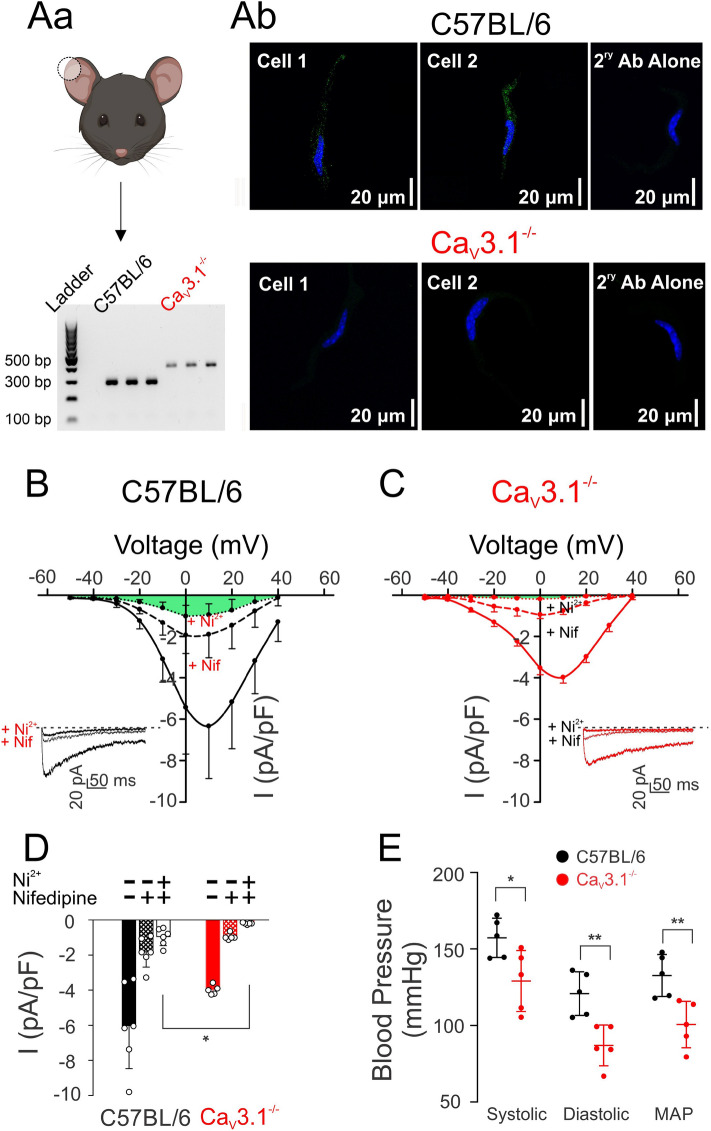
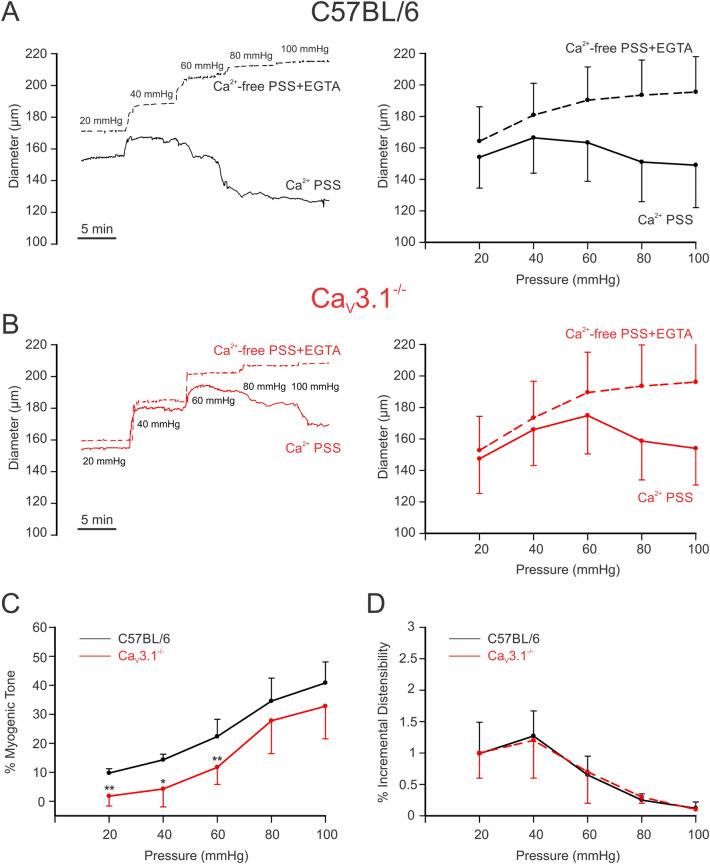
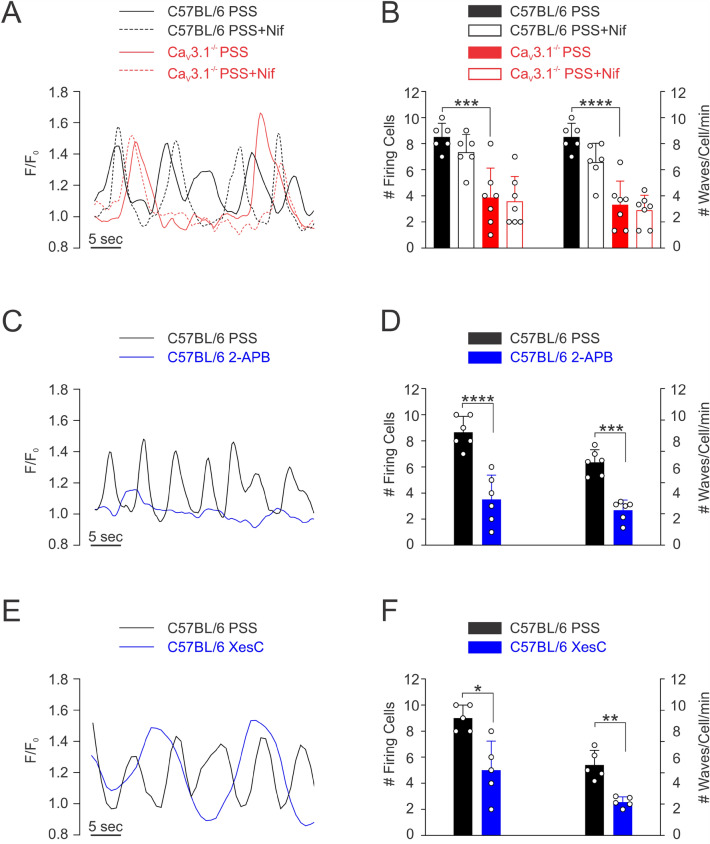
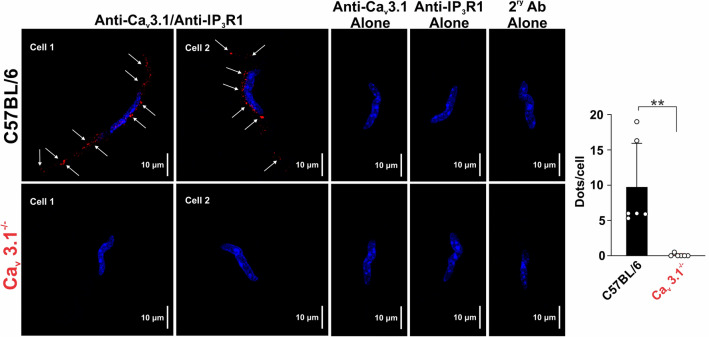
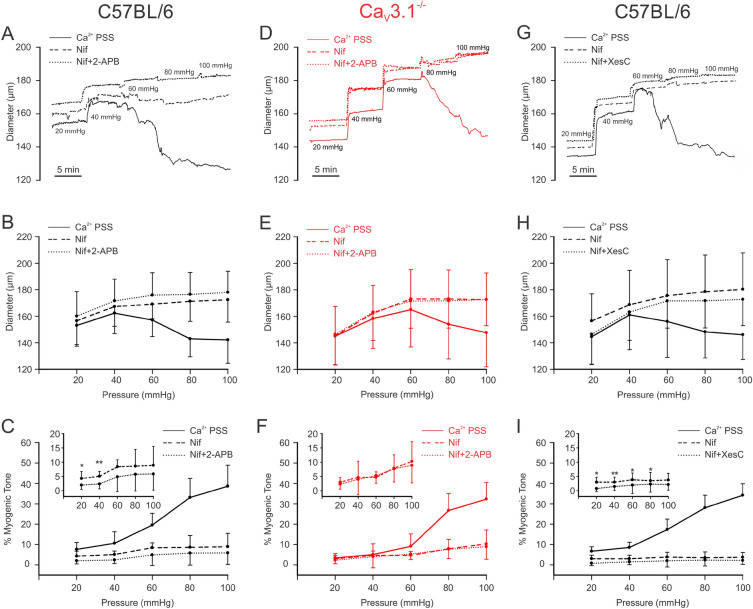
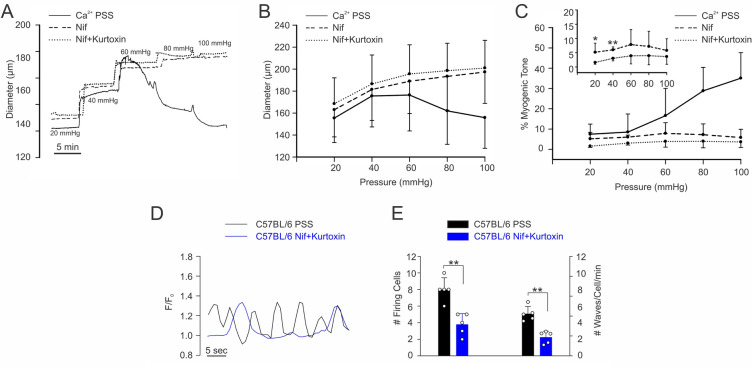
The arterial myogenic response to intraluminal pressure elicits constriction to maintain tissue perfusion. Smooth muscle [Ca2+] is a key determinant of constriction, tied to L-type (CaV1.2) Ca2+ channels. While important, other Ca2+ channels, particularly T-type could contribute to pressure regulation within defined voltage ranges. This study examined the role of one T-type Ca2+ channel (CaV3.1) using C57BL/6 wild type and CaV3.1-/- mice. Patch-clamp electrophysiology, pressure myography, blood pressure and Ca2+ imaging defined the CaV3.1-/- phenotype relative to C57BL/6. CaV3.1-/- mice had absent CaV3.1 expression and whole-cell current, coinciding with lower blood pressure and reduced mesenteric artery myogenic tone, particularly at lower pressures (20-60 mmHg) where membrane potential is hyperpolarized. This reduction coincided with diminished Ca2+ wave generation, asynchronous events of Ca2+ release from the sarcoplasmic reticulum, insensitive to L-type Ca2+ channel blockade (Nifedipine, 0.3 µM). Proximity ligation assay (PLA) confirmed IP3R1/CaV3.1 close physical association. IP3R blockade (2-APB, 50 µM or xestospongin C, 3 µM) in nifedipine-treated C57BL/6 arteries rendered a CaV3.1-/- contractile phenotype. Findings indicate that Ca2+ influx through CaV3.1 contributes to myogenic tone at hyperpolarized voltages through Ca2+-induced Ca2+ release tied to the sarcoplasmic reticulum. This study helps establish CaV3.1 as a potential therapeutic target to control blood pressure.


Conflict of interest statement

The authors declare no competing interests.

Figures

Figure 1
Figure 1
Absence of CaV3.1 expression and current in SMCs isolated from mesenteric arteries of CaV3.1−/− mice, and lower arterial blood pressure indices in CaV3.1−/− mice compared to C57BL/6. (Aa) Polymerase chain reaction of Cacna1g gene (CaV3.1). DNA was extracted from ear notches (C57BL/6 and CaV3.1−/− mice) and amplified; the different product sizes confirm the gene modification leading to functional knockout. Illustration created with BioRender.com. (Ab) CaV3.1 (green) in cerebral arterial myocytes from control mice with nuclei stained with DAPI (blue) detected with immunohistochemistry. This signal was absent in CaV3.1−/− mice. Secondary antibody controls were negative for nonselective labelling (n = 4 cells pooled from 4 animals/group). (B) Averaged CaV currents were assessed by whole-cell patch clamp in C57BL/6 cells showing a residual current remaining (highlighted green) after blocking L-type and CaV3.2 currents by nifedipine and Ni2+, respectively. (C) Recordings of whole-cell CaV currents in CaV3.1−/− cells showing no residual current after nifedipine and Ni2+ treatment. (D) Peak current (I) plots of whole-cell Ba2+ (10 mmol/L) current before and after the application of nifedipine to C57BL/6 and CaV3.1−/− smooth muscle cells. n = 9 SMCs from 6 mice in control group and n = 9 SMCs from 8 mice in knockout group. (* P = 0.013, unpaired t test). (E) Systolic, diastolic, and mean arterial pressure (mmHg) of CaV3.1−/− and C57BL/6 mice were measured using the CODA6 tail-cuff system. 25-min recordings daily for one week were performed on both groups (n = 5). (Systolic: *P = 0.028, Diastolic: **P = 0.005, MAP: **P = 0.008, unpaired t test).
Figure 2
Figure 2
Arteries from CaV3.1−/− mice develop less myogenic tone at low intraluminal pressures. Isolated mesenteric arteries from CaV3.1−/− and C57BL/6 mice underwent a pressure curve in two conditions: PSS containing Ca2+ and Ca2+ free PSS + 2 mM EGTA, a Ca2+-chelating agent. (A,B) Representative trace and summary data of changes in diameter in response to pressure curve (20–100 mmHg) in C57BL/6 and CaV3.1−/−. (C) Summary data shows arteries from CaV3.1−/− mice had lower myogenic tone in the pressure range from 20–60. (20 mmHg: **P = 0.002, 40 mmHg: *P = 0.014, 60 mmHg: **P = 0.008, 80 mmHg: P = 0.188, 100 mmHg: P = 0.108, unpaired t test). (D) Summary data of incremental distensibility shows no difference between groups. (n = 6 arteries from 6 animals for each experiment). (20 mmHg: P = 0.945, 40 mmHg: P = 0.651, 60 mmHg: P = 0.571, 80 mmHg: P = 0.793, 100 mmHg: P = 0.245, unpaired t test).
Figure 3
Figure 3
CaV3.1 deletion has no impact on phenylephrine-induced constriction. Increasing concentrations of phenylephrine were applied onto pressurized arteries isolated from C57BL/6 and CaV3.1−/− mice in the presence and absence of nifedipine (L-type Ca2+ channel blocker). Experiments were conducted at an intraluminal pressure of 60 mmHg. (A,B) Representative traces (Left) and summary data (Right) of changes in diameter in response to phenylephrine showing a decrease in constriction in nifedipine-treated vessels from both strains. (C) %Maximal phenylephrine-induced constriction relative to KCl-induced constriction shows no significant difference in agonist-induced constriction between C57BL/6 and CaV3.1−/− mice. (n = 6 arteries from 6 animals). P values for increasing PE concentrations in PSS: 0.529, 0.790, 0.763, 0.957, 0.554, 0.719 and in PSS + nifedipine: 0.565, 0.343, 0.074, 0.396, 0.925, 0.837 (Paired t test).
Figure 4
Figure 4
Functional roles of CaV3.1 and IP3Rs in Ca2+ waves generation. Rapid Ca2+ imaging was performed on Fluo-8-loaded arteries from CaV3.1−/− and C57BL/6 mice at an intraluminal pressure of 60 mmHg. (A) Representative traces from C57BL/6 and CaV3.1−/− mesenteric arteries with and without nifedipine. (B) Summary data (n = 6 arteries from 6 mice). Number of cells firing (***P = 0.0002) and firing frequency (***P = 0.0001) were significantly reduced in CaV3.1−/− when compared to C57BL/6. Nifedipine did not impact the number of cells firing (C57BL/6: P = 0.485, CaV3.1−/− P = 0.980) or the firing frequency (C57BL/6: P = 0.093, CaV3.1−/− P = 0.925) in either strain. P values were calculated using 2-way ANOVA. (C) Representative traces from C57BL/6 mesenteric arteries with and without 2-APB. (D) Summary data (n = 6 arteries from 6 mice). 2-APB (IP3R inhibitor) decreased the number of cells firing and their firing frequency (****P < 0.0001 and ***P = 0.0002, respectively, paired t test) in mesenteric arteries from C57BL/6 mice. (E) Representative traces from C57BL/6 mesenteric arteries with and without xestospongin C. (F) Summary data (n = 5 arteries from 5 mice). xestospongin C (IP3R inhibitor) decreased the number of cells firing and their firing frequency (*P < 0.011 and **P = 0.002, respectively, paired t test) in mesenteric arteries from C57BL/6 mice. F fluorescence intensity, Fo baseline fluorescence.
Figure 5
Figure 5
CaV3.1 channels colocalize with IP3Rs. Proximity ligation assay was employed using isolated mesenteric arterial SMCs from C57BL/6 (n = 35 cells from 6 animals) and CaV3.1−/− (n = 36 cells from 6 animals) mice to determine the close association (< 40 nm) of CaV3.1 and IP3R1 proteins (red, denoted by white arrows). Nuclei were stained with DAPI (Blue). Control experiments used only one primary antibody or no primary antibody. Note, dots were averaged across cells within each animal, and represented as a data point in the bar graph to facilitate statistical comparison. **P = 0.0033.
Figure 6
Figure 6
IP3R blockade has no impact on myogenic tone development in Cav3.1−/−. Mesenteric arteries isolated from C57BL/6 and CaV3.1−/− mice underwent stepwise pressure increases in control conditions (Ca2+ PSS), with nifedipine (CaV1.2 blocker) alone and with 2-APB or xestospongin C (IP3R blockers). (A,D,G) Representative traces and (B,E,H) summary data of changes in mesenteric arteriolar diameter in response to pressure steps from C57BL/6 (A,G) and CaV3.1−/− mice (D) are depicted. In C57BL/6 mice, pressure-induced constriction decreased after nifedipine, 2-APB, and xestospongin C treatment. In CaV3.1−/− mice, the vasomotor response following nifedipine and 2-APB treatment was not different from nifedipine treatment only. (C,I) %Myogenic tone was reduced following 2-APB (20 mmHg: *P = 0.013, 40 mmHg: **P = 0.008, 60 mmHg: P = 0.124, 80 mmHg: P = 0.085, 100 mmHg: P = 0.102, paired t test) and xestospongin C (20 mmHg: *P = 0.015, 40 mmHg: **P = 0.001, 60 mmHg: *P = 0.02, 80 mmHg: *P = 0.013, 100 mmHg: P = 0.092, paired t test) treatment at 20–40 pressure range in C57BL/6 mice. (F) No changes in myogenic tone were observed following 2-APB treatment in CaV3.1−/− mice. (20 mmHg: P = 0.182, 40 mmHg: P = 0.334, 60 mmHg: P = 0.535, 80 mmHg: P = 0.899, 100 mmHg: P = 0.245, paired t test) (n = 6 arteries from 6 animals for each experiment).
Figure 7
Figure 7
CaV3.x blockade diminishes myogenic tone development and Ca2+ wave generation in C57BL/6 mice. Mesenteric arteries isolated from C57BL/6 mice underwent stepwise pressure increases in control conditions (Ca2+ PSS), with nifedipine (CaV1.2 blocker) alone and with kurtoxin (150 nM, CaV3.x blocker). (A) Representative trace, and summary data of (B) arterial diameter and (C) % myogenic tone to pressure in C57BL/6 mesenteric vessels. Pressure-induced constriction decreased after nifedipine, and kurtoxin treatment. %Myogenic tone was reduced following kurtoxin (20 mmHg: *P = 0.04, 40 mmHg: **P = 0.008, 60 mmHg: P = 0.074, 80 mmHg: P = 0.105, 100 mmHg: P = 0.116, unpaired t test). (D) Representative trace of Ca2+ wave generation in C57BL/6 mesenteric arteries in the absence and presence of nifedipine + kurtoxin. (E) Unlike Fig. 4, where nifedipine had no effect on Ca2+ wave generation, summary data (n = 5 arteries from 5 mice) reveals that further addition of kurtoxin causes a marked attenuation in the number of cells firing and firing frequency (**P = 0.004 and **P = 0.002, respectively, paired t test). F fluorescence intensity, Fo baseline fluorescence.
Figure 8
Figure 8
High-voltage-activated CaV1.2 channels control [Ca2+]i when intravascular pressure is elevated and membrane potential depolarized. In contrast, CaV3.1 channels display a hyperpolarized profile with more negative activation/inactivation properties compared to Cav1.2 channels. CaV3.1 channels foster Ca2+ wave generation likely through sarcoplasmic reticulum IP3R activation as the two proteins lie in close proximity. Ca2+ waves are known to induce a Ca2+-calmodulin (CAM)-dependent activation of myosin light chain kinase (MLCK) which regulates myosin phosphorylation leading to myogenic tone control. CaV3.1 deletion is coupled to reduced blood pressure and hemodynamic control thus bearing clinical importance. Created with BioRender.com.

Similar articles

Cited by

References

    1. Iadecola C, Nedergaard M. Glial regulation of the cerebral microvasculature. Nat. Neurosci. 2007;10:1369–1376. doi: 10.1038/nn2003. - DOI - PubMed
    1. Longden TA, et al. Capillary K+-sensing initiates retrograde hyperpolarization to increase local cerebral blood flow. Nat. Neurosci. 2017;20:717–726. doi: 10.1038/nn.4533. - DOI - PMC - PubMed
    1. Bayliss WM. On the local reactions of the arterial wall to changes of internal pressure. J. Physiol. 1902;28:220–231. doi: 10.1113/jphysiol.1902.sp000911. - DOI - PMC - PubMed
    1. Brozovich FV, et al. Mechanisms of vascular smooth muscle contraction and the basis for pharmacologic treatment of smooth muscle disorders. Pharmacol. Rev. 2016;68:476–532. doi: 10.1124/pr.115.010652. - DOI - PMC - PubMed
    1. Snutch TP, Peloquin J, Mathews E, McRory JE. Voltage-Gated Calcium Channels. Springer; 2005. pp. 61–94.