

The bacterial species profiles of the lingual and salivary microbiota differ with basic tastes sensitivity in human
- PMID: 37989857
- PMCID: PMC10663626
- DOI: 10.1038/s41598-023-47636-1
The bacterial species profiles of the lingual and salivary microbiota differ with basic tastes sensitivity in human
Abstract
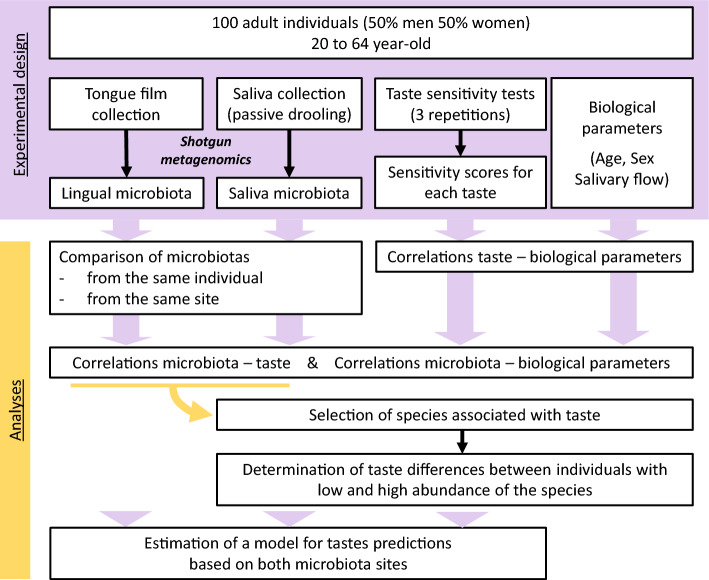
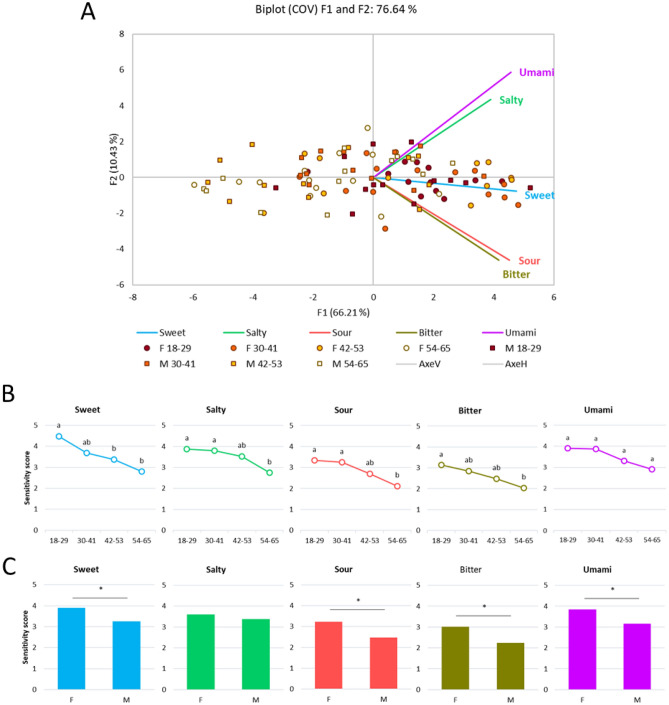
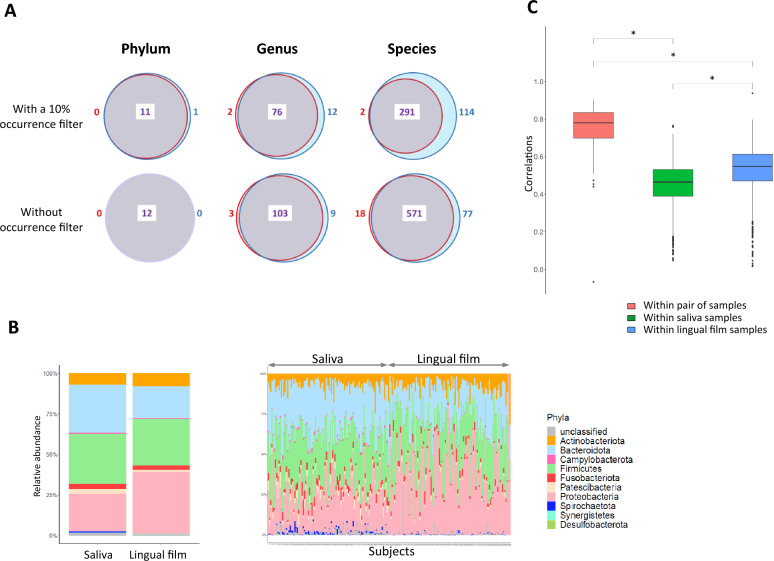
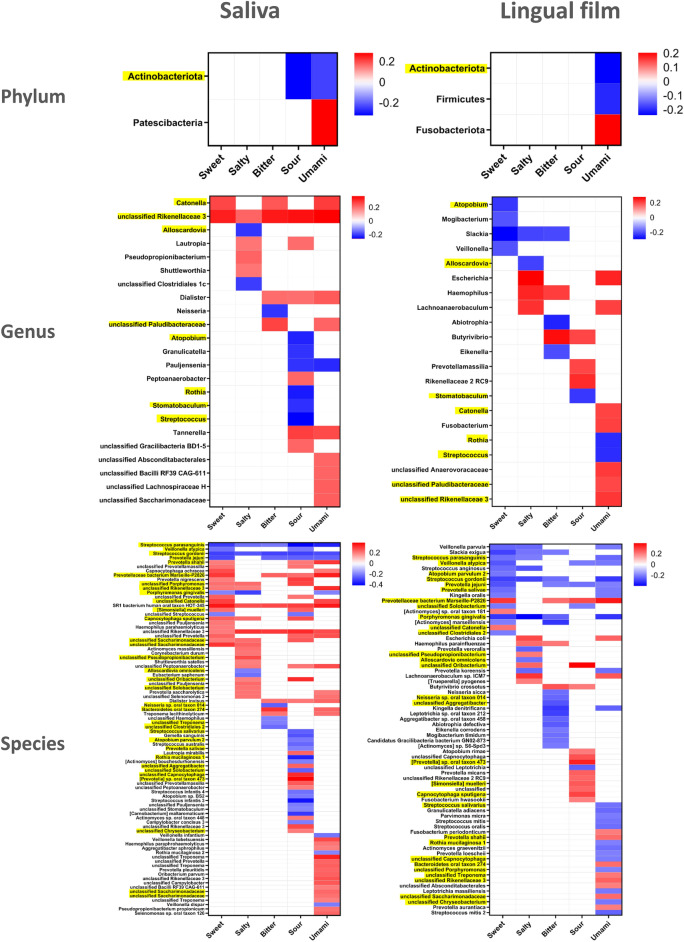
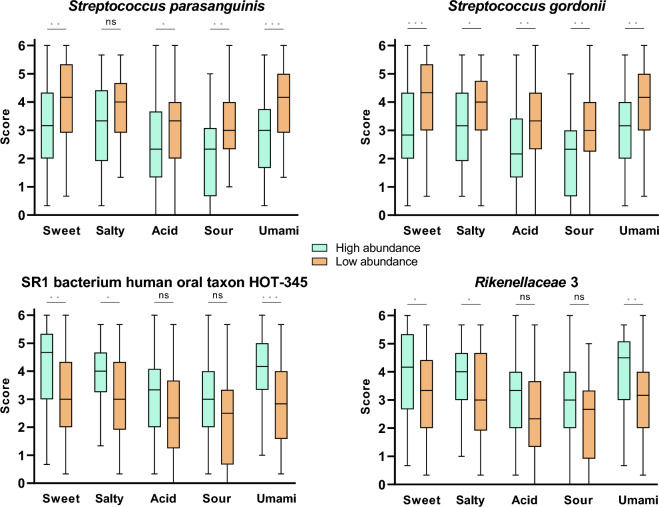
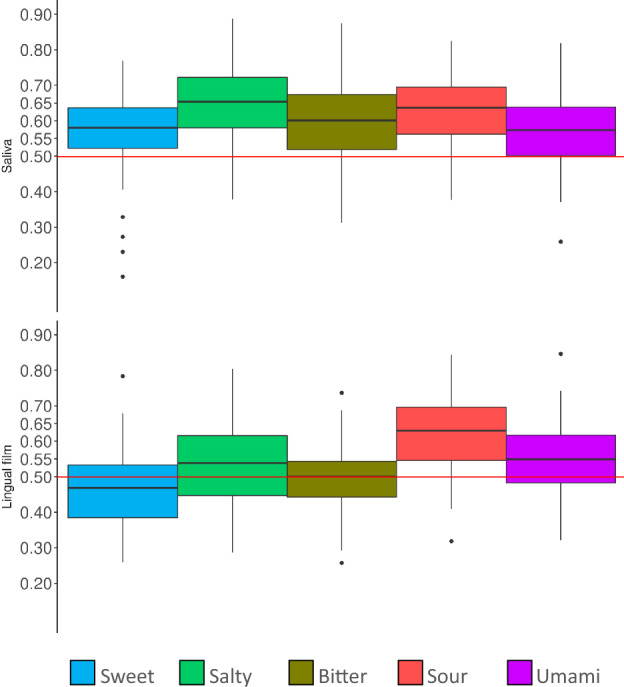
Taste perception is crucial and impairments, which can be linked to pathologies, can lead to eating disorders. It is triggered by taste compounds stimulating receptors located on the tongue. However, the tongue is covered by a film containing saliva and microorganisms suspected to modulate the taste receptor environment. The present study aimed to elucidate the links between taste sensitivity (sweetness, sourness, bitterness, saltiness, umami) and the salivary as well as the tongue microbiota using shotgun metagenomics. 109 bacterial species were correlated with at least one taste. Interestingly, when a species was correlated with at least two tastes, the correlations were unidirectional, indicating a putative global implication. Some Streptococcus, SR1 and Rickenellaceae species correlated with five tastes. When comparing both ecosystems, saliva appears to be a better taste predictor than tongue. This work shows the implication of the oral microbiota in taste and exhibits specificities depending on the ecosystem considered.
© 2023. The Author(s).
Conflict of interest statement
The authors declare no competing interests.
Figures
Similar articles
-
The Associations between Biochemical and Microbiological Variables and Taste Differ in Whole Saliva and in the Film Lining the Tongue.Biomed Res Int. 2018 Jun 14;2018:2838052. doi: 10.1155/2018/2838052. eCollection 2018. Biomed Res Int. 2018. PMID: 30013981 Free PMC article.
-
[Studies on the taste perceptive threshold for 4 basic taste qualities at various sites of lingual surface].Fukuoka Igaku Zasshi. 1997 Oct;88(10):331-6. Fukuoka Igaku Zasshi. 1997. PMID: 9394543 Japanese.
-
Metabolic Profiling of Fish Meat by GC-MS Analysis, and Correlations with Taste Attributes Obtained Using an Electronic Tongue.Metabolites. 2018 Dec 21;9(1):1. doi: 10.3390/metabo9010001. Metabolites. 2018. PMID: 30577613 Free PMC article.
-
Perception and hedonic value of basic tastes in domestic ruminants.Physiol Behav. 2011 Oct 24;104(5):666-74. doi: 10.1016/j.physbeh.2011.07.011. Epub 2011 Jul 28. Physiol Behav. 2011. PMID: 21798275 Review.
-
Contribution of umami taste substances in human salivation during meal.J Med Invest. 2009;56 Suppl:197-204. doi: 10.2152/jmi.56.197. J Med Invest. 2009. PMID: 20224181 Review.
Cited by
-
Nitrate supplementation affects taste by changing the oral metabolome and microbiome.NPJ Biofilms Microbiomes. 2025 May 2;11(1):69. doi: 10.1038/s41522-025-00689-8. NPJ Biofilms Microbiomes. 2025. PMID: 40316518 Free PMC article.
-
Novel potential biomarkers for predicting childhood caries via metagenomic analysis.Front Cell Infect Microbiol. 2025 Jun 17;15:1522970. doi: 10.3389/fcimb.2025.1522970. eCollection 2025. Front Cell Infect Microbiol. 2025. PMID: 40599650 Free PMC article.
References
-
- Brondel L, Jacquin A, Meillon S, Penicaud L. Taste: Physiology, roles and dysfunction. Nutr. Clin. Metab. 2013;27(3):123–133. doi: 10.1016/j.nupar.2013.06.002. - DOI
-
- Mounayar R, Morzel M, Brignot H, Tremblay-Franco M, Canlet C, Lucchi G, Ducoroy P, Feron G, Neyraud E. Nutri-metabolomics applied to taste perception phenotype: Human subjects with high and low sensitivity to taste of fat differ in salivary response to oleic acid. OMICS. 2014;18(11):666–672. doi: 10.1089/omi.2014.0108. - DOI - PubMed
MeSH terms
Grants and funding
LinkOut - more resources
Full Text Sources
Medical
