

Temporal patterns of gene expression in response to inoculation with a virulent Anaplasma phagocytophilum strain in sheep
- PMID: 37989861
- PMCID: PMC10663591
- DOI: 10.1038/s41598-023-47801-6
Temporal patterns of gene expression in response to inoculation with a virulent Anaplasma phagocytophilum strain in sheep
Abstract
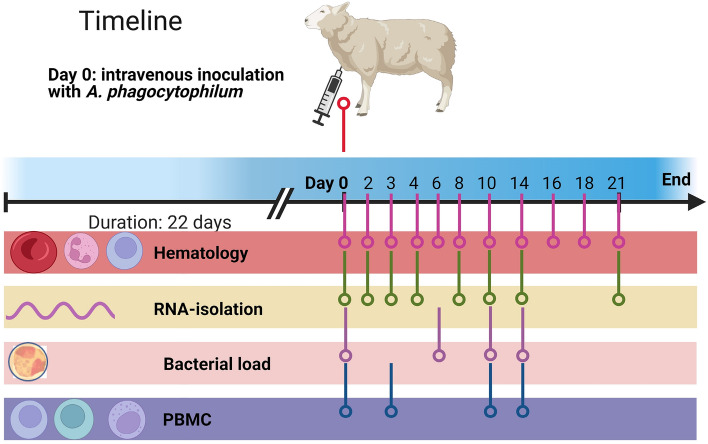
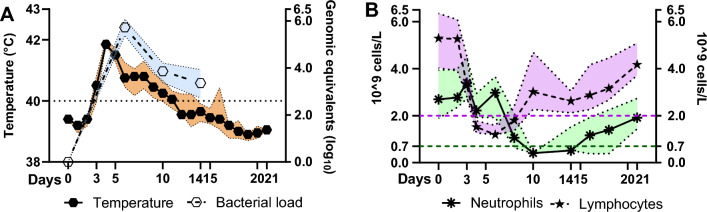
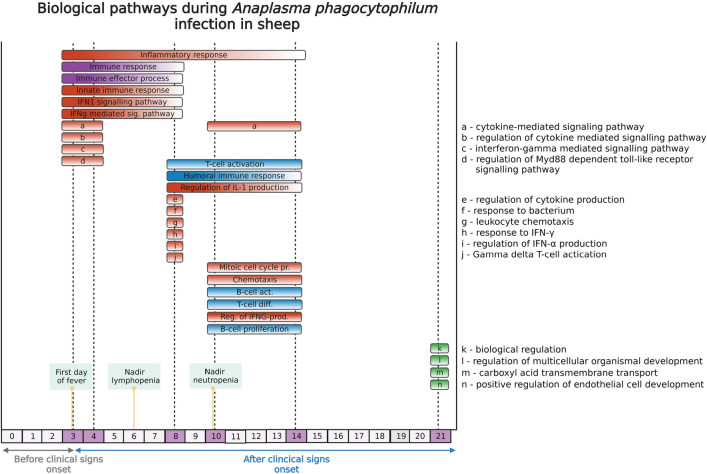
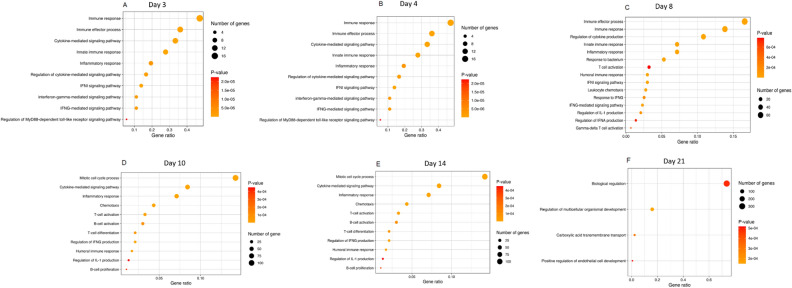
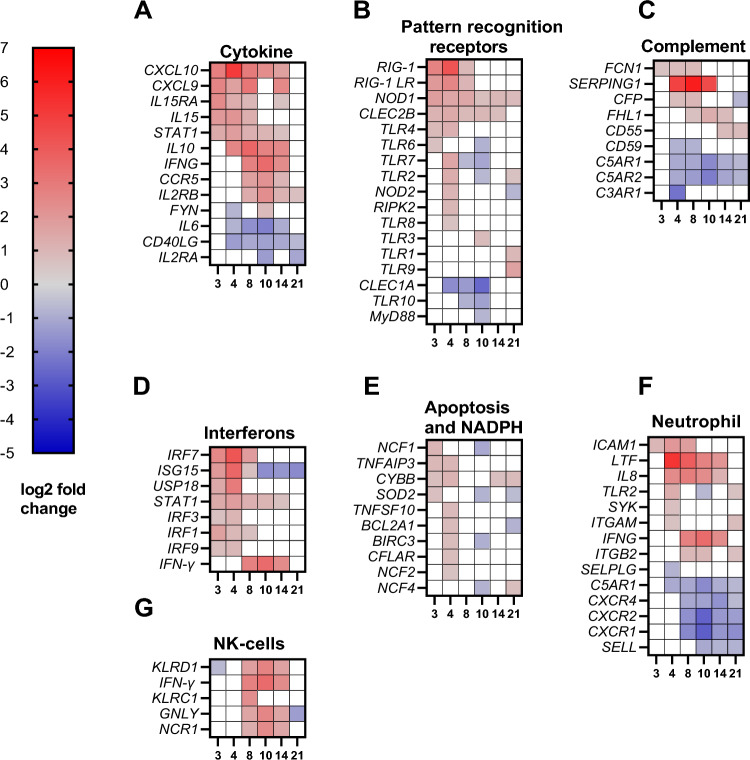
The aim of this study was to characterize the gene expression of host immune- and cellular responses to a Norwegian virulent strain of Anaplasma phagocytophilum, the cause of tick-borne fever in sheep. Ten sheep were intravenously inoculated with a live virulent strain of A. phagocytophilum. Clinical-, observational-, hematological data as well as bacterial load, flow cytometric cell count data from peripheral blood mononuclear cells and host's gene expression post infection was analysed. The transcriptomic data were assessed for pre-set time points over the course of 22 days following the inoculation. Briefly, all inoculated sheep responded with clinical signs of infection 3 days post inoculation and onwards with maximum bacterial load observed on day 6, consistent with tick-borne fever. On days, 3-8, the innate immune responses and effector processes such as IFN1 signaling pathways and cytokine mediated signaling pathways were observed. Several pathways associated with the adaptive immune responses, namely T-cell activation, humoral immune responses, B-cell activation, and T- and B-cell differentiation dominated on the days of 8, 10 and 14. Flow-cytometric analysis of the PBMCs showed a reduction in CD4+CD25+ cells on day 10 and 14 post-inoculation and a skewed CD4:CD8 ratio indicating a reduced activation and proliferation of CD4-T-cells. The genes of important co-stimulatory molecules such as CD28 and CD40LG, important in T- and B-cell activation and proliferation, did not significantly change or experienced downregulation throughout the study. The absence of upregulation of several co-stimulatory molecules might be one possible explanation for the low activation and proliferation of CD4-T-cells during A. phagocytophilum infection, indicating a suboptimal CD4-T-cell response. The upregulation of T-BET, EOMES and IFN-γ on days 8-14 post inoculation, indicates a favoured CD4 Th1- and CD8-response. The dynamics and interaction between CD4+CD25+ and co-stimulatory molecules such as CD28, CD80, CD40 and CD40LG during infection with A. phagocytophilum in sheep needs further investigation in the future.
© 2023. The Author(s).
Conflict of interest statement
The authors declare no competing interests.
Figures


Similar articles
-
Clinical and immunological responses in sheep after inoculation with Himar1-transformed Anaplasma phagocytophilum and subsequent challenge with a virulent strain of the bacterium.Vet Immunol Immunopathol. 2021 Jan;231:110165. doi: 10.1016/j.vetimm.2020.110165. Epub 2020 Dec 2. Vet Immunol Immunopathol. 2021. PMID: 33316536
-
Modulation of leukocyte populations and immune responses in sheep experimentally infected with Anaplasma (formerly Ehrlichia) phagocytophilum.Vet Immunol Immunopathol. 2003 Aug 15;94(3-4):163-75. doi: 10.1016/s0165-2427(03)00101-6. Vet Immunol Immunopathol. 2003. PMID: 12909412
-
Assessing the clinical and bacteriological outcomes of vaccination with recombinant Asp14 and OmpA against A. phagocytophilum in sheep.Vet Immunol Immunopathol. 2019 Dec;218:109936. doi: 10.1016/j.vetimm.2019.109936. Epub 2019 Sep 11. Vet Immunol Immunopathol. 2019. PMID: 31590072
-
Persistent Infections and Immunity in Ruminants to Arthropod-Borne Bacteria in the Family Anaplasmataceae.Annu Rev Anim Biosci. 2016;4:177-97. doi: 10.1146/annurev-animal-022513-114206. Epub 2015 Dec 23. Annu Rev Anim Biosci. 2016. PMID: 26734888 Review.
-
Mechanisms of obligatory intracellular infection with Anaplasma phagocytophilum.Clin Microbiol Rev. 2011 Jul;24(3):469-89. doi: 10.1128/CMR.00064-10. Clin Microbiol Rev. 2011. PMID: 21734244 Free PMC article. Review.
References
-
- Bakken, J. S., Dumler, J. S., Chen, S. M., Eckman, M. R., Van Etta, L. L. & Walker, D. H. Human granulocytic ehrlichiosis in the upper Midwest United States. A new species emerging? JAMA272, 212–218 (1994). - PubMed
-
- Strasek Smrdel, K., von Loewenich, F. D., Petrovec, M. & Avsic Zupanc, T. Diversity of ankA and msp4 genes of Anaplasma phagocytophilum in Slovenia. Ticks Tick Borne Dis.6, 164–166. 10.1016/j.ttbdis.2014.11.008 (2015). - PubMed
MeSH terms
Substances
LinkOut - more resources
Full Text Sources
Medical
Research Materials
