

Lowering Hippocampal miR-29a Expression Slows Cognitive Decline and Reduces Beta-Amyloid Deposition in 5×FAD Mice
- PMID: 37989983
- PMCID: PMC11087195
- DOI: 10.1007/s12035-023-03791-0
Lowering Hippocampal miR-29a Expression Slows Cognitive Decline and Reduces Beta-Amyloid Deposition in 5×FAD Mice
Abstract
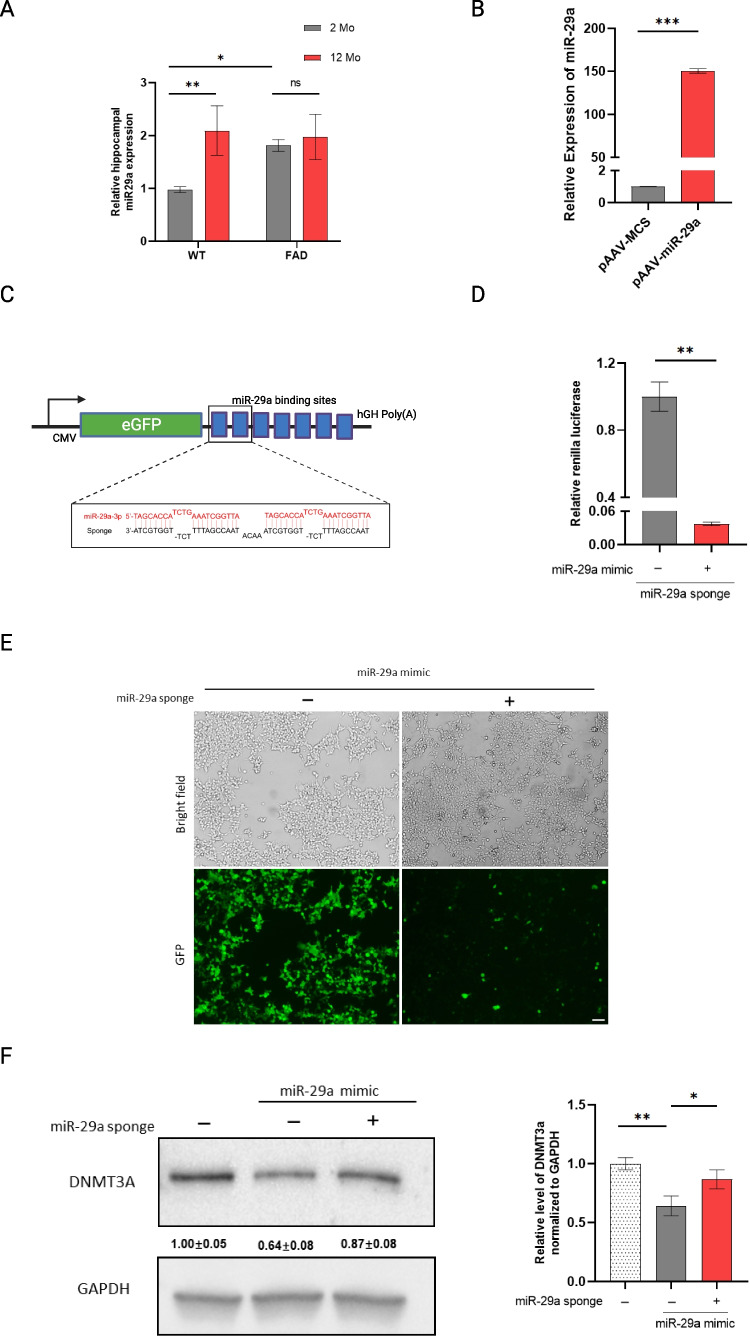
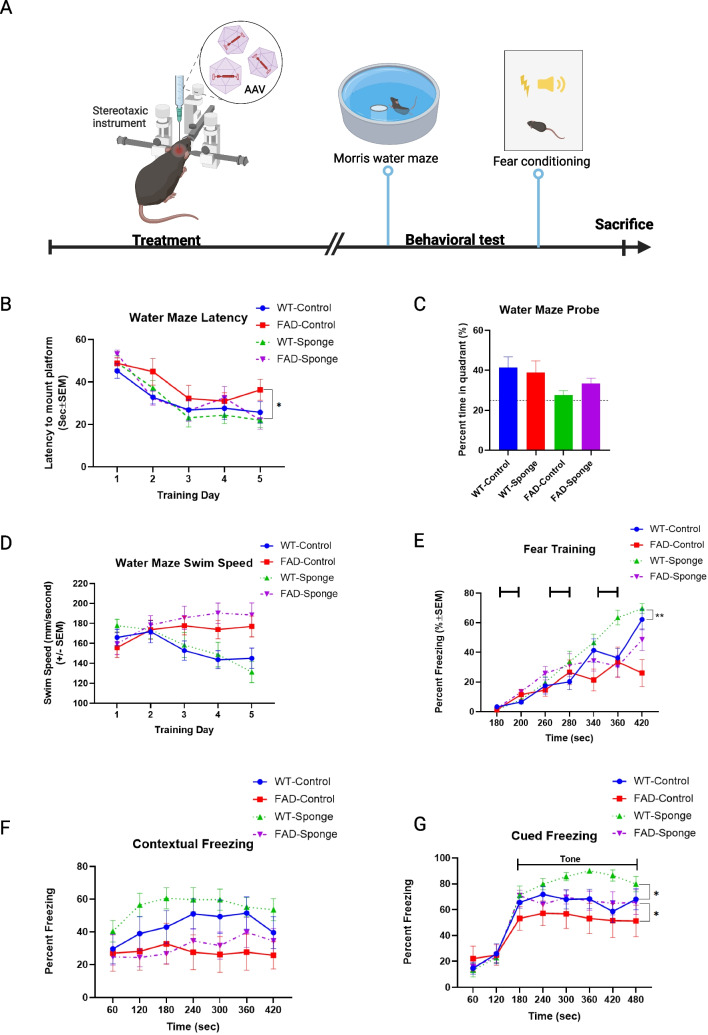
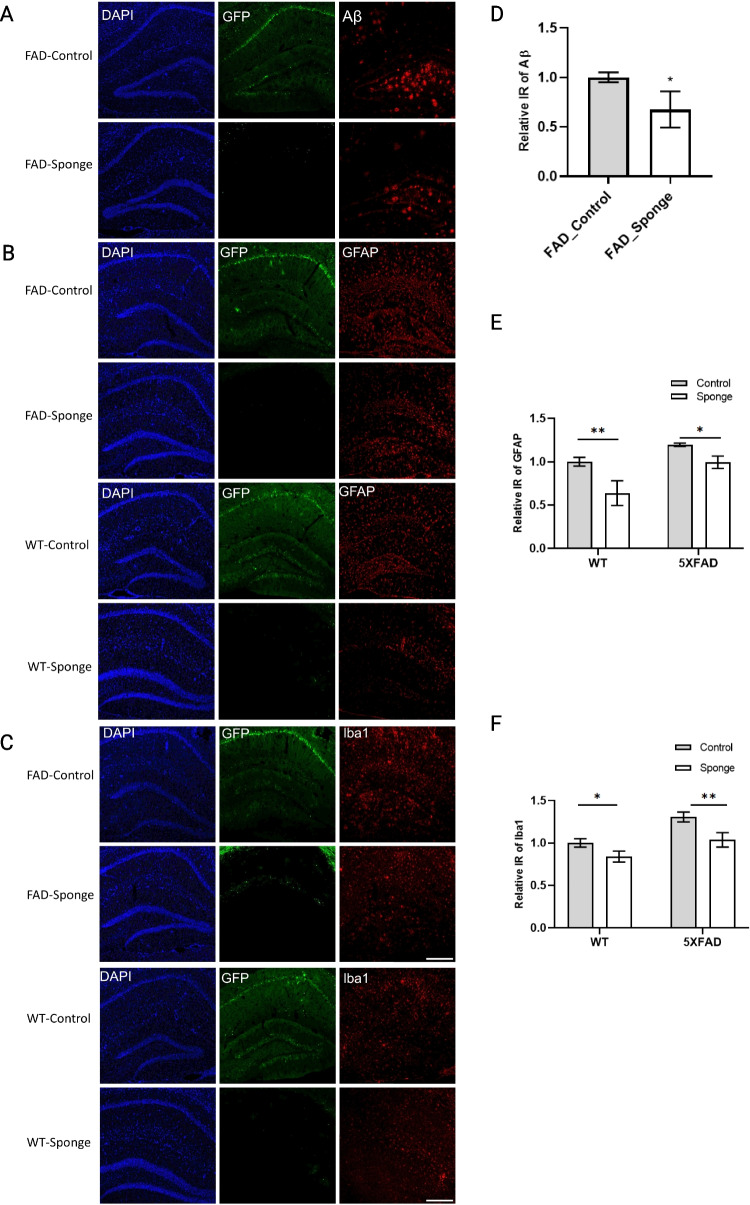
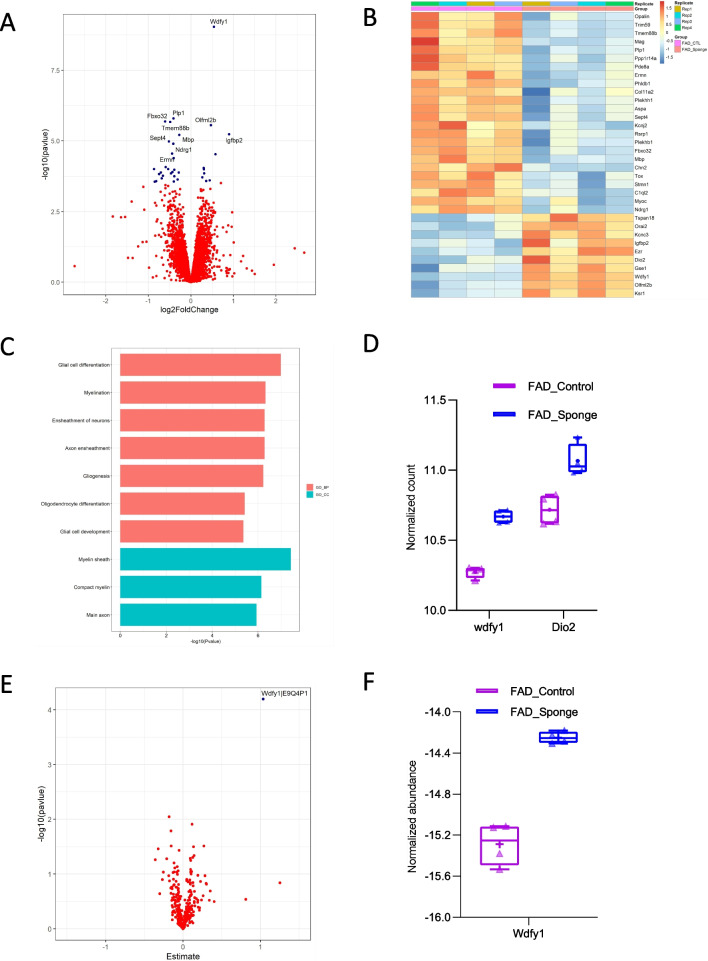
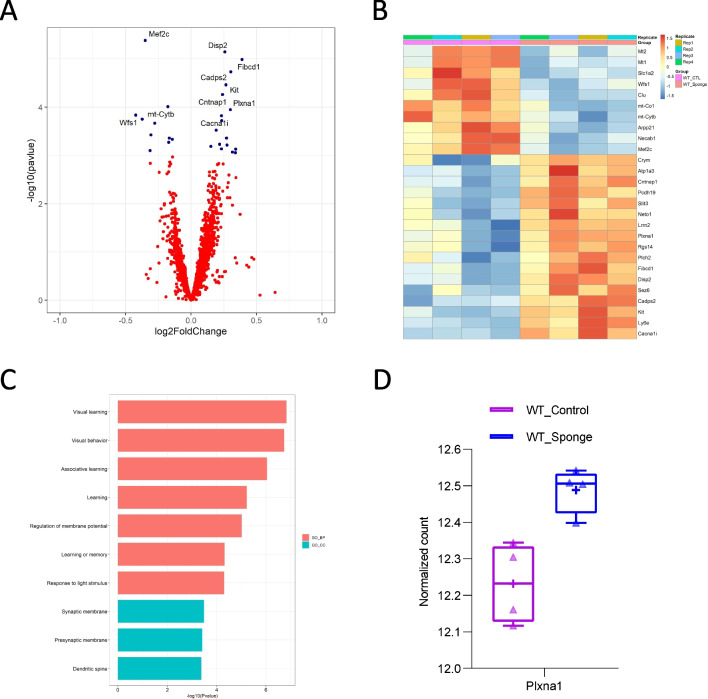
microRNA-29a (miR-29a) increases with age in humans and mice, and, in the brain, it has a role in neuronal maturation and response to inflammation. We previously found higher miR-29a levels in the human brain to be associated with faster antemortem cognitive decline, suggesting that lowering miR-29a levels could ameliorate memory impairment in the 5×FAD AD mouse model. To test this, we generated an adeno-associated virus (AAV) expressing GFP and a miR-29a "sponge" or empty vector. We found that the AAV expressing miR-29a sponge functionally reduced miR-29a levels and improved measures of memory in the Morris water maze and fear condition paradigms when delivered to the hippocampi of 5×FAD and WT mice. miR-29a sponge significantly reduced hippocampal beta-amyloid deposition in 5×FAD mice and lowered astrocyte and microglia activation in both 5×FAD and WT mice. Using transcriptomic and proteomic sequencing, we identified Plxna1 and Wdfy1 as putative effectors at the transcript and protein level in WT and 5×FAD mice, respectively. These data indicate that lower miR-29a levels mitigate cognitive decline, making miR-29a and its target genes worth further evaluation as targets to mitigate Alzheimer's disease (AD).
Keywords: Beta-amyloid; Cognition; Neuroinflammation; Wdfy1; miR-29a.
© 2023. The Author(s).
Conflict of interest statement
The authors declare no competing interests.
Figures
Update of
-
Lowering hippocampal miR-29a expression slows cognitive decline and reduces beta-amyloid deposition in 5xFAD mice.Res Sq [Preprint]. 2023 Aug 16:rs.3.rs-3235257. doi: 10.21203/rs.3.rs-3235257/v1. Res Sq. 2023. Update in: Mol Neurobiol. 2024 Jun;61(6):3343-3356. doi: 10.1007/s12035-023-03791-0. PMID: 37645711 Free PMC article. Updated. Preprint.
Similar articles
-
Lowering hippocampal miR-29a expression slows cognitive decline and reduces beta-amyloid deposition in 5xFAD mice.Res Sq [Preprint]. 2023 Aug 16:rs.3.rs-3235257. doi: 10.21203/rs.3.rs-3235257/v1. Res Sq. 2023. Update in: Mol Neurobiol. 2024 Jun;61(6):3343-3356. doi: 10.1007/s12035-023-03791-0. PMID: 37645711 Free PMC article. Updated. Preprint.
-
Co-Aggregation of Syndecan-3 with β-Amyloid Aggravates Neuroinflammation and Cognitive Impairment in 5×FAD Mice.Int J Mol Sci. 2025 Jun 8;26(12):5502. doi: 10.3390/ijms26125502. Int J Mol Sci. 2025. PMID: 40564963 Free PMC article.
-
Sodium oligomannate alters gut microbiota, reduces cerebral amyloidosis and reactive microglia in a sex-specific manner.Mol Neurodegener. 2024 Feb 17;19(1):18. doi: 10.1186/s13024-023-00700-w. Mol Neurodegener. 2024. PMID: 38365827 Free PMC article.
-
Vitamin E for Alzheimer's dementia and mild cognitive impairment.Cochrane Database Syst Rev. 2017 Apr 18;4(4):CD002854. doi: 10.1002/14651858.CD002854.pub5. Cochrane Database Syst Rev. 2017. PMID: 28418065 Free PMC article.
-
Systematic review of the relationship between amyloid-β levels and measures of transgenic mouse cognitive deficit in Alzheimer's disease.J Alzheimers Dis. 2015;44(3):787-95. doi: 10.3233/JAD-142208. J Alzheimers Dis. 2015. PMID: 25362040 Free PMC article.
Cited by
-
Gene expression analysis reveals mir-29 as a linker regulatory molecule among rheumatoid arthritis, inflammatory bowel disease, and dementia: Insights from systems biology approach.PLoS One. 2025 Jan 15;20(1):e0316584. doi: 10.1371/journal.pone.0316584. eCollection 2025. PLoS One. 2025. PMID: 39813219 Free PMC article.
-
Polyphenols and miRNA interplay: a novel approach to combat apoptosis and inflammation in Alzheimer's disease.Front Aging Neurosci. 2025 May 7;17:1571563. doi: 10.3389/fnagi.2025.1571563. eCollection 2025. Front Aging Neurosci. 2025. PMID: 40400913 Free PMC article. Review.
-
Epigenetic modifications of DNA and RNA in Alzheimer's disease.Front Mol Neurosci. 2024 Apr 25;17:1398026. doi: 10.3389/fnmol.2024.1398026. eCollection 2024. Front Mol Neurosci. 2024. PMID: 38726308 Free PMC article. Review.
-
Expression of some circulating microRNAs as predictive biomarkers for prognosis and treatment response in glioblastoma.Sci Rep. 2025 Jan 14;15(1):1933. doi: 10.1038/s41598-024-83800-x. Sci Rep. 2025. PMID: 39809835 Free PMC article.
-
Therapeutic effects of miR-937-3p by targeting NTN1 expression and regulating apoptosis in an Aβ-induced neuronal cell death.Sci Rep. 2025 Jul 2;15(1):23611. doi: 10.1038/s41598-025-08015-0. Sci Rep. 2025. PMID: 40604203 Free PMC article.
