. 2023 Nov 21;14(1):7594.
doi: 10.1038/s41467-023-43393-x.

Optomechanical ring resonator for efficient microwave-optical frequency conversion

Affiliations

Optomechanical ring resonator for efficient microwave-optical frequency conversion

I-Tung Chen et al. Nat Commun. .

Abstract

Phonons traveling in solid-state devices are emerging as a universal excitation for coupling different physical systems. Phonons at microwave frequencies have a similar wavelength to optical photons in solids, enabling optomechanical microwave-optical transduction of classical and quantum signals. It becomes conceivable to build optomechanical integrated circuits (OMIC) that guide both photons and phonons and interconnect photonic and phononic devices. Here, we demonstrate an OMIC including an optomechanical ring resonator (OMR), where co-resonant infrared photons and GHz phonons induce significantly enhanced interconversion. The platform is hybrid, using wide bandgap semiconductor gallium phosphide (GaP) for waveguiding and piezoelectric zinc oxide (ZnO) for phonon generation. The OMR features photonic and phononic quality factors of >1 × 10⁵ and 3.2 × 10³, respectively. The optomechanical interconversion between photonic modes achieved an internal conversion efficiency [Formula: see text] and a total device efficiency [Formula: see text] at a low acoustic pump power of 1.6 mW. The efficient conversion in OMICs enables microwave-optical transduction for quantum information and microwave photonics applications.


Conflict of interest statement

The authors declare no competing interests.

Figures
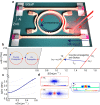
Fig. 1
Fig. 1. Optomechanical ring resonator (OMR) with co-resonating photon and phonon modes.
a Schematic illustration of the optomechanical integrated circuit (OMIC) device, which consists of photonic and phononic waveguides coupled with an OMR. b The photonic dispersion curve of the OMR waveguide, which supports TE0 (red) and TE2 (orange) modes. The counter-propagating TE0 (ω0) photonic mode and the L2 (Ω) phononic mode (blue arrow) are phase-matched to generate the TE2 (ω2=ω0+Ω) mode through the anti-Stokes scattering process. The red, yellow, and blue arrows represent the TE0, TE2 and the L2 mode traveling directions inside the OMR. c The phononic dispersion of the OMR waveguide. The L2 mode is denoted as the solid blue line. d The cross-sectional mode profiles of the TE0, TE2, and the L2 modes. The color bar of the L2 mode represents the y-component displacement field. The color bar of the TE0 mode represents the x-component of the electric field.
Fig. 2
Fig. 2. Phononic and photonic resonances of the optomechanical ring (OMR).
a The bottom layer is an optical image of the optomechanical integrated circuit (OMIC) device. Scale bar: 100 μm. The middle and the top layers are schematic illustrations of the phononic and photonic circuitry, respectively, of the OMIC. b Broadband |S11| spectrum of one of the IDTs measured at 4 K (blue) and room temperature (black). c Normalized optical transmission spectrum of the OMR. The inset shows the zoomed-in resonance at 1571.7 nm, the red line is the Lorentzian fitting of the resonance, and the open circles are the measured data. The loaded optical quality factor Qol=7.5×10⁴. d Time-gated transmission spectrum |S21| of the OMR measured at 4 K. The spacing of the gray dashed lines denote the FSR (5.5 MHz) of the phononic resonances around 2.56 GHz. The inset shows the zoomed-in |S21| at 2.56 GHz, the red line is the Lorentzian fitting of the resonance, and the open circles are the measured data. The loaded acoustic quality factor Qal=2300.
Fig. 3
Fig. 3. Time-reversal symmetry and optical non-reciprocity of the optomechanical ring resonator (OMR).
The OMR is measured with different configurations in the four quadratures made of photon and phonon propagation directions. The TE2 output signal is measured and plotted as the normalized intensity in arbitrary units (a.u.). a and f are the cases where the photon and phonon are counter-propagating, thus in the second and fourth quadrature, respectively. They are time-reversal of each other. b and e are cases where the photon and phonon are co-propagating, thus in the first and third quadrature, respectively. They are also time-reversal of each other. c and d are cases when only photons circulate in the OMR with no phonons, thus on the x-axis. (a and b), (e and f) are the optical reciprocal of each other. The non-reciprocal output is due to the symmetry-breaking by phonons. The device schematics in each quadrature illustrate the selected input port for the specific propagation directions. The TE2 transmission is normalized to cases (c) and (d). The solid lines are Lorentzian fitting, and the open circles are measured data.
Fig. 4
Fig. 4. Spectral-resolving heterodyne measurement of optomechanical mode conversion process.
a Heterodyne measurement schematic. EDFA erbium-doped fiber amplifier, RSA real-time spectrum analyzer, AOFS acousto-optic frequency shifter. The reference signal is generated by shifting the laser frequency by δ/2π=102.9 MHz using an AOFS. b The beating signals of the heterodyne measurement, the red and blue signals correspond to the counter-propagating anti-Stokes P02(Ωδ) and co-propagating Stokes P02(Ω+δ) signals of the optomechanical ring resonator (OMR), respectively. The purple signal P02(δ) is generated by the beating of the static TE2 mode and reference signal. It thus provides a measure of the TE0 pump intensity in the OMR. Inset: zoom-in of the signals P02(Ωδ), P02(Ω), and P02(Ω+δ). c Anti-Stokes signal P02(Ωδ) as a function of acoustic wave frequency. The gray dashed line denotes the 5.1 MHz frequency separation between the two peaks. d TE0 mode pump depletion signal P02(δ) as a function of L2 mode pump power. The purple solid line is the Coupled-mode theory (CMT) fitting. e Anti-Stokes signal P02(Ωδ) as a function L2 mode pump power. The red solid line is the CMT fitting. The solid circles within the error bar in (d and e) represent the mean of the measurements.

References

    1. Delsing P, et al. The 2019 surface acoustic waves roadmap. J. Phys. D Appl. Phys. 2019;52:353001. doi: 10.1088/1361-6463/ab1b04. - DOI
    1. Fu W, et al. Phononic integrated circuitry and spin–orbit interaction of phonons. Nat. Commun. 2019;10:2743. doi: 10.1038/s41467-019-10852-3. - DOI - PMC - PubMed
    1. Dahmani YD, Sarabalis CJ, Jiang W, Mayor FM, Safavi-Naeini AH. Piezoelectric transduction of a wavelength-scale mechanical waveguide. Phys. Rev. Appl. 2020;13:24069. doi: 10.1103/PhysRevApplied.13.024069. - DOI
    1. Mayor FM, et al. Gigahertz phononic integrated circuits on thin-film lithium niobate on sapphire. Phys. Rev. Appl. 2021;15:014039. doi: 10.1103/PhysRevApplied.15.014039. - DOI
    1. Xu X-B, et al. High-frequency traveling-wave phononic cavity with sub-micron wavelength. Appl. Phys. Lett. 2022;120:163503. doi: 10.1063/5.0086751. - DOI