. 2023 Nov 21;14(1):6763.
doi: 10.1038/s41467-023-42424-x.

Intestinal Atp8b1 dysfunction causes hepatic choline deficiency and steatohepatitis

Affiliations

Intestinal Atp8b1 dysfunction causes hepatic choline deficiency and steatohepatitis

Ryutaro Tamura et al. Nat Commun. .

Abstract

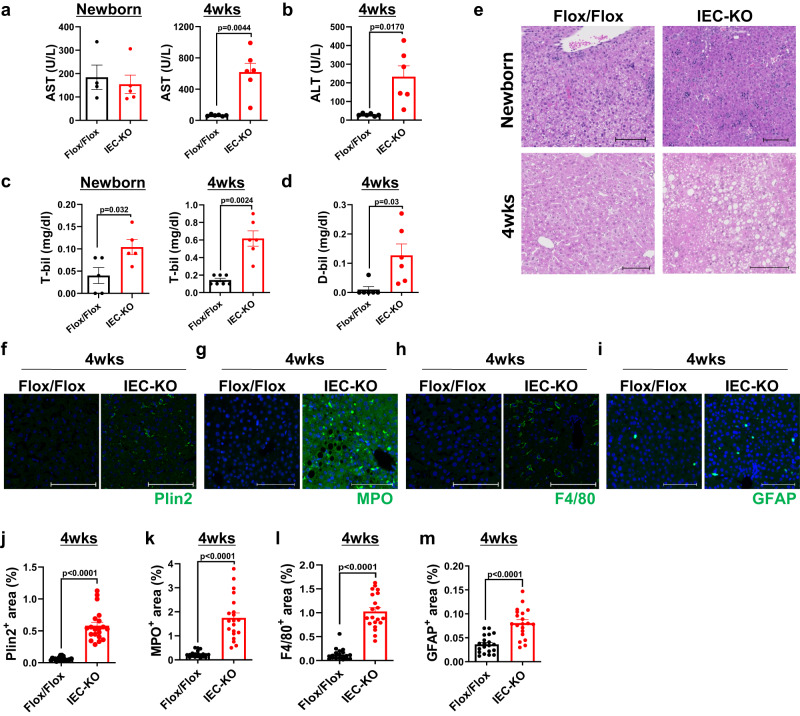
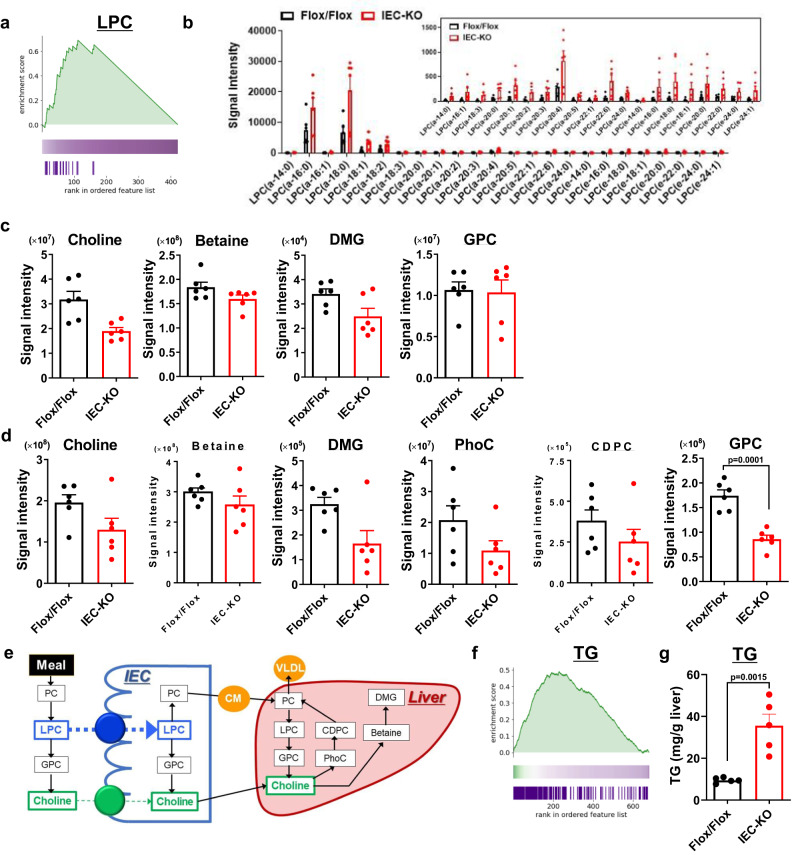
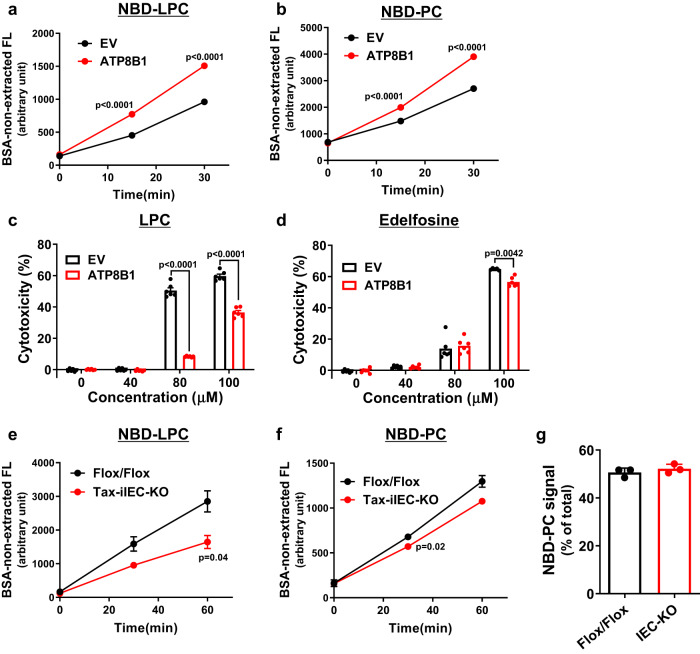
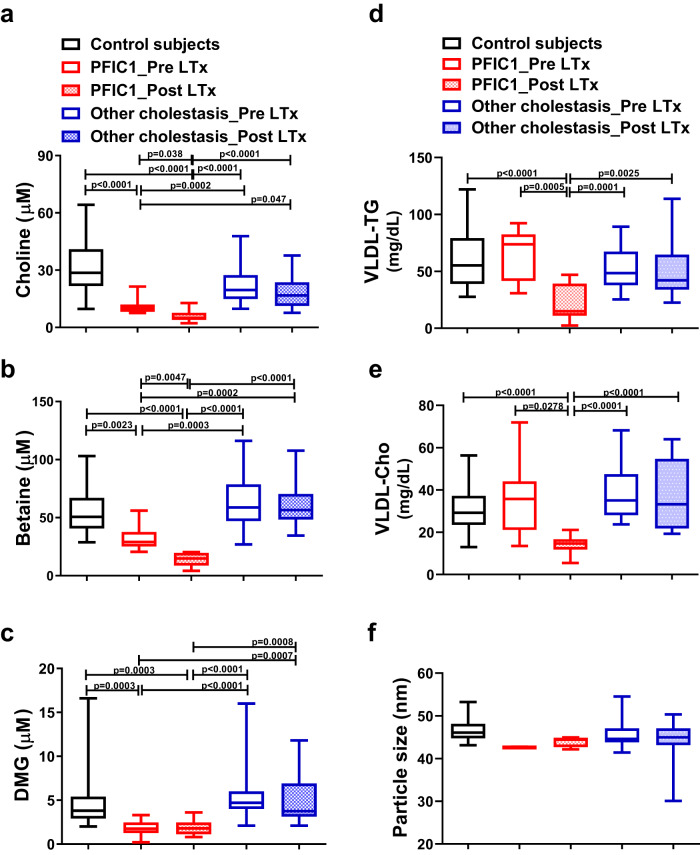
Choline is an essential nutrient, and its deficiency causes steatohepatitis. Dietary phosphatidylcholine (PC) is digested into lysoPC (LPC), glycerophosphocholine, and choline in the intestinal lumen and is the primary source of systemic choline. However, the major PC metabolites absorbed in the intestinal tract remain unidentified. ATP8B1 is a P4-ATPase phospholipid flippase expressed in the apical membrane of the epithelium. Here, we use intestinal epithelial cell (IEC)-specific Atp8b1-knockout (Atp8b1IEC-KO) mice. These mice progress to steatohepatitis by 4 weeks. Metabolomic analysis and cell-based assays show that loss of Atp8b1 in IEC causes LPC malabsorption and thereby hepatic choline deficiency. Feeding choline-supplemented diets to lactating mice achieves complete recovery from steatohepatitis in Atp8b1IEC-KO mice. Analysis of samples from pediatric patients with ATP8B1 deficiency suggests its translational potential. This study indicates that Atp8b1 regulates hepatic choline levels through intestinal LPC absorption, encouraging the evaluation of choline supplementation therapy for steatohepatitis caused by ATP8B1 dysfunction.


Conflict of interest statement

H.H., Y.S. and R.T. are coinventors on a patent (PCT/JP2022/44650) on therapy with choline metabolites for diseases caused by ATP8B1 dysfunction. The other authors declare no competing interests.

Figures

Fig. 1
Fig. 1. Atp8b1IEC-KO mice (line #12) show a high infant mortality rate, growth retardation, and elongation of the SI.
a Atp8b1 mRNA levels in IEC and liver from male 4-week-old Atp8b1IEC-KO mice (line #12) (n = 12) and littermate Atp8b1flox/flox mice (n = 9). mRNA levels are expressed relative to those of 18 S rRNA. b Survival rate of male Atp8b1IEC-KO mice (line #12) and littermate Atp8b1flox/flox mice (n = 12–13 in each group). ch Gross appearance of the whole body (c) and SI (d), BW (e), SIL to BW (f), SIW to BW (g), and LW to BW (h) in male newborn and 4-week-old Atp8b1IEC-KO mice (line #12) (n = 6 for newborn, n = 10 for 4wks) and littermate Atp8b1flox/flox mice (n = 5 for newborn, n = 10 for 4wks). All data are presented as mean ± SEM. P values were calculated by two-tailed, unpaired Welch’s t test and indicated in the figures if less than 0.05. BW body weight, IEC intestinal epithelial cells, LW liver weight, SIW small intestine weight, SIL small intestine length.
Fig. 2
Fig. 2. Atp8b1IEC-KO mice (line #12) have shortened villi and lower expression of apical membrane protein in SI.
Proximal and distal SI were excised from male Atp8b1IEC-KO mice (line #12) and littermate Atp8b1flox/flox mice at the newborn stage (n = 5) and at 4 weeks old (n = 5) and subjected to histological analysis. a H&E staining of SI section. b Quantification of villus length. Each symbol indicates values of 50 villi from 5 mice in each group. cf IHC staining of apical membrane markers, NHE3 (c), ezrin (d), DPPIV (e), and pERM (f), and proteins localized to basolateral membrane, E-cadherin (c, d) and β-catenin (e, f), in SI section. gl IHC staining of IEC markers, lysozyme (Paneth cells; g), chgA (endocrine cells; h), and muc2 (goblet cells; i), in SI sections. jl Quantification of IEC positive for lysozyme (j), chgA (k), and muc2 (l) per villus. In each mouse, more than 25 villi were evaluated from three images. Each symbol indicates the values of 5 mice/group. In (a, cf, gi), representative images are shown. Scale bars: 100 μm. In (b, jl), all data are presented as mean ± SEM. P values were calculated by two-tailed, unpaired Welch’s t test and indicated in the figures if less than 0.05.
Fig. 3
Fig. 3. Atp8b1IEC-KO mice (line #12) progress to steatohepatitis.
Plasma and liver were collected from male Atp8b1IEC-KO mice (line #12) and littermate Atp8b1flox/flox mice at the newborn stage (n = 5) and at 4 weeks old (n = 6) and subjected to biochemical and histological analyses, respectively. ad Plasma biochemistry; AST (a), ALT (b), T-bil (c), and D-bil (d). e H&E staining of liver section. fi IHC staining of the liver section by antibodies against Plin2 (lipid droplets; f), MPO (neutrophils; g), F4/80 (macrophages; h), and GFAP (quiescent HSC; i). jm Quantification of the area stained with Plin2 (j), MPO (k), F4/80 (l), and GFAP (m). Each symbol indicates values of 20 images/group from 5 mice/group. In (ei), representative images are shown. Scale bars: 100 μm. In (ad, jm), all data are presented as mean ± SEM. P values were calculated by two-tailed, unpaired Welch’s t test and indicated in the figures if less than 0.05.
Fig. 4
Fig. 4. Atp8b1IEC-KO mice (line #12) show LPC accumulation in IEC and deficiency in choline and its related metabolites in plasma and liver.
IEC, plasma, and liver were collected from male 4-week-old Atp8b1IEC-KO mice (line #12) and littermate Atp8b1flox/flox mice (n = 6 in each group) and subjected to metabolomic analysis. a Enrichment plot for LPC in IEC. The result of the lipidomic analysis was evaluated by Kolmogorov–Smirnov (KS) running sum statistic. The magnitude of difference in each lipid content between Atp8b1IEC-KO mice and Atp8b1flox/flox mice was scored as described in Materials and Methods. KS statistics were calculated for LPC and plotted as running sum (top). The middle heatmap and the bottom barcode represent the magnitude of difference in each lipid content and the positions of each LPC species, respectively. b The levels of the indicated LPC species in IEC. c, d The levels of choline and its metabolites in plasma (c) and liver (d). e Schematic diagram illustrating intestinal digestion and absorption of dietary PC, a primary source of choline in the body. CDPC CDP-choline, CM chylomicron, DMG dimethylglycine, GPC glycerophosphocholine, LPC lysophosphatidylcholine, PC phosphatidylcholine, PhoC phosphorylcholine, VLDL very low-density lipoprotein. f Enrichment plot for TG in the liver. The graph was created as described in (a). g Enzymatic determination of total TG in the liver. In (bd, g), all data are presented as mean ± SEM. P values were calculated by two-tailed, unpaired Welch’s t test with the Benjamini–Hochberg correction (d) or by two-tailed, unpaired Welch’s t test (g) and are indicated in the figures if less than 0.05.
Fig. 5
Fig. 5. Atp8b1 has flipping activity to LPC.
ad CHO-K1 cells were transfected with pShuttle-ATP8B1–FLAG or corresponding empty vector and analyzed to evaluate flippase activity to NBD-LPC (a) and NBD-PC (b) and susceptibility to toxicity of LPC (c) and edelfosine (d), a synthetic lipase-resistant LPC analog. e, f Male 8-week-old Atp8b1Tax-iIEC-KO mice (line #12) and littermate Atp8b1flox/flox mice were treated daily with 1 mg Tax intraperitoneally for 4 days. IEC were prepared from these mice and analyzed to evaluate flippase activity to NBD-LPC (e) and NBD-PC (f). As described in Supplementary Materials, for flippase activity measurement (a, b, e, f), the cells incubated with NBD-lipids were washed with 5% fatty acid-free BSA to remove NBD-lipids incorporated into the exoplasmic leaflet of the plasma membrane and then analyzed by FACS. Each bar represents the mean ± SEM of quadruple (a, b), sextuple (c, d), and triplicate (e, f) determinations. Where vertical bars are not shown, the SEM is contained within the limits of the symbol. A representative result of two independent experiments is shown. P values were calculated by two-tailed, unpaired Welch’s t test. EV empty vector. g Lpcat activity in IEC. IEC from 4-week-old Atp8b1IEC-KO mice (line #12) and littermate Atp8b1flox/flox mice (n = 3 in each group) were collected, homogenized to prepare Lpcat fraction, and analyzed to evaluate Lpcat activity. Data are represented as mean ± SEM. P values were calculated by two-tailed, unpaired Welch’s t test and are indicated in the figures if less than 0.05.
Fig. 6
Fig. 6. CSD eliminates steatohepatitis in Atp8b1IEC-KO mice (line #12).
Female mice mated to obtain Atp8b1IEC-KO mice (line #12) were fed a control diet (including 0.1% choline) or 1.0% CSD during lactation. The pups, Atp8b1IEC-KO mice (line #12) and littermate Atp8b1flox/flox mice, were analyzed immediately after weaning (4 weeks old). a Survival rate of Atp8b1IEC-KO mice (line #12) and littermate Atp8b1flox/flox mice (n = 14–16 in each group). be BW (b), SIW to BW (c), SIL to BW (d), and LW to BW (e) of Atp8b1IEC-KO mice (line #12) (n = 10 for control diet, n = 10 for CSD) and littermate Atp8b1flox/flox mice (n = 7 for control diet, n = 18 for CSD). f H&E staining of section from proximal and distal SI of Atp8b1IEC-KO mice (line #12) and littermate Atp8b1flox/flox mice. g Quantification of villus length. Each symbol indicates values of 40 villi from 5 mice in each group. hk Plasma levels of AST (h), ALT (i), T-bil (j), and D-bil (k) of Atp8b1IEC-KO mice (line #12) [n = 12 for control diet, n = 8 for CSD (hj); n = 6 per group (k)] and littermate Atp8b1flox/flox mice [n = 9 per group (hj); n = 6 per group (k)]. l PC levels in liver from Atp8b1IEC-KO mice (line #12) and littermate Atp8b1flox/flox mice (n = 6 in each group). mq HE (m) and IHC (nq) staining of liver section from Atp8b1IEC-KO mice (line #12) and littermate Atp8b1flox/flox mice. Plin2 (lipid droplets; n), MPO (neutrophils; o), F4/80 (macrophages; p), and GFAP (quiescent HSC; q) were stained. ru Quantification of the area stained with Plin2 (r), MPO (s), F4/80 (t), and GFAP (u). Each symbol indicates values of 20 images/group from 5 mice/group. In (f, mq), representative images are shown. Scale bars: 100 μm. In (be, gl, ru), all data are presented as mean ± SEM. P values were calculated by Welch’s one-way ANOVA with a post hoc Dunnett’s T3 test for multiple comparisons and are indicated in the figures if less than 0.05. BW body weight, CSD choline supplemental diet, IEC intestinal epithelial cells, LW liver weight, SIW small intestine weight, SIL small intestine length.
Fig. 7
Fig. 7. PFIC1 patients present with decreased plasma concentrations of choline and its metabolites.
Fasting plasma was collected from PFIC1 patients with (n = 12) or without LTx (n = 10), other cholestatic patients with (n = 20) or without LTx (n = 27), and age-matched control subjects (n = 31). Demographic information of the patients is summarized in Table 2 and Supplementary Tables 2 and 3. ac Plasma concentration of choline (a), betaine (b), and DMG (c). The collected specimens were analyzed to measure choline and its metabolites by LC/MS/MS. df Characterization of plasma VLDL. The collected specimens were analyzed to evaluate the content of TG (d) and cholesterol (e) in VLDL and particle size (f) of VLDL using gel filtration high-performance liquid chromatography. Box-and-whisker plots are provided; the central line denotes the median value, the edges represent the upper and lower quartiles, and the whiskers indicate the minimum and maximum values. P values were calculated by Welch’s one-way ANOVA with a post hoc Dunnett’s T3 test for multiple comparisons and are indicated in the figures if less than 0.05. DMG dimethylglycine.

References

    1. Wallace TC, et al. Choline: the underconsumed and underappreciated essential nutrient. Nutr. Today. 2018;53:240. - PMC - PubMed
    1. Leermakers ETM, et al. Effects of choline on health across the life course: a systematic review. Nutr. Rev. 2015;73:500–522. - PubMed
    1. Yao ZM, Vance DE. Reduction in VLDL, but not HDL, in plasma of rats deficient in choline. Biochem. Cell Biol. 1990;68:552–558. - PubMed
    1. Yao ZM, Vance DE. The active synthesis of phosphatidylcholine is required for very low density lipoprotein secretion from rat hepatocytes. J. Biol. Chem. 1988;263:2998–3004. - PubMed
    1. Wan S, et al. Impaired hepatic phosphatidylcholine synthesis leads to cholestasis in mice challenged with a high-fat diet. Hepatol. Commun. 2019;3:262–276. - PMC - PubMed

Publication types