. 2023 Nov 22;14(1):7600.
doi: 10.1038/s41467-023-43373-1.

Genomic profiling of subcutaneous patient-derived xenografts reveals immune constraints on tumor evolution in childhood solid cancer

Affiliations

Genomic profiling of subcutaneous patient-derived xenografts reveals immune constraints on tumor evolution in childhood solid cancer

Funan He et al. Nat Commun. .

Abstract

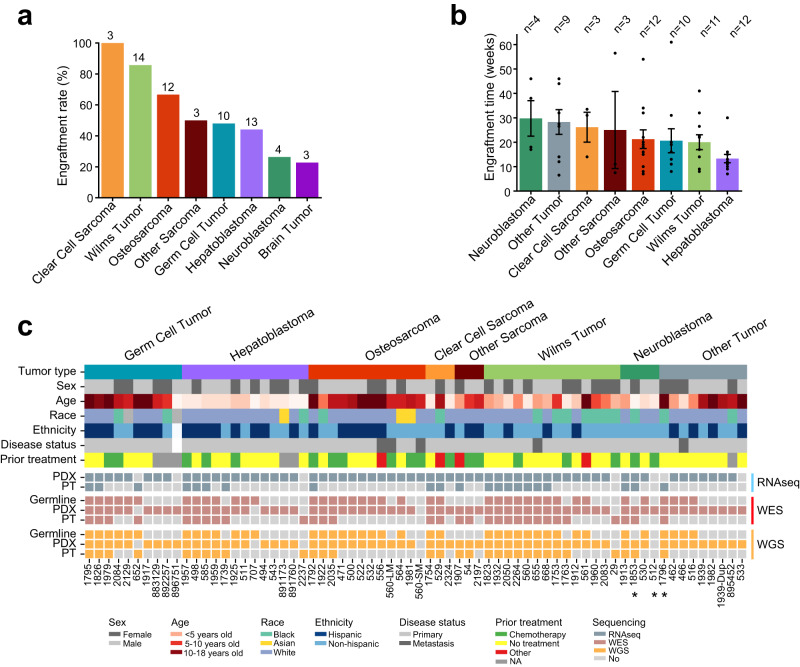
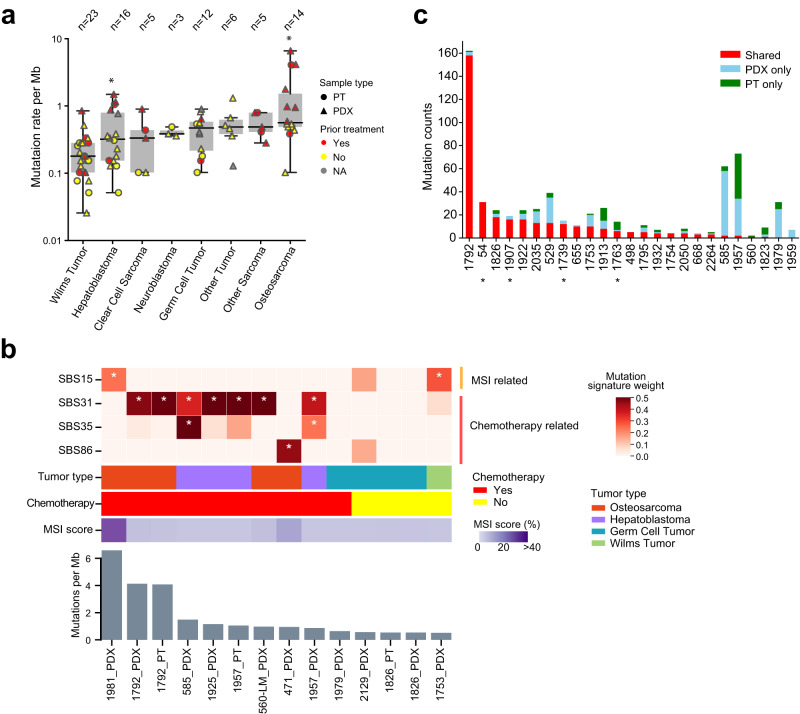
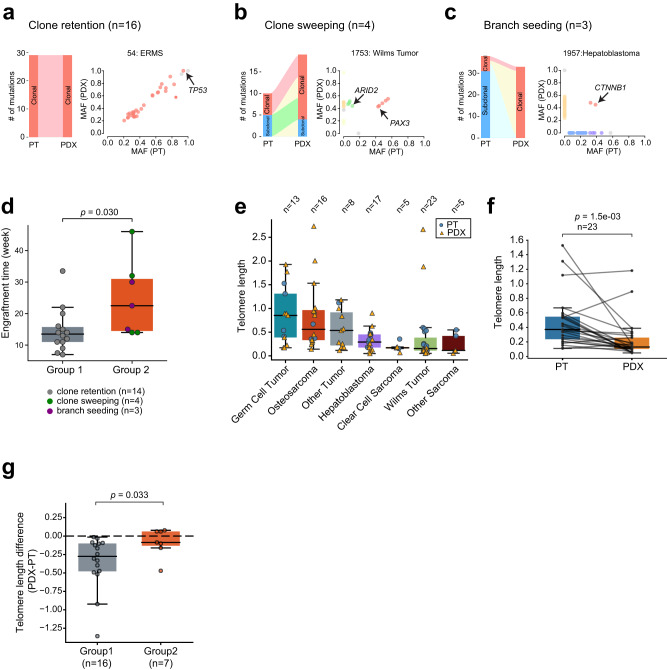
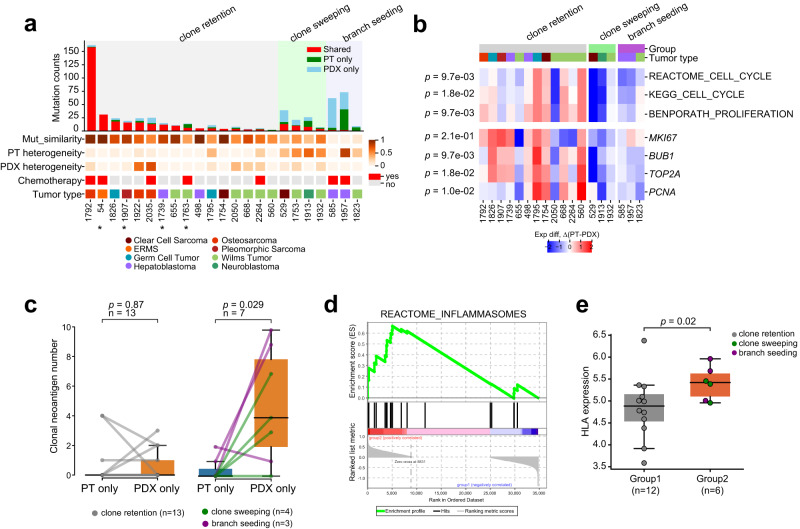
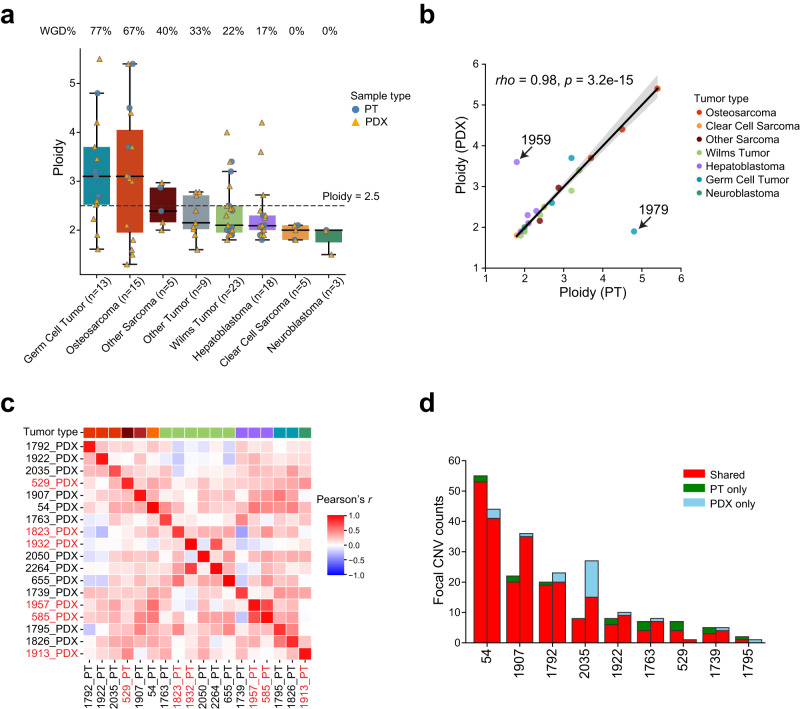
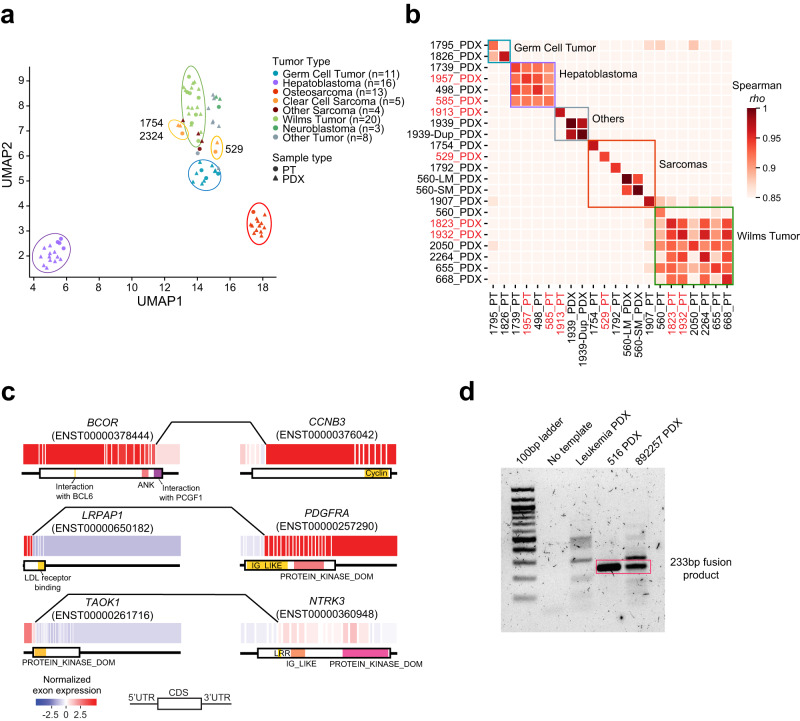
Subcutaneous patient-derived xenografts (PDXs) are an important tool for childhood cancer research. Here, we describe a resource of 68 early passage PDXs established from 65 pediatric solid tumor patients. Through genomic profiling of paired PDXs and patient tumors (PTs), we observe low mutational similarity in about 30% of the PT/PDX pairs. Clonal analysis in these pairs show an aggressive PT minor subclone seeds the major clone in the PDX. We show evidence that this subclone is more immunogenic and is likely suppressed by immune responses in the PT. These results suggest interplay between intratumoral heterogeneity and antitumor immunity may underlie the genetic disparity between PTs and PDXs. We further show that PDXs generally recapitulate PTs in copy number and transcriptomic profiles. Finally, we report a gene fusion LRPAP1-PDGFRA. In summary, we report a childhood cancer PDX resource and our study highlights the role of immune constraints on tumor evolution.


Conflict of interest statement

L.J.K. consults for Alexion Pharmaceuticals without a fee. The other authors declare no competing interests.

Figures

Fig. 1
Fig. 1. Overview of PDXs and sequencing data.
a Engraftment rate across cancer types. The number above each bar indicates the number of PDXs analyzed in this study. b Average engraftment time. The error bar indicates standard error of the mean. c Overview of clinical and molecular data. The top panel shows clinical data including cancer type, stage, sex, age, race, ethnicity, and treatment. The bottom panel summarizes the sequencing data. Samples with an asterisk were removed from data analyses because of high mouse tissue contamination. RNAseq, RNA sequencing; WES, whole exome sequencing; WGS, low pass whole genome sequencing. Source data are provided as a Source data file.
Fig. 2
Fig. 2. Mutation rates and mutational signatures.
a Distribution of somatic mutation rate. Each dot represents a sample (circle, PT; triangle, PDX). The boxes and middle lines within depict the interquartile range (IQR) and median. The top and bottom whiskers represent values within 1.5×IQR of the upper and lower quantiles, respectively. In hepatoblastoma and osteosarcoma, samples with prior treatment show higher mutation rates than samples without (asterisk, p < 0.05, two-sided Wilcox rank sum test). Other tumor types either show no statistical significance (p > 0.05, Wilms tumor and germ cell tumor) or were not compared due to limited sample sizes. b Distribution of MSI and chemotherapy related mutational signatures across samples. The heatmap on top reflects the weight of selected mutation signatures. Clinical data and MSI score are shown below the heatmap. Bar plot at the bottom illustrates mutational load of each sample. Samples are ordered by mutation load. Asterisks indicate weight greater than 0.25. c Mutational similarity between PTs and PDXs. Patients are ordered by the total number of shared mutations. Samples labeled with asterisk do not have the matched germline. Source data are provided as a Source data file.
Fig. 3
Fig. 3. Evolutionary patterns from PTs to PDXs.
a A sample that shows clone retention. Left, sankey plot showing mutation clonality flow from the PT to PDX. The width of the joining lines reflects the number of mutations. Right, scatter plot of tumor mutant allele fraction (MAF) between the PT (x axis) and PDX (y axis). Cancer-related genes are highlighted with arrows. Similarly, b clone sweeping, c branch seeding. d Longer engraftment time for group 2 tumors. Each dot represents one PDX. Y axis represents the time in weeks from initial implantation to harvest. P-value was calculated with two-sided Wilcoxon rank sum test. The box represents the interquartile range (IQR), and middle line represents median. Whiskers represent values within 1.5×IQR of the upper and lower quantiles respectively. e Telomere length across cancer types. Each dot represents one sample. Boxplot is interpreted similarly as above. f Comparison of telomere length between paired PTs and PDXs. The box is interpreted similarly as above. P-value was calculated with paired two-sided Wilcoxon rank sum test. g Longer relative telomere lengths in group 2 PDXs. Y axis represents the difference in telomere length for paired PT and PDX. The dashed line indicates no telomere length difference between PT and PDX. P-value was calculated with two-sided Wilcoxon rank sum test. Boxplot is interpreted similarly as above. Source data are provided as a Source data file.
Fig. 4
Fig. 4. Evolutionary pattern is associated with mutational similarity and antitumor immunity in PT.
a The evolutionary patterns are correlated with genetic heterogeneity of the PT. Patients are ordered by the number of shared mutations between PT and PDX within each pattern. The top bar plot shows mutation overlap for each PT/PDX pair. The bottom panel shows mutational similarity, PT genetic heterogeneity, PDX genetic heterogeneity, chemotherapy, and cancer type. Samples labeled with asterisk do not have the matched germline. b Difference in expression of proliferation markers and cell cycle signatures. Red, higher in PT; Blue, higher in PDX. The signatures were scored with ssGSEA. The p-values on the left were calculated between group 1 and group 2 using two-sided Wilcoxon rank sum test. c Changes in clonal neoantigen count between PTs and PDXs. The left panel shows the changes for group 1 samples, and the right panel shows those for group 2 samples. Each dot represents one sample. P-values were calculated with two-sided paired t test. The box represents the interquartile range (IQR), and middle line represents median. Whiskers represent values within 1.5×IQR of the upper and lower quantiles respectively. d Pathway analysis identifies inflammasome pathway higher in group 2 PTs compared with group 1 PTs (p = 0.03). P-value is reported as is from Gene Set Enrichment Analysis. e HLA genes, which encode MHC complexes on APC surfaces, are highly expressed in group 2 PTs (p = 0.02, one-sided Wilcoxon rank sum test). HLA gene expression is summarized using ssGSEA. The boxplots are interpreted similarly as in panel c. Source data are provided as a Source data file.
Fig. 5
Fig. 5. Conservation of somatic copy number alterations (SCNAs) in PDXs.
a Distribution of tumor ploidy. Tumors with a ploidy higher than 2.5 (dashed line) are considered whole genome doubling (WGD). Each dot represents a sample (circle, PT; triangle, PDX). The boxes and middle lines within represent the interquartile range (IQR) and median. The top and bottom whiskers represent values within 1.5×IQR of the upper and lower quantiles respectively. b Ploidy correlation between PT and PDX. Each dot represents a pair. The correlation coefficient and p-value were calculated with Spearman’s rank correlation test. Black solid line is the linear regression line, and the error band corresponds to 95% confidence interval. The two outliers (1959 and 1979) were excluded from the regression and correlation analyses. c Pairwise correlation in copy number profiles between PTs and PDXs based on 1 Mb windows. The top color bar indicating tumor type is interpreted the same as in (b). Samples labeled in red are from group 2. d Overlaps of focal SCNAs. For each patient, the left bar presents the PT and the right bar represents the PDX. Counts of shared events are different in PT and PDX because of variations in segmentation boundaries. Only the nine PT/PDX pairs where focal SCNAs were found are shown. Source data are provided as a Source Data file.
Fig. 6
Fig. 6. Transcriptomic similarity and gene fusion.
a UMAP visualization for samples with expression data. Each dot represents a sample (circle, PT; triangle, PDX), and the color reflects tumor type. b Expression similarity of paired samples. The correlation coefficient was calculated using Spearman’s correlation. Samples labeled in red are from group 2. c Example gene fusions. Each box represents an exon, and lines connecting the two genes indicate fusion breakpoints. Protein domains are shown below the exon plot. d RT-PCR validation of LRPAP1-PDGFRA fusion transcript. The red rectangle indicates LRPAP1-PDGFRA fusion bands. A leukemia sample was included as negative control. This experiment was repeated twice. Source data are provided as a Source data file.

References

    1. Flores-Toro JA, et al. The childhood cancer data initiative: using the power of data to learn from and improve outcomes for every child and young adult with pediatric cancer. J. Clin. Oncol. 2023;41:4045–4053. doi: 10.1200/JCO.22.02208. - DOI - PMC - PubMed
    1. Ward E, DeSantis C, Robbins A, Kohler B, Jemal A. Childhood and adolescent cancer statistics, 2014. Ca. Cancer J. Clin. 2014;64:83–103. doi: 10.3322/caac.21219. - DOI - PubMed
    1. Hudson MM, et al. Clinical ascertainment of health outcomes among adults treated for childhood cancer. JAMA. 2013;309:2371–2381. doi: 10.1001/jama.2013.6296. - DOI - PMC - PubMed
    1. Yang J, et al. PCAT: an integrated portal for genomic and preclinical testing data of pediatric cancer patient-derived xenograft models. Nucleic Acids Res. 2021;49:D1321–D1327. doi: 10.1093/nar/gkaa698. - DOI - PMC - PubMed
    1. Gao H, et al. High-throughput screening using patient-derived tumor xenografts to predict clinical trial drug response. Nat. Med. 2015;21:1318–1325. doi: 10.1038/nm.3954. - DOI - PubMed

Publication types