. 2023 Nov 21;14(1):7582.
doi: 10.1038/s41467-023-43084-7.

Woven organic crystals

Affiliations

Woven organic crystals

Linfeng Lan et al. Nat Commun. .

Abstract

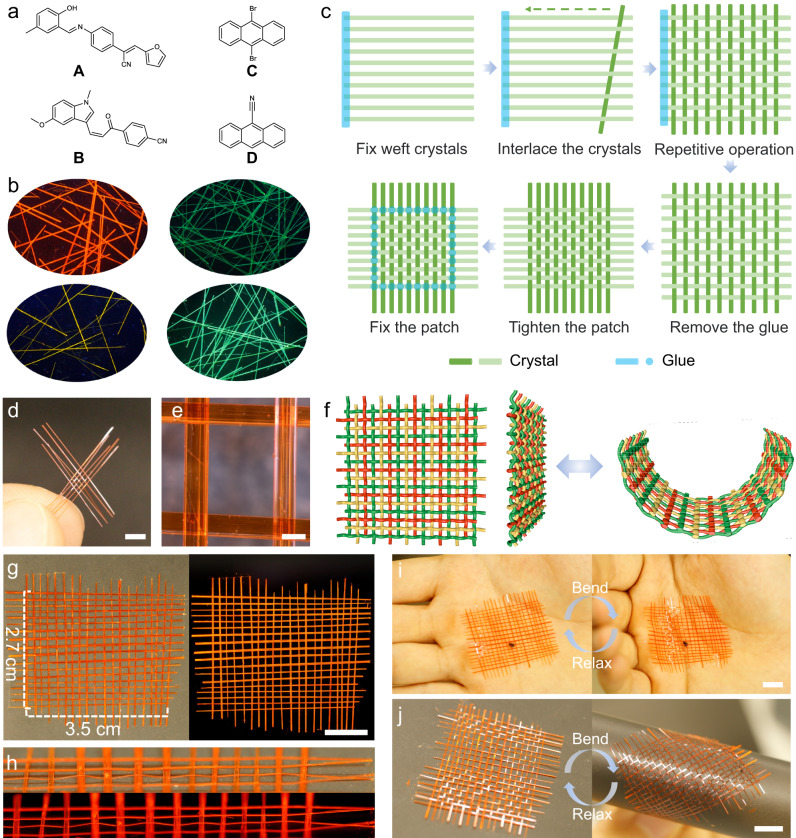
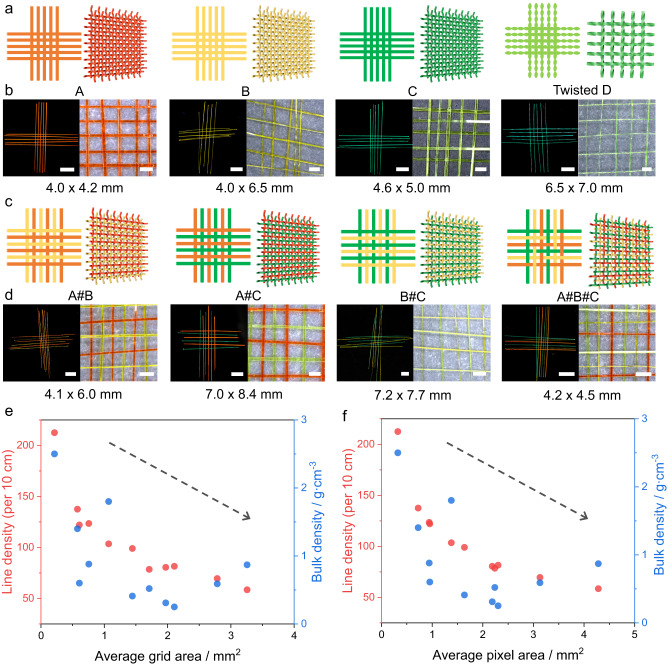
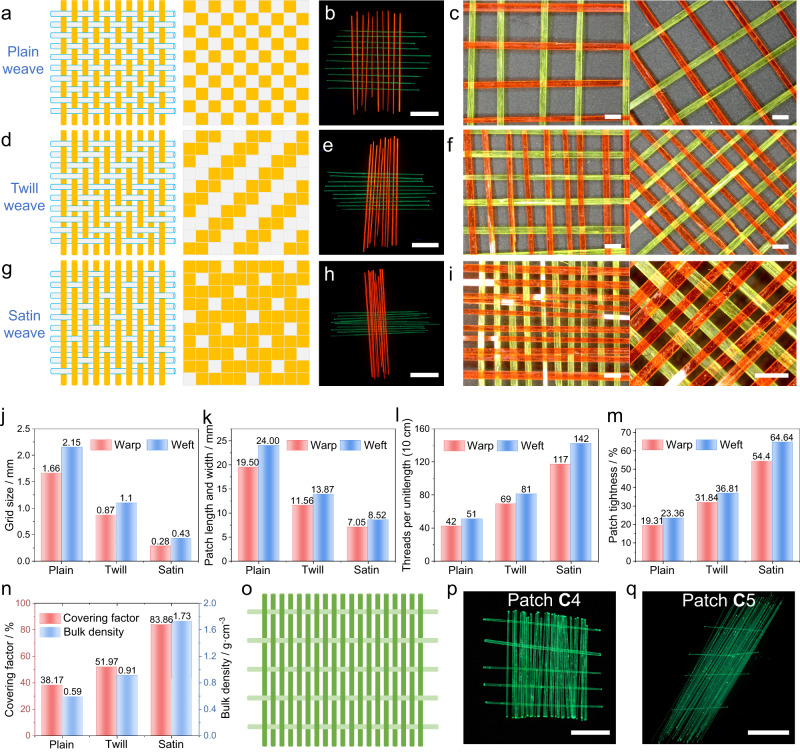
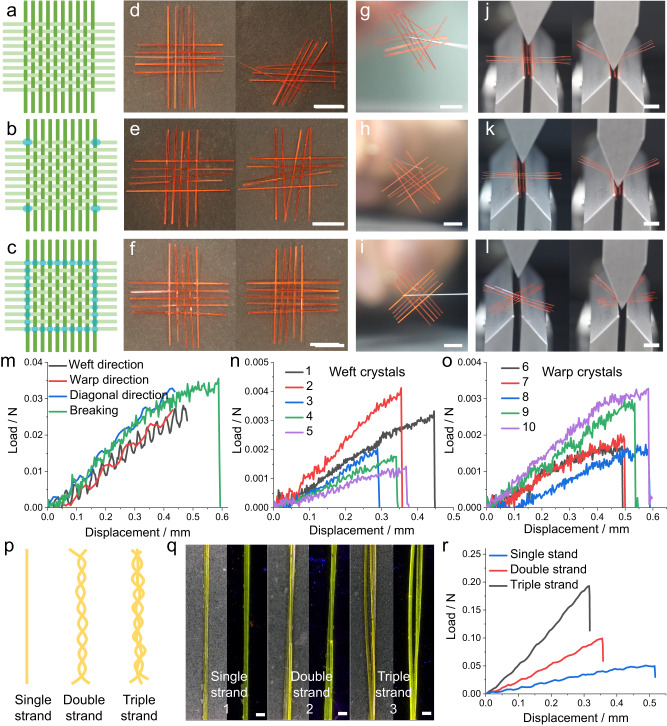
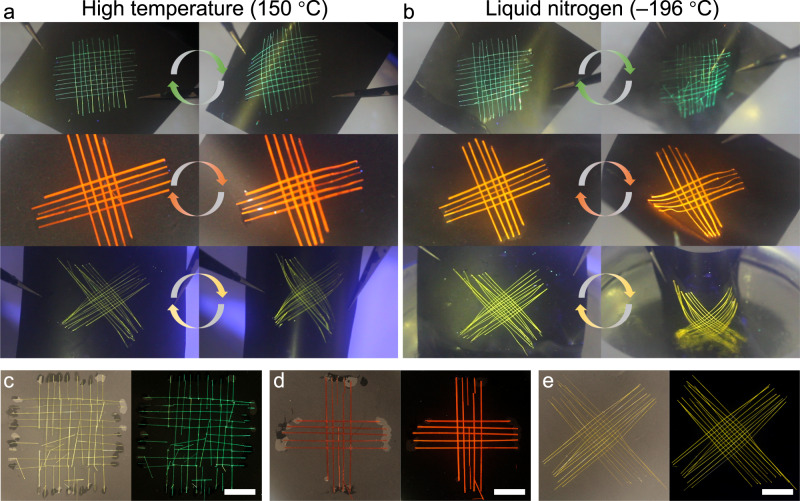
Woven architectures are prepared by physical entanglement of fibrous components to expand one-dimensional material into two-dimensional sheets with enhanced strength and resilience to wear. Here, we capitalize on the elastic properties of long organic crystals with a high aspect ratio to prepare an array of centimeter-size woven network structures. While being robust to mechanical impact, the woven patches are also elastic due to effective stress dissipation by the elasticity of the individual warp and weft crystals. The thermal stability of component crystals translates into favorable thermoelastic properties of the porous woven structures, where the network remains elastic over a range of 300 K. By providing means for physical entanglement of organic crystals, the weaving circumvents the natural limitation of the small size of slender organic crystals that is determined by their natural growth, thereby expanding the prospects for applications of organic crystals from one-dimensional entities to expandable, two-dimensional robust structures.


Conflict of interest statement

The authors declare no competing interests.

Figures

Fig. 1
Fig. 1. Weaving organic crystals.
a Chemical structures of compounds AD used to weave the crystalline patches. b Photographs of crystals of AD recorded under UV light for contrast against a black background. c The method used to weave the crystals. The weft, which is composed of quasiparallel crystals, is set first, followed by interlacing crystals normal to the first set that act as a warp. The weft is then released from the base, the patch is tightened, and the outermost crystals are affixed with glue at the interlacing points to prevent the patch from disassembling. d, e Photographs of a crystalline patch of A (5 × 5) held between fingers (d) and a zoomed image of one cell with a hole in its grid (e). The scale lengths are 2 mm in panel d and 200 μm in panel e. f Schematic showing the curling of the crystalline patches. g A larger woven crystalline patch of A (20 × 18) in daylight (left) and under UV light (right). h Side view of the crystalline patch in daylight (top) and under UV light (bottom). The scale lengths in panels g, i, and j are 1 cm. i, j Bending and unbending of the patch of woven A supported by the palm (i) or by a piece of black paper (j).
Fig. 2
Fig. 2. Variety of woven crystals and basic characterization of the crystalline patches.
a, c Two (left) and three (right) dimensional schematics of crystalline patches (5 × 5 or 6 × 6) including those made of crystals A, B, C, D (twisted), A#B, A#C, B#C, and A#B#C. The orange red, yellow, green, and cyan lines represent crystals of A, B, C, and D, respectively. b, d Fluorescence (b) and magnified optical (d) photographs of patches A, B, C, D (twisted), A#B, A#C, B#C, and A#B#C. The scale length in panels b and d is 5 mm under daily light (left) and 1 mm under 365 UV light (right). e Scatter plots of average grid areas (x-axis) and line density and bulk density (y-axis). f Scatter plots of average pixel areas (x-axis) and line density and bulk density (y-axis). The black dotted line shows the trend.
Fig. 3
Fig. 3. A variety of crystalline weaving patterns.
a, d, g Schematic illustration of plain (a), twill (d), and satin (g) woven crystalline topologies. Yellow and gray (blue border) are used to show the difference between the topologies. Structural diagrams are shown on the left, organizational diagrams are on the right. b, e, h Fluorescence images of the corresponding crystalline patches (10 × 10), having a plain (b), twill (e), and stain (h) pattern. c, f, i Magnified photographs of the plain (c), twill (f), and stain (i) crystalline patches. jn Comparison of different fabric parameters of plain, twill, and satin crystalline patches: average grid size (j), patch length and width (k), threads per unit length (l), patch tightness (m), coverage factor and bulk density (n). o Schematic of a crystalline patch having very disparate warp and weft densities. The green and light green lines represent the warp and weft crystals. p, q Fluorescence images of crystalline patches C4 and C5. The scale length in panels p, e, h, p, and q is 1 cm, and in panels c, f and i is 1 mm.
Fig. 4
Fig. 4. Mechanical profile of the woven crystalline patches.
ac Schematic of different forms of fixed crystal patch, including unfixed (a), fixed at four nodal corners (b), and fixed at multiple points along the perimeter (c). The green and light green lines represent the warp and weft crystals, and the blue dots represent the glue. di Photographs of different crystalline patches of A (5 × 5) before (left) and after (right) being swung violently (df), and then suspended in air (gi). jl Photographs of the three-point bending test of crystalline patch A2. Pressure is applied in the weft (j), warp (k), and diagonal directions (l). mo Load-displacement curves obtained from the three-point bending test of crystalline patch A2 (m) and the corresponding five weft crystals (n) and five warp crystals (o). p Schematic representation of single, double, and triple crystalline strands. q Photographs of crystals of B with single, double, and triple strands in daylight (left) and under UV light (right). r Load-displacement curves obtained from the three-point bending test of crystals of B having single, double, and triple strands. The scale length in panels dl is 5 mm, and in the panel q is 100 μm.
Fig. 5
Fig. 5. Mechanical stability of the woven crystals under high and low temperatures.
a, b Bending-recovery process of three different patches at high temperature (a) and in liquid nitrogen (b). The woven crystalline patches were affixed to black paper, and then the paper was bent by applying pressure with tweezers. The arrows represent the straight and curved cycles. ce Photographs of crystalline patches of C (c), A (d), and B (e) after alternate multiple bending at room temperature and low temperature recorded under daily light (left) and under UV light (right). Most of the crystals of patch C (10 × 10) were broken, patch A (5 × 5) was partially damaged, while patch B (10 × 10) remained intact. The scale length in panels ce is 1 cm.
Fig. 6
Fig. 6. Optical transmission through heterogenous woven crystalline patches.
a, g Fluorescence images of crystalline patches A#C (a) and A#B#C (g). b, h Schematic of the optical waveguide arrays based on A#C (b) and A#B#C (h). The orange-red, yellow and green lines represent crystals A, B, and C, respectively. The green highlight indicates the optical waveguide signal output. The blue arrow represents excitation by a 355 nm laser, and the red dashed arrow indicates the direction of light transmission. c, i Schematic of the output signals of optical waveguide arrays based on A#C (c) and A#B#C (i). The four-part division of the square represents the output signal in the four directions (L, U, R, and D). The different colors represent the fluorescence emission of the output signal. The patches’ cross-nodes are designated by numbers 1‒36. d, j Crystalline patches A#C (d) and A#B#C (j) were excited with a 355 nm laser focused at different positions from left to right along the diagonal direction. The scale length in panels a, d, g, and j is 2 mm. e, f Emission spectra collected at the four ends of the patch A#C at various excitation positions (along the diagonal direction (e) and from left to right (f)). k, l Emission spectra collected at the four ends of A#B#C and at various excitation positions (along the diagonal direction (k) and from top to bottom (l)).
Fig. 7
Fig. 7. Optically transmissive networks based on woven emissive crystalline patches.
a, d Illustration of the dependence of the emissive output from crystals A (a) and C (d) excited at 355 nm (blue arrow), 654 nm (red arrow), as well as at 355 and 654 nm. Different color highlights indicate signals in active or passive optical waveguides of different crystals. b, e Photographs of actual crystals of A (b) and C (e) excited with lasers of different wavelengths. The images correspond to the schemes in panels a and d. c, f Spectra collected at the tip or middle of crystals A (c) and C (f) excited with lasers of different wavelengths. g, i, k Fluorescence images of crystalline patches used as “optically transmissive networks” composed of crystals of C (mode-1, g), A and C with all warp crystals of A and all weft crystals of C (mode-2) (i), and A and C with alternating crystals of each kind (mode-3) (k). h, j Patches of mode-1 (h) and mode-2 (j) excited with lasers of different wavelengths (from left to right, the excitation is 355 nm, 654 nm, and 355/654 nm). The insets show a color-coded representation of the output signal in four directions (‘1’ for green, ‘0’ for red, and ‘2’ for yellow light). l Schematic of mode-3 based on the patch shown in panel k. The orange red and green lines represent crystals A and B, and the numbers are ordinal numbers of the nine nodes. m A schematic of logical operation based on mode-3. The triangles represent the output signal in the four directions, left (L), up (U), right (R), and down (D). The different colors and numbers represent the type of output signals. The scale length in panel b is 2 mm, and in panels gk it is 4 mm.

References

    1. Adanur, S. Handbook of Weaving (Lancaster, PA, 2001).
    1. Becker, J. Pattern and Loom: A Practical Study of the Development of Weaving Techniques in China, Western Asia and Europe (NIAS Press, 2014).
    1. Ray, S. C. Fundamentals and Advances in Knitting Technology (CRC Press, 2012).
    1. Misnon MI, Islam MM, Epaarachchi JA, Lau K. Potentiality of utilising natural textile materials for engineering composites applications. Mater. Design. 2014;59:359–368. doi: 10.1016/j.matdes.2014.03.022. - DOI
    1. Turney, J. The Culture of Knitting (Berg, 2009).