. 2023 Nov 21;13(1):20390.
doi: 10.1038/s41598-023-47646-z.

Hepatocyte integrity depends on c-Jun-controlled proliferation in Schistosoma mansoni infected mice

Affiliations

Hepatocyte integrity depends on c-Jun-controlled proliferation in Schistosoma mansoni infected mice

Lukas Härle et al. Sci Rep. .

Abstract

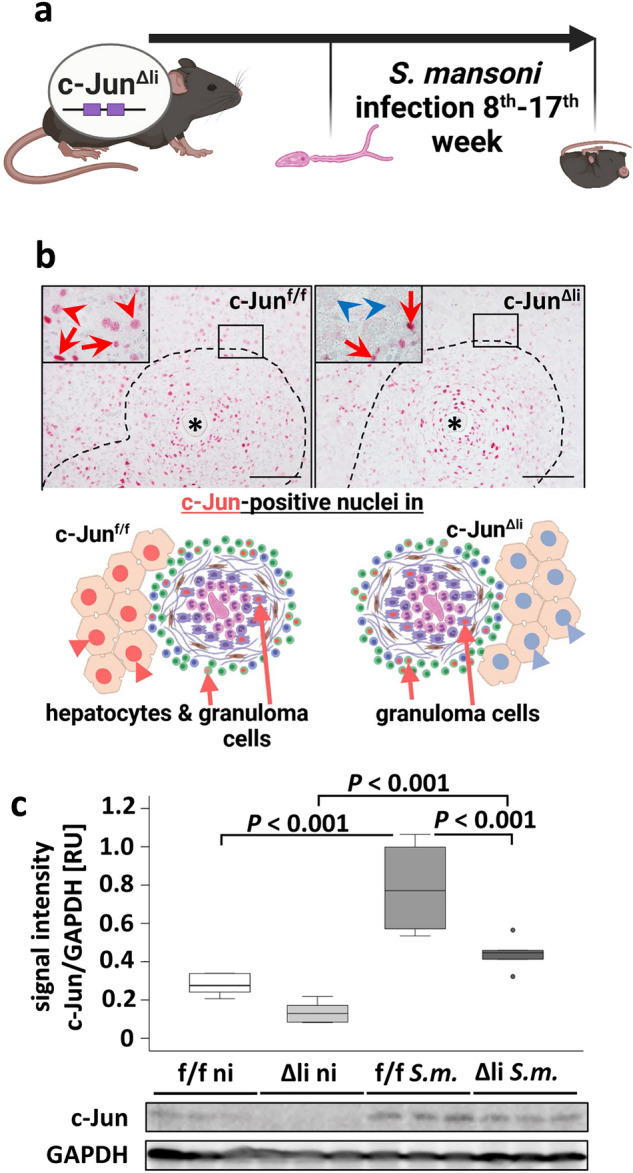
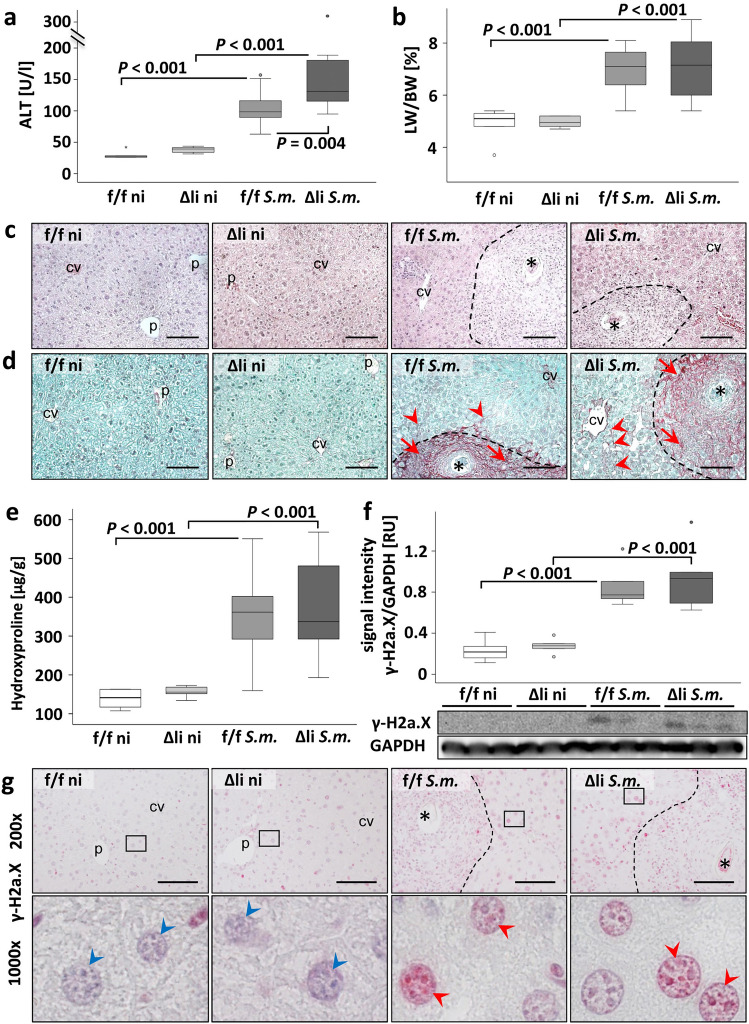
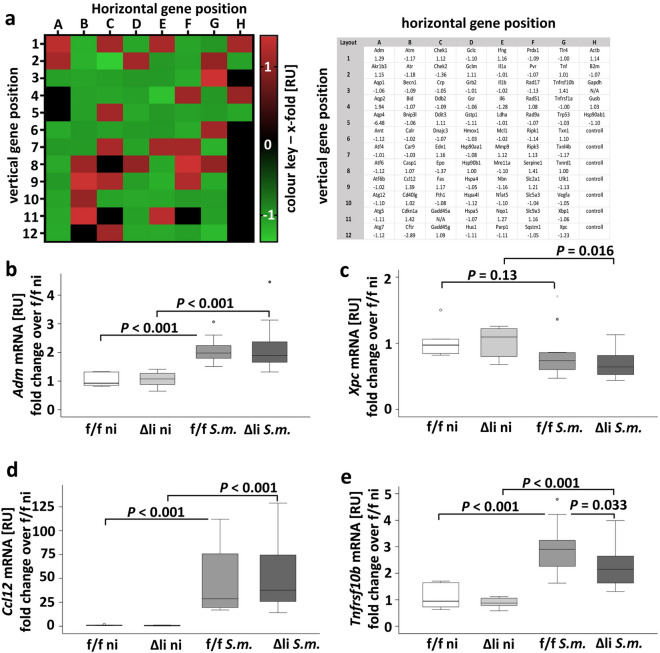
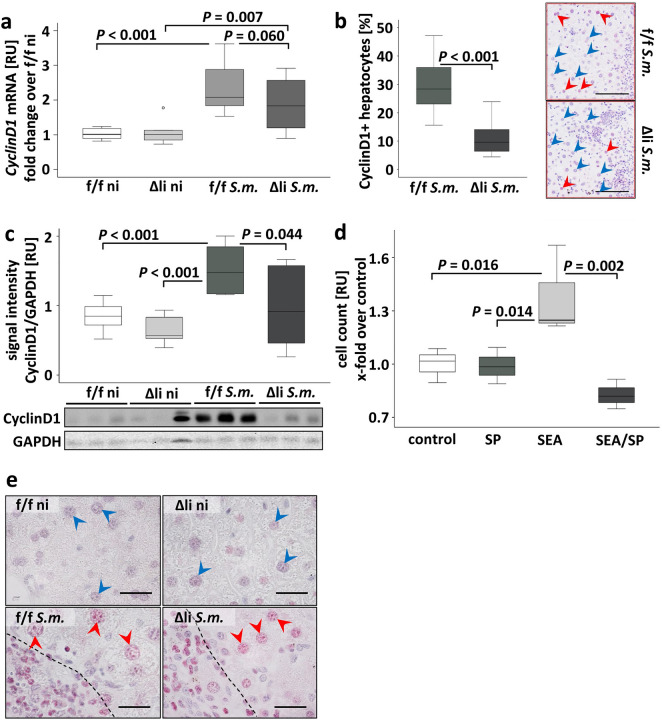
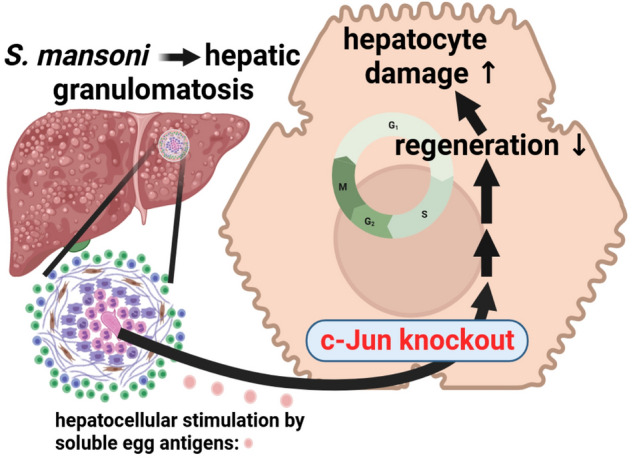
Schistosomiasis is a parasitic disease affecting more than 250 million people worldwide. The transcription factor c-Jun, which is induced in S. mansoni infection-associated liver disease, can promote hepatocyte survival but can also trigger hepatocellular carcinogenesis. We aimed to analyze the hepatic role of c-Jun following S. mansoni infection. We adopted a hepatocyte-specific c-Jun knockout mouse model (Alb-Cre/c-Jun loxP) and analyzed liver tissue and serum samples by quantitative real-time PCR array, western blotting, immunohistochemistry, hydroxyproline quantification, and functional analyses. Hepatocyte-specific c-Jun knockout (c-JunΔli) was confirmed by immunohistochemistry and western blotting. Infection with S. mansoni induced elevated aminotransferase-serum levels in c-JunΔli mice. Of note, hepatic Cyclin D1 expression was induced in infected c-Junf/f control mice but to a lower extent in c-JunΔli mice. S. mansoni soluble egg antigen-induced proliferation in a human hepatoma cell line was diminished by inhibition of c-Jun signaling. Markers for apoptosis, oxidative stress, ER stress, inflammation, autophagy, DNA-damage, and fibrosis were not altered in S. mansoni infected c-JunΔli mice compared to infected c-Junf/f controls. Enhanced liver damage in c-JunΔli mice suggested a protective role of c-Jun. A reduced Cyclin D1 expression and reduced hepatic regeneration could be the reason. In addition, it seems likely that the trends in pathological changes in c-JunΔli mice cumulatively led to a loss of the protective potential being responsible for the increased hepatocyte damage and loss of regenerative ability.


Conflict of interest statement

The authors declare no competing interests.

Figures

Figure 1
Figure 1
Functional characterization of c-Jun signaling in c-JunΔli mice infected with the parasite S. mansoni. (A) Schematic illustration of the animal experiment. (B) Immunohistochemical staining of c-Jun demonstrated a successful hepatocyte-specific knockout. Red arrowheads depict c-Jun-positive perigranulomatous hepatocyte nuclei in S. mansoni-infected c-Junf/f control mice, blue arrowheads: c-Jun-negative perigranulomatous hepatocyte nuclei in S. mansoni-infected c-JunΔli-mice, red arrows: c-Jun-positive nuclei of non-parenchyma cells, *: S. mansoni egg, dashed line indicates granuloma; scale bars 100 μm, magnification x 200. Please note the schematic illustration of the major histologic outcome of the hepatocyte specific knockout of c-Jun below representative micrographs. The microphotographs of the immunostainings of Fig. 1B are presented in enlarged form in SFig. 1. (C) Western blot analysis and subsequent densitometric assessment showed enhanced expression of c-Jun in infected animals (S.m.) compared to non-infected controls (ni) and enhanced expression of c-Jun in infected c-Junf/f animals (f/f S.m.) compared to infected c-JunΔli animals (Δli S.m.). n = 6 and 3 technical replicates. The indicated p values were calculated by ANOVA and post hoc pairwise comparison of groups using Fisher’s LSD on log transformed data. Schematic illustrations were created with BioRender.com.
Figure 2
Figure 2
Serum markers for liver damage were enhanced in S. mansoni-infected c-JunΔli mice. (A) ALT concentration was elevated in infected animals and ALT levels were even higher in infected c-JunΔli animals compared to infected c- Junf/f animals. n = 6 f./f ni, n = 6 Δli ni, n = 10 f./f S.m., n = 12 Δli S.m., including 2 technical replicates each. (B) Liver weight/ body weight ratio was elevated in infected animals. n = 6 f./f ni, n = 6 Δli ni, n = 11 f./f S.m., n = 12 Δli S.m. (C) H.E.-staining visualized hepatic granuloma formation induced by the S. mansoni eggs. No differences between the infected animals were detected (enlarged microphotographs depicted in SFig. 3). (D) Sirius-red staining visualized granulomatous fibrosis (red arrows), and sinusoidal (red arrowheads) fibrosis (for details please refer to enlarged microphotographs depicted in SFig. 5). We detected no differences in histopathologic appearance of fibrosis between the infected animals. S. mansoni eggs (*). cv central vein, p portal tract, 200 x, bar 100 µm, dashed lines indicate granuloma. (E) Hydroxyproline quantification indicated enhanced fibrosis in the liver of infected animals but no quantitative differences in hepatic amounts of fibrillary collagen between the two infected groups. (F) Western blot analysis of γ-H2a.X and subsequent assessment of optical density of the signals depicted an elevation of the marker for DNA double-strand breaks in the infected groups compared to non-infected animals but showed no difference between the infected animals. n = 6 and 3 technical replicates each. (G) Immunohistochemical staining of γ-H2a.X visualized an elevated amount of γ-H2a.X in nuclei of hepatocytes of infected animals. Lower panels show the indicated areas with higher magnification. Enlarged microphotographs are shown in SFig. 6. Red arrowheads point to γ-H2a.X positive nuclei of hepatocytes, blue arrowheads indicate γ-H2a.X-negative nuclei of hepatocytes. 200 x, scale bars 100 µm. The indicated p values were calculated by ANOVA and post hoc pairwise comparison of groups using Fisher’s LSD on log transformed data.
Figure 3
Figure 3
qPCR array and subsequent RT-qPCR validation of marker genes for hepatocellular stress and toxicity. (A) 84 genes related to stress and toxicity were analyzed by a qPCR array. The signal for each gene was normalized with housekeeping genes, and respective x-fold values from infected c Junf/f and infected c-JunΔli animals were used to draw the heat map. Reddish tone indicates an induction while green shades depict downregulated genes as indicated by the colour key on the right of the heatmap. Ct-values above 30 are displayed as black panels in the heat-map. Gene names on positions A1-H12 and their specific regulation are presented in the table on the right side of (A). (BE) Genes regulated above 1.2-fold in the array were validated by RT-qPCR. (B, D, E) Adm, Ccl12 and Tnfrsf10b were induced in infected animals. Please note the reduction of Tnfrsf10b and Xpc in Δli S.m. (C) n = 6 f./f ni, n = 6 Δli ni, n = 11 f./f S.m., n = 12 Δli S.m., 3 technical replicates. The indicated p values were calculated by ANOVA and post hoc pairwise comparison of groups using Fisher’s LSD on log transformed data.
Figure 4
Figure 4
Hepatic inflammation was induced by S. mansoni infection and equally regulated in groups of infected c-Junf/f and infected c-JunΔli animals. (AD) RT-qPCR demonstrated the induction of Il-1β, Il-4, Il-6, and Il-10, in infected animals compared to non-infected animals, but no differences among infected or ni animals. n = 6 f./f ni, n = 6 Δli ni, n = 11 f./f S.m., n = 12 Δli S.m.; 3 technical replicates each. (E) Western blot analysis and subsequent assessment of optical density of the signals depicted elevated expression for CD45, a marker for leukocytes, in infected animals compared to non-infected animals. n = 6 and 3 technical replicates each. (F) CD45 staining demonstrated CD45-positive granulomatous cells and CD45-positive cells within the parenchyma (red arrows, enlarged in SFig. 11). Both analyses of CD45 expression showed a comparable expression pattern of CD45 in infected c-JunΔli and infected c-Junf/f mice. Magnification 1000 × , bars 100 µm, dashed line granuloma. The indicated p values were calculated by ANOVA and post hoc pairwise comparison of groups using Fisher’s LSD on log transformed data.
Figure 5
Figure 5
S. mansoni soluble egg antigen induced proliferation of hepatocytes was diminished by inhibition or knockout of c-Jun. (A) Cyclin-D1 was induced upon S. mansoni infection in comparison to non-infected animals. A tendency of a lower expression of Cyclin D1 was evident in Δli S.m. compared to f/f S.m.. n = 6 f./f ni, n = 6 Δli ni, n = 11 f./f S.m., n = 12 Δli S.m.; 3 technical replicates. (B) The relative number of Cyclin D1-positive perigranulomatous hepatocyte nuclei was lower in S. mansoni-infected Δli S.m. mice. Representative microphotographs of immunostained liver slices are shown. Hepatocyte nuclei in three randomly chosen areas per mouse adjacent to granuloma were counted (red arrowheads Cyclin D1-positive hepatocyte nuclei, blue arrowheads Cyclin D1 negative hepatocyte nuclei; microphotographs enlarged in SFig. 14). (C) Western blot analysis and subsequent assessment of optical density of the signals demonstrated an induction of hepatic Cyclin D1 upon S. mansoni infection. This effect was normalized in Δli S.m. compared to f/f S.m. (n = 6 and 3 technical replicates each). (D) Proliferation of human hepatoma cells increased by S. mansoni soluble egg antigen (SEA) treatment and remained at basal levels by the addition of JNK inhibitor SP600125. Data were normalized to the control group. These experiments were performed three times independently. Levels of significance are indicated in the figure. (E) Ki67 immunostaining demonstrated proliferating hepatocytes upon infection. Ki67-positive nuclei in perigranulomatous hepatocytes (red arrowheads) and Ki67 negative nuclei in non-infected animals (enlarged microphotographs of the Ki67 immunostainings are depicted in SFig. 15).
Figure 6
Figure 6
Schematic summary of the most important results. The current study underlines the hepatoprotective role of c-Jun in S. mansoni-induced liver damage. Our data suggest that the c-Jun-controlled regenerative hepatocellular potential is involved in cellular protection via c-Jun signaling.

Similar articles

Cited by

References

    1. WHO. Schistosomiasis Fact Sheet, 02_2023; Available from: https://www.who.int/news-room/fact-sheets/detail/schistosomiasis.
    1. McManus DP, Dunne DW, Sacko M, Utzinger J, Vennervald BJ, Zhou X-N. Schistosomiasis. Nat. Rev. Dis. Prim. 2018;4(1):13. doi: 10.1038/s41572-018-0013-8. - DOI - PubMed
    1. Boissier J, Grech-Angelini S, Webster BL, Allienne J-F, Huyse T, Mas-Coma S, et al. Outbreak of urogenital schistosomiasis in Corsica (France): an epidemiological case study. Lancet. Infect. Dis. 2016;16(8):971–979. doi: 10.1016/S1473-3099(16)00175-4. - DOI - PubMed
    1. Lingscheid T, Kurth F, Clerinx J, Marocco S, Trevino B, Schunk M, et al. Schistosomiasis in European travelers and migrants: Analysis of 14 years tropnet surveillance data. Am. J. Trop. Med. Hyg. 2017;97(2):567–574. doi: 10.4269/ajtmh.17-0034. - DOI - PMC - PubMed
    1. Salas-Coronas J, Bargues MD, Lozano-Serrano AB, Artigas P, Martínez-Ortí A, Mas-Coma S, et al. Evidence of autochthonous transmission of urinary schistosomiasis in Almeria (southeast Spain): An outbreak analysis. Travel Med. Infect. Dis. 2021;44:102165. doi: 10.1016/j.tmaid.2021.102165. - DOI - PubMed