. 2023 Nov 21;15(1):112.
doi: 10.1186/s13321-023-00781-1.

On the difficulty of validating molecular generative models realistically: a case study on public and proprietary data

Affiliations

On the difficulty of validating molecular generative models realistically: a case study on public and proprietary data

Koichi Handa et al. J Cheminform. .

Abstract

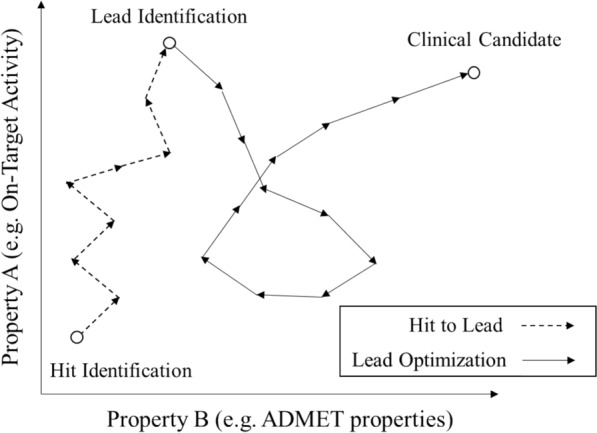
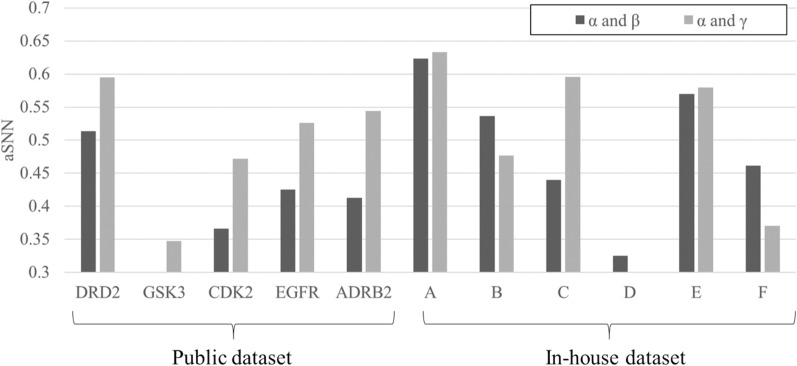
While a multitude of deep generative models have recently emerged there exists no best practice for their practically relevant validation. On the one hand, novel de novo-generated molecules cannot be refuted by retrospective validation (so that this type of validation is biased); but on the other hand prospective validation is expensive and then often biased by the human selection process. In this case study, we frame retrospective validation as the ability to mimic human drug design, by answering the following question: Can a generative model trained on early-stage project compounds generate middle/late-stage compounds de novo? To this end, we used experimental data that contains the elapsed time of a synthetic expansion following hit identification from five public (where the time series was pre-processed to better reflect realistic synthetic expansions) and six in-house project datasets, and used REINVENT as a widely adopted RNN-based generative model. After splitting the dataset and training REINVENT on early-stage compounds, we found that rediscovery of middle/late-stage compounds was much higher in public projects (at 1.60%, 0.64%, and 0.21% of the top 100, 500, and 5000 scored generated compounds) than in in-house projects (where the values were 0.00%, 0.03%, and 0.04%, respectively). Similarly, average single nearest neighbour similarity between early- and middle/late-stage compounds in public projects was higher between active compounds than inactive compounds; however, for in-house projects the converse was true, which makes rediscovery (if so desired) more difficult. We hence show that the generative model recovers very few middle/late-stage compounds from real-world drug discovery projects, highlighting the fundamental difference between purely algorithmic design and drug discovery as a real-world process. Evaluating de novo compound design approaches appears, based on the current study, difficult or even impossible to do retrospectively.Scientific Contribution This contribution hence illustrates aspects of evaluating the performance of generative models in a real-world setting which have not been extensively described previously and which hopefully contribute to their further future development.


Conflict of interest statement

The authors declare no competing interests.

Figures

Fig. 1
Fig. 1
An example of a trajectory of compounds from hit identification to clinical candidate. The white circles and lines (dotted one: hit to lead, and solid one: lead optimization) represent the compound and the trajectory of compound optimization. The X- and Y- axis represent the value of parameters which are better if the values are larger. It can be seen that multiple properties matter in optimization (where in particular the X-axis subsumes a large number of additional properties), and that optimization is usually not linear in practice
Fig. 2
Fig. 2
The datasets used in this study include wide range of activity. The thresholds for activity classes generally are pXC50 values of less than 6 for low, over 6 to less than 7 for middle, over 7 to less than 8 for high, and over 8 for ultra-high compound activity
Fig. 3
Fig. 3
An example of data division according to stages and bioactivities. The region of α that consists of more than middle activity compounds in the stage of early corresponds to the training dataset for fine-tunning to produce focused agent. The region of β consists of low and middle activity compounds in the middle and late stage, and the region of γ consists of more than high activity compounds in the middle and late stage. The X-axis is unitless
Fig. 4
Fig. 4
Workflow of this study (for details see main text). As options, Inception and diversity filter (DF) could be used in the sampling process of (iv).
Fig. 5
Fig. 5
Average of single nearest neighbour similarity (aSNN) between training and test compounds. The aSNN for all projects for low or high activity real compounds were largely different from public and in-house projects. It can be seen that the profiles in Public dataset (aSNN of α-β < α-γ) was different from in-house (mostly, aSNN of α-β > α-γ). The cut-off values of aSNN considered similar was set to be 0.3
Fig. 6
Fig. 6
Rediscovery of compounds was higher for public projects than in-house in the reinforcement learning (RL) setting. For further details see Additional file 6: Table S6
Fig. 7
Fig. 7
Average of single nearest neighbour similarity (aSNN) between generated and middle/late stage’s test compounds. The aSNN between generated compounds from all projects in reinforcement learning (RL) for (a, d) all 5,000 compounds generated, for (b, e) the highest-scored 500 compounds by an in silico classification model, and for the (c, f) highest-scored 100 scored compounds by an in silico classification model to the real compounds in middle (a to c) or late (d to f) stage are shown. From a to c, it can be seen that activity model selection generally increases aSNN, with the magnitude of the effect widely varying across projects, from d to f, generally speaking, values are lower than in a to c (for middle-stage compounds), and hence long-term compound evolution is much more difficult to model than short-term compound evolution. The cut-off values of aSNN considered similar was set to be 0.3
Fig. 8
Fig. 8
Example of DRD2 compounds. For the comparison of real (a) and generated compounds (b: from pre-trained prior model, c: from RL model) by visual inspection. The number after CS is the number of compounds included in the same cluster
Fig. 8
Fig. 8
Example of DRD2 compounds. For the comparison of real (a) and generated compounds (b: from pre-trained prior model, c: from RL model) by visual inspection. The number after CS is the number of compounds included in the same cluster

References

    1. Gómez-Bombarelli R, et al. Automatic chemical design using a data-driven continuous representation of molecules. ACS Cent Sci. 2018;4:268–276. doi: 10.1021/acscentsci.7b00572. - DOI - PMC - PubMed
    1. Thomas M, et al. Applications of artificial intelligence in drug design: opportunities and challenges. Methods Mol Bio. 2022;2390:1–59. doi: 10.1007/978-1-0716-1787-8_1. - DOI - PubMed
    1. Scannell JW, Bosley J. When quality beats quantity: decision theory, drug discovery, and the reproducibility crisis. PLoS ONE. 2016;11:e0147215. doi: 10.1371/journal.pone.0147215. - DOI - PMC - PubMed
    1. Plowright AT, et al. Hypothesis driven drug design: improving quality and effectiveness of the design-make-test-analyse cycle. Drug Discovery Today. 2012;17:56–62. doi: 10.1016/j.drudis.2011.09.012. - DOI - PubMed
    1. Danziger DJ, Dean PM. Automated site-directed drug design: a general algorithm for knowledge acquisition about hydrogen-bonding regions at protein surfaces. Proceed Royal Soc London Series B Bio Sci. 1989;236:101–113. - PubMed

LinkOut - more resources