. 2023 Nov 21;22(1):356.
doi: 10.1186/s12936-023-04760-7.

Comparison of new computational methods for spatial modelling of malaria

Affiliations

Comparison of new computational methods for spatial modelling of malaria

Spencer Wong et al. Malar J. .

Abstract

Background: Geostatistical analysis of health data is increasingly used to model spatial variation in malaria prevalence, burden, and other metrics. Traditional inference methods for geostatistical modelling are notoriously computationally intensive, motivating the development of newer, approximate methods for geostatistical analysis or, more broadly, computational modelling of spatial processes. The appeal of faster methods is particularly great as the size of the region and number of spatial locations being modelled increases.

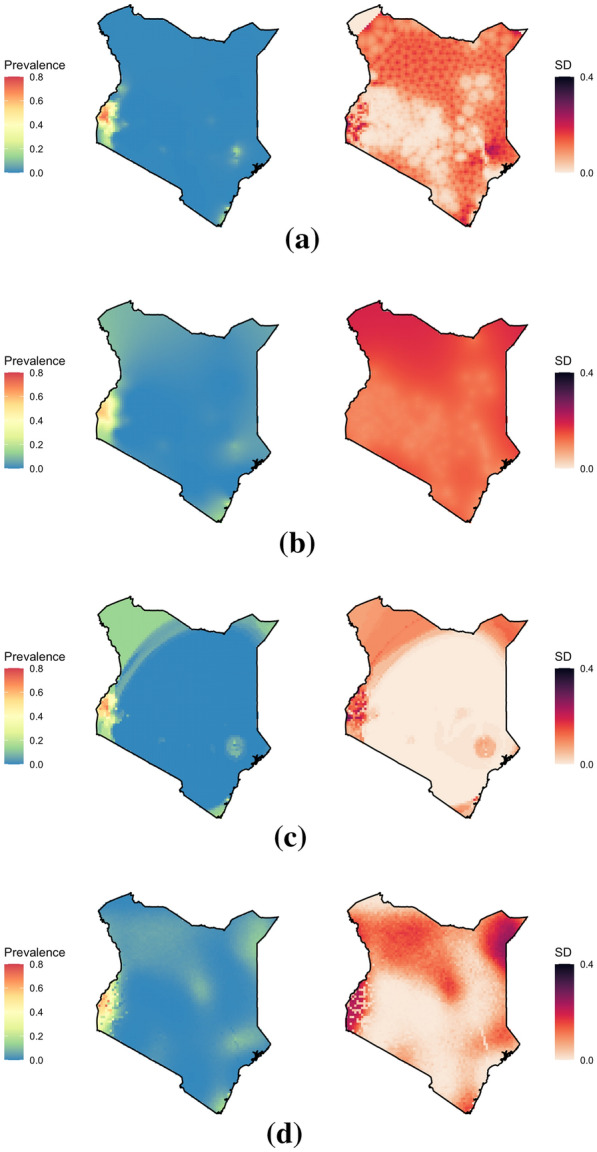
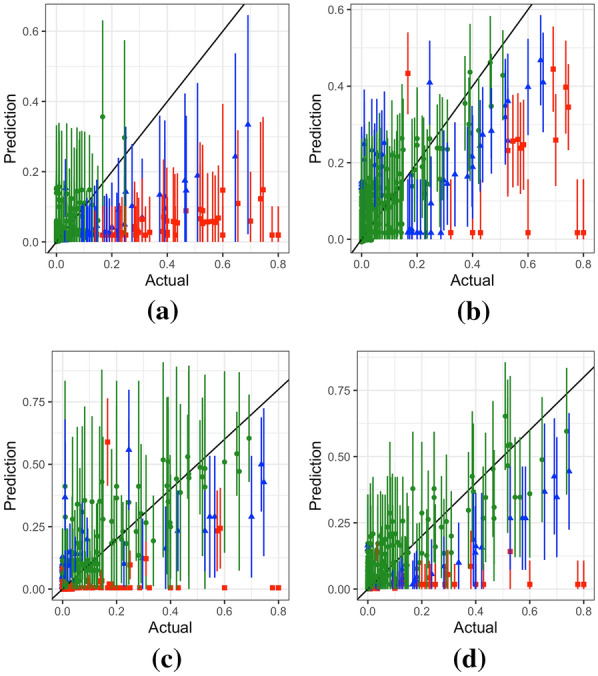
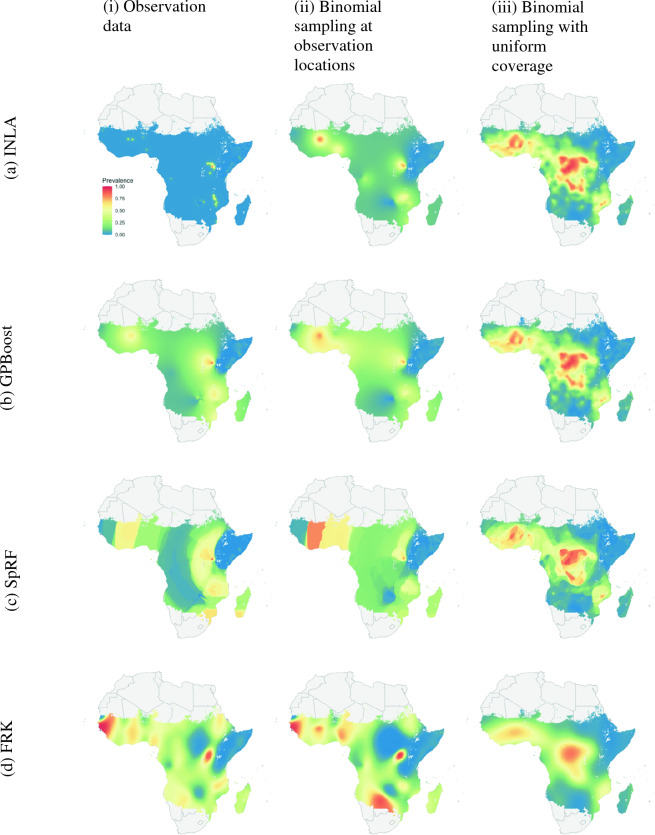
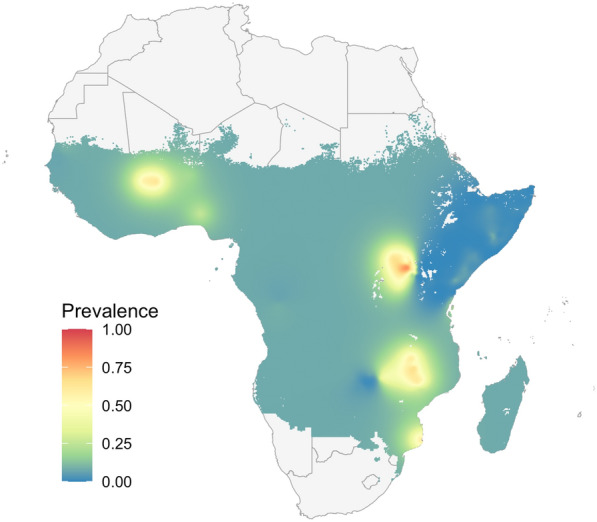
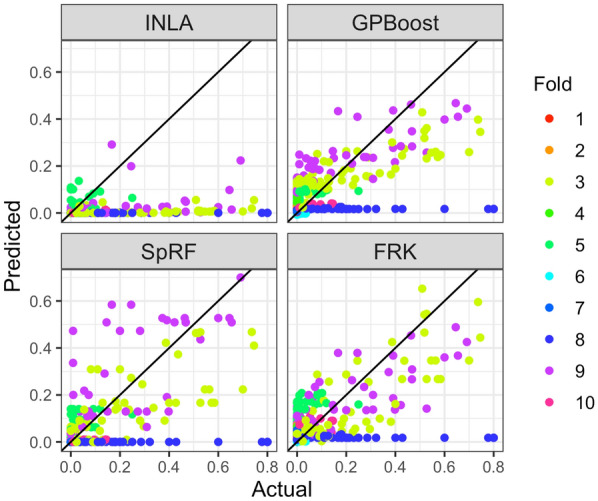
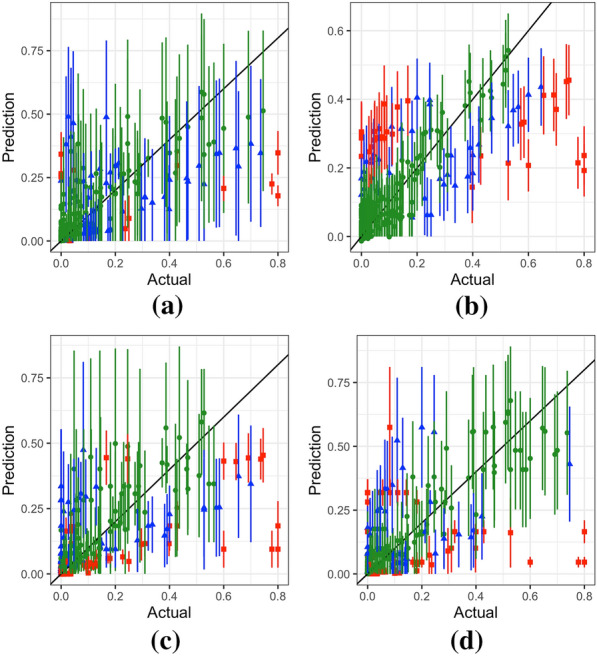
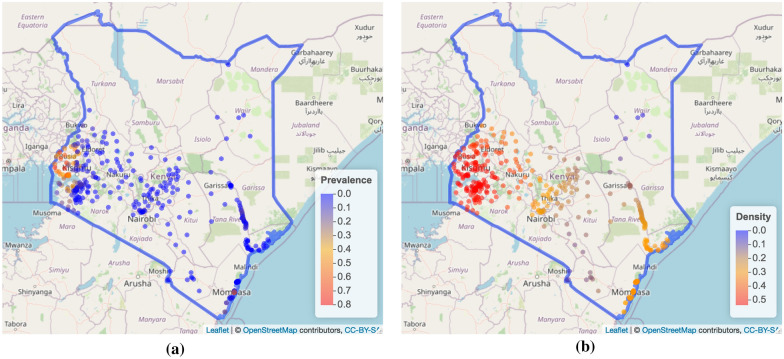
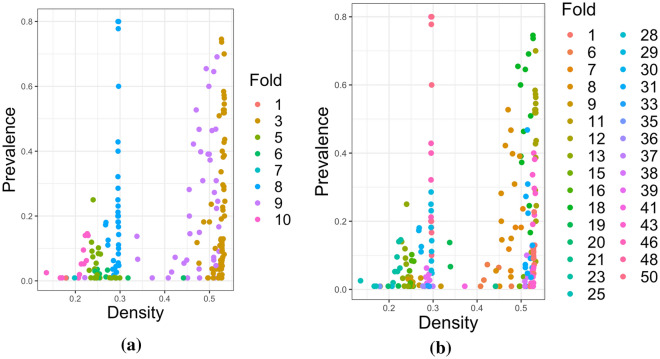
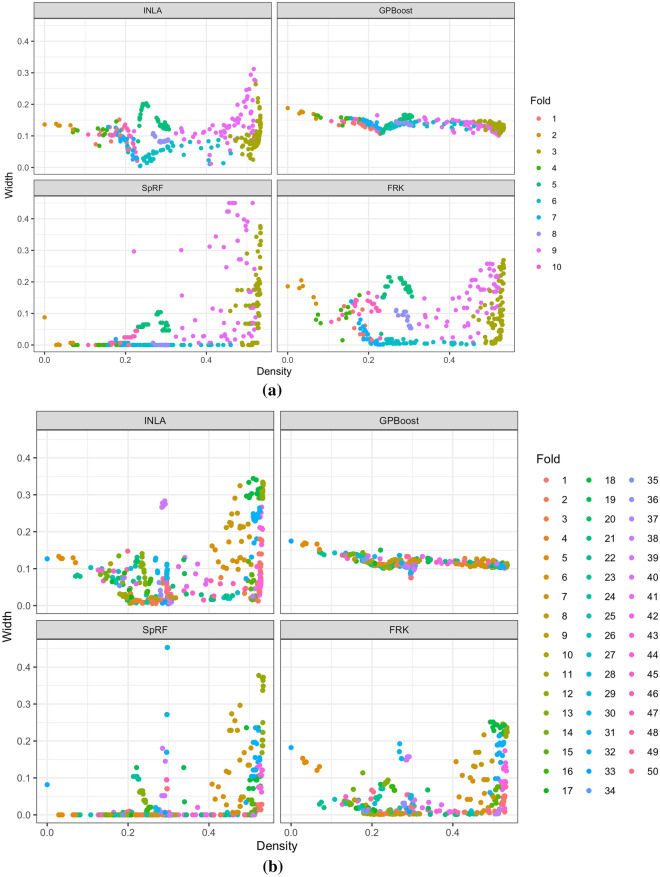
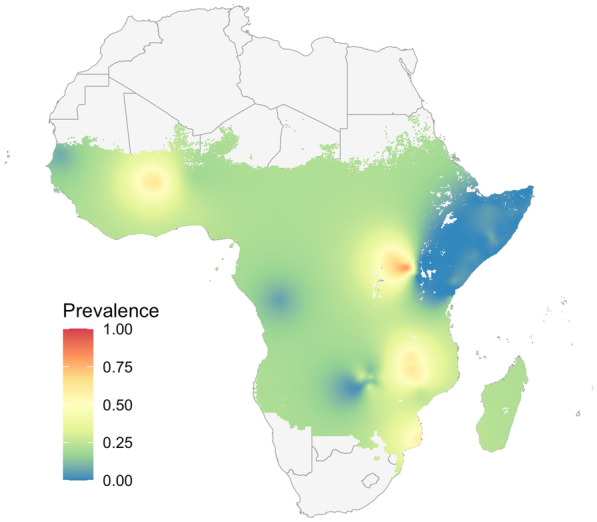
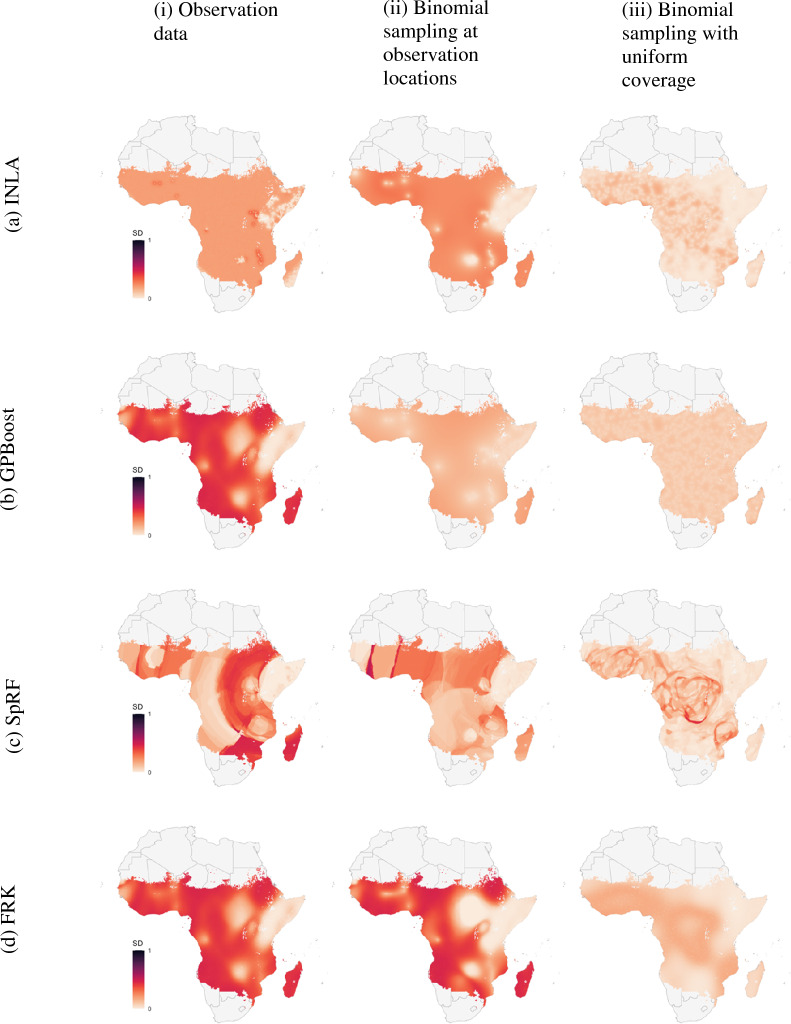
Methods: This work presents an applied comparison of four proposed 'fast' computational methods for spatial modelling and the software provided to implement them-Integrated Nested Laplace Approximation (INLA), tree boosting with Gaussian processes and mixed effect models (GPBoost), Fixed Rank Kriging (FRK) and Spatial Random Forests (SpRF). The four methods are illustrated by estimating malaria prevalence on two different spatial scales-country and continent. The performance of the four methods is compared on these data in terms of accuracy, computation time, and ease of implementation.

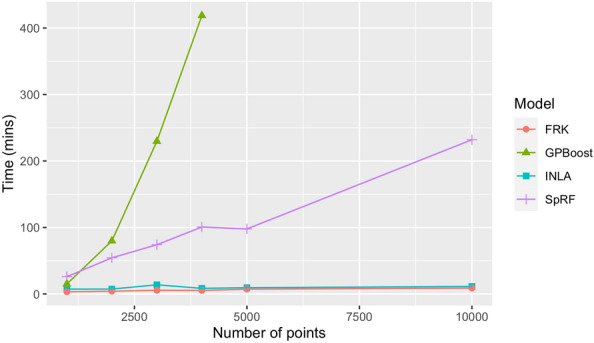
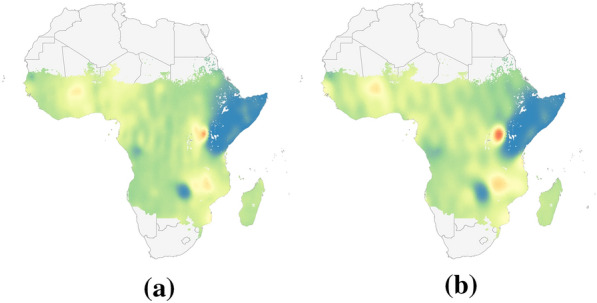
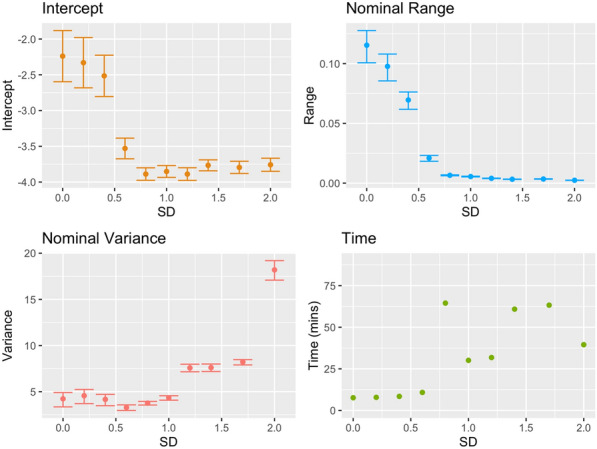
Results: Two of these methods-SpRF and GPBoost-do not scale well as the data size increases, and so are likely to be infeasible for larger-scale analysis problems. The two remaining methods-INLA and FRK-do scale well computationally, however the resulting model fits are very sensitive to the user's modelling assumptions and parameter choices. The binomial observation distribution commonly used for disease prevalence mapping with INLA fails to account for small-scale overdispersion present in the malaria prevalence data, which can lead to poor predictions. Selection of an appropriate alternative such as the Beta-binomial distribution is required to produce a reliable model fit. The small-scale random effect term in FRK overcomes this pitfall, but FRK model estimates are very reliant on providing a sufficient number and appropriate configuration of basis functions. Unfortunately the computation time for FRK increases rapidly with increasing basis resolution.

Conclusions: INLA and FRK both enable scalable geostatistical modelling of malaria prevalence data. However care must be taken when using both methods to assess the fit of the model to data and plausibility of predictions, in order to select appropriate model assumptions and parameters.

Keywords: Geostatistics; Predictive modelling; Risk mapping; Spatial modelling.


Conflict of interest statement

The authors declare that they have no competing interests.

Figures

Fig. 1
Fig. 1
2009 P. falciparum prevalence data in Kenya. a shows prevalence survey results, while b shows the Malaria Atlas Project predicted prevalence
Fig. 2
Fig. 2
P. falciparum prevalence survey locations in Kenya for 2009. Colours represent different cross-validation folds. a and b show 10-fold and 50-fold cross-validation locations respectively
Fig. 3
Fig. 3
P. falciparum prevalence data used to fit the four models at the continental scale. a shows the 2009 observed data at 868 locations. b shows the prevalence generated from binomial samples at the observation locations. c shows the prevalence generated by binomial samples at 1000 uniformly random locations. d is the Malaria Atlas Project predicted prevalence raster from 2009 used to generate the samples in b and c
Fig. 4
Fig. 4
Predicted prevalences and uncertainties for a INLA, b GPBoost, c SpRF, and d FRK when trained on P. falciparum prevalence data from Kenya in 2009. Note that these maps are intended only to illustrate differences in model predictions when fit to a small data sample, and are not likely to accurately represent malaria prevalence across the country in this year
Fig. 5
Fig. 5
Interval predictions for 10-fold cross-validation for a INLA, b GPBoost, c SpRF, and d FRK using the national level Kenya data. Points show the predicted mean from each model, and intervals show one standard deviation above and below the mean
Fig. 6
Fig. 6
P. falciparum prevalence predictions when fit using three different datasets. In column (i), models are fit using the survey data from Africa in 2009, shown in Fig. 3a. In column (ii), the models are fit to binomial samples drawn from the Malaria Atlas prevalence raster at the same survey locations, shown in Fig. 3b. In column (iii), they are fit to binomial samples drawn from the raster at 1000 uniformly selected locations across the continent, shown in Fig. 3c. Outputs have been masked by the Malaria Atlas Project raster in Fig. 3d. Note that these maps are intended only to illustrate differences in model predictions and are not likely to accurately represent malaria prevalence in this year
Fig. 7
Fig. 7
Times taken by each model on uniformly distributed simulated datasets. GPBoost was not run with 5000 or 10,000 points due to the likely long computation time
Fig. 8
Fig. 8
Prevalence predictions from an INLA-based model with a Beta-binomial response, fit to the observation data in Fig. 3a
Fig. 9
Fig. 9
P. falciparum prevalence predictions from the FRK model with a nres = 3 and regular = 1, and b nres = 2 and regular = 2
Fig. 10
Fig. 10
Model predictions of the four models vs actual prevalences using 10-fold CV
Fig. 11
Fig. 11
Model predictions of the four models vs actual prevalences using 50-fold CV with folds in different colours
Fig. 12
Fig. 12
Interval predictions for 50-fold cross-validation for a INLA, b GPBoost, c SpRF and d FRK
Fig. 13
Fig. 13
a P. falciparum prevalence in Kenya for 2009 and b the kernel density estimates of the sampled locations
Fig. 14
Fig. 14
P. falciparum prevalence and kernel density estimates of different clusters (folds) for a 10-fold cross-validation and b 50-fold cross-validation, with zero prevalence observations taken out
Fig. 15
Fig. 15
Kernel density estimates of the locations and the absolute errors of the four models for a 10-fold cross-validation and b 50-fold cross-validation
Fig. 16
Fig. 16
Kernel density estimates of the locations and the interval widths of the four models for a 10-fold cross-validation and b 50-fold cross-validation
Fig. 17
Fig. 17
Predicted prevalence from INLA when fit to simulated data at observation locations with a no added noise, b added Gaussian noise of standard deviation 0.4 and c added Gaussian noise of standard deviation 1.2
Fig. 18
Fig. 18
Posterior means of the intercept, range and variance for the INLA-based model fit using simulated data at the observation locations with added Gaussian noise of varying standard deviation. The bottom right plot shows the time taken to fit the model to each of the datasets. Error bars show posterior interquartile ranges
Fig. 19
Fig. 19
Predictions from an INLA-based model with a Gaussian response fit to the observation data. Values have been clipped to lie within [0,1]
Fig. 20
Fig. 20
Predicted standard deviations for each of the maps shown in Fig. 6
Fig. 21
Fig. 21
P. falciparum prevalence predictions for GPBoost when using the Vecchia approximation for various values of the nearest neighbour parameters, mv and mv,p. a uses mv=mv,p=30, b uses mv=30 and mv,p=150, while c uses mv=mv,p=150
Fig. 22
Fig. 22
Time taken for GPBoost with the Vecchia approximation using values of nrounds = 247 and nrounds = 5 applied for simulated datasets of various sizes, compared to the times in Fig. 7

References

    1. Diggle P, Ribeiro Jr PJ. Model-based geostatistics. Springer; 2007.
    1. Martínez-Minaya J, Cameletti M, Conesa D, Pennino MG. Species distribution modelling: a statistical review with focus in spatio-temporal issues. Stoch Environ Res Risk Assess. 2018;32:3227–3244. doi: 10.1007/s00477-018-1548-7. - DOI
    1. Holdaway MR. Spatial modelling and interpolation of monthly temperature using kriging. Clim Res. 1996;6(3):215–225. doi: 10.3354/cr006215. - DOI
    1. Samalot A, Astitha M, Yang J, Galanis G. Combined Kalman filter and universal kriging to improve storm wind speed predictions for the northeastern United States. Weather Forecast. 2019;34(3):587–601. doi: 10.1175/WAF-D-18-0068.1. - DOI
    1. Mulla D. Mapping and managing spatial patterns in soil fertility and crop yield. In: Proceedings of soil specific crop management: a workshop on research and development issues. Wiley Online Library; 1993. pp. 15–26.