. 2023 Dec 1;16(12):dmm049861.
doi: 10.1242/dmm.049861. Epub 2023 Dec 11.

Neurofibromin 1 mutations impair the function of human induced pluripotent stem cell-derived microglia

Affiliations

Neurofibromin 1 mutations impair the function of human induced pluripotent stem cell-derived microglia

Leonard D Kuhrt et al. Dis Model Mech. .

Abstract

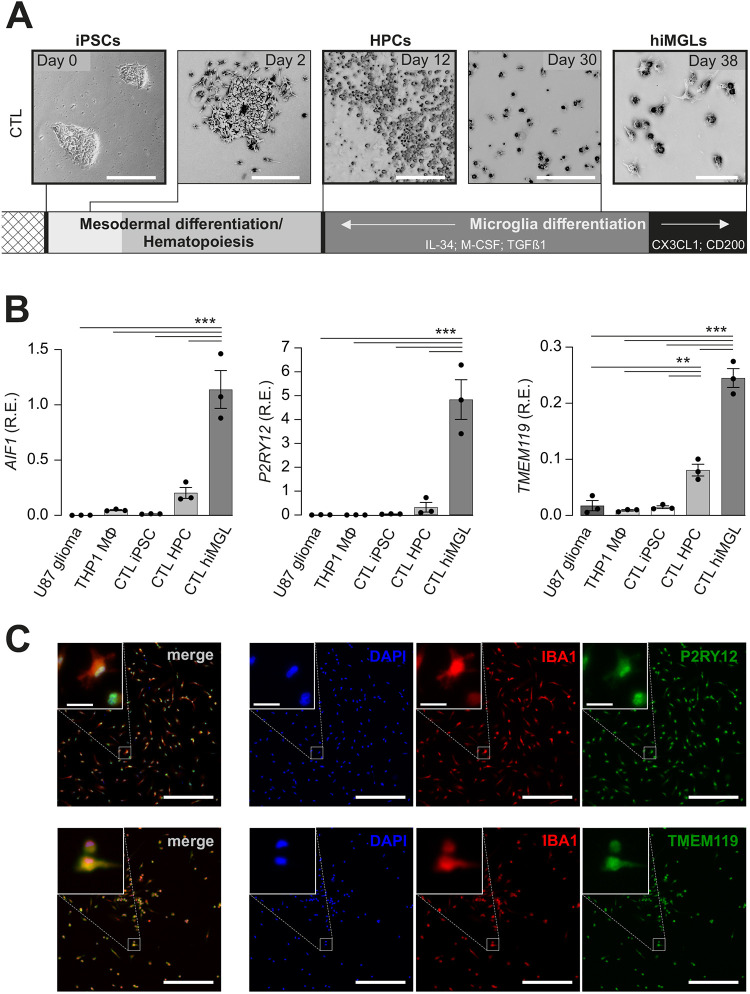
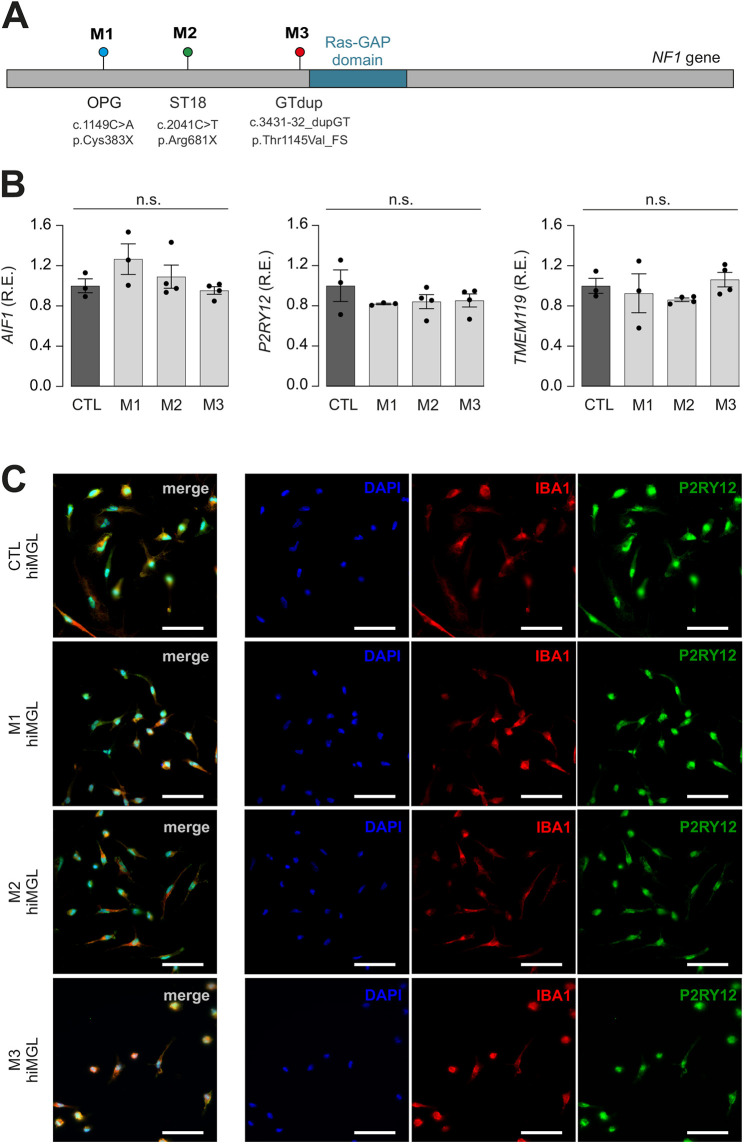
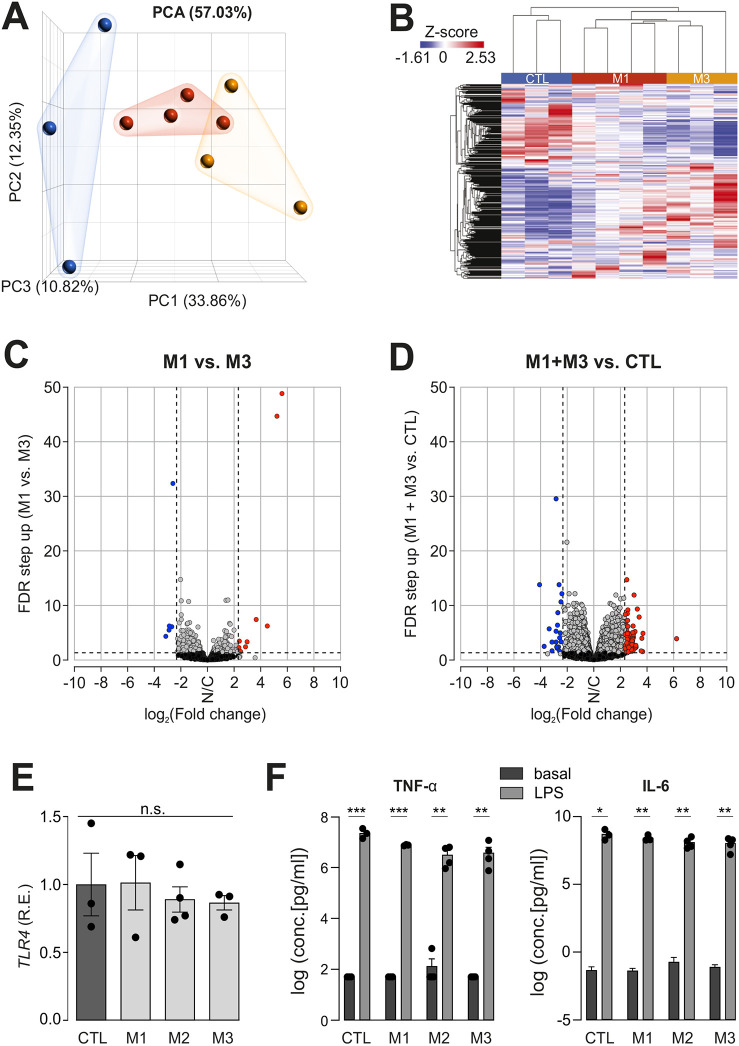
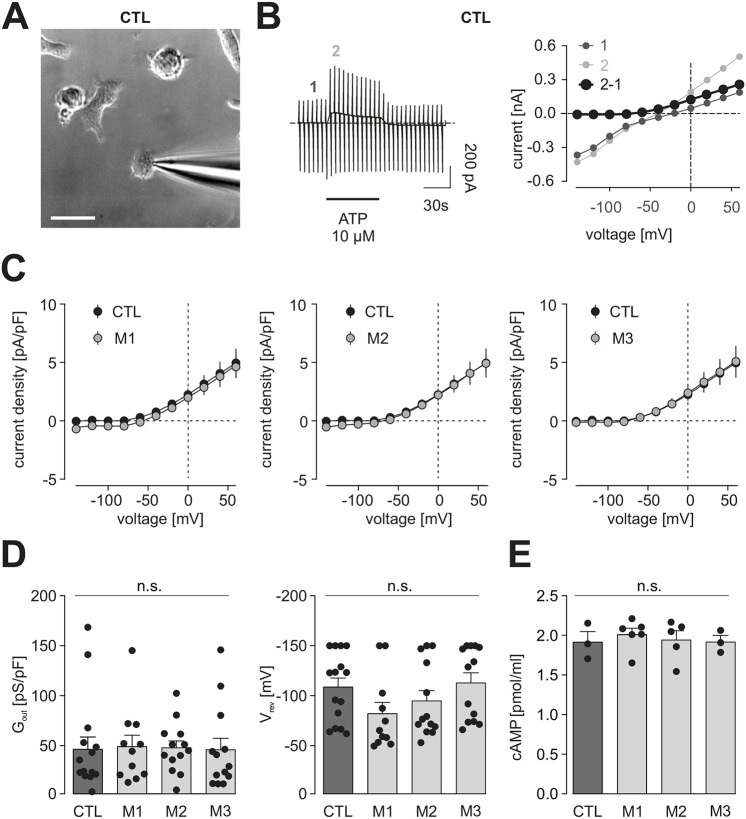
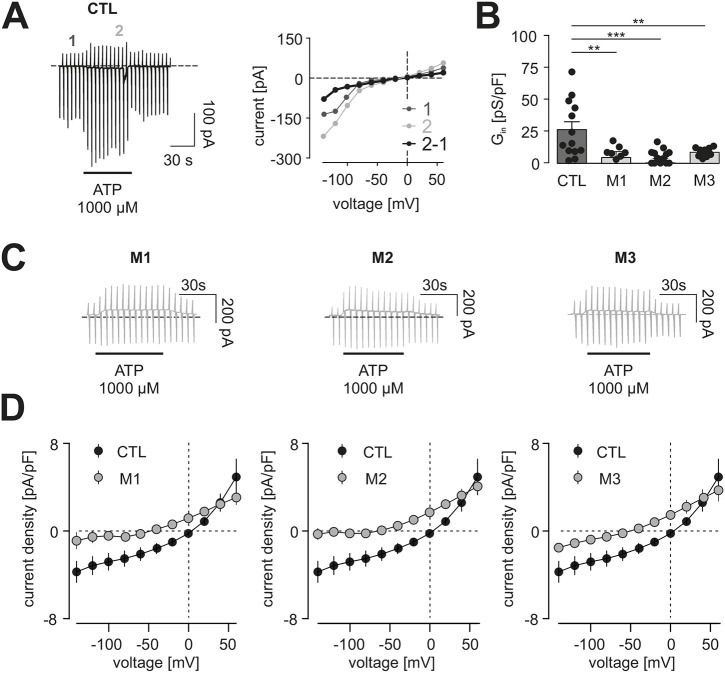
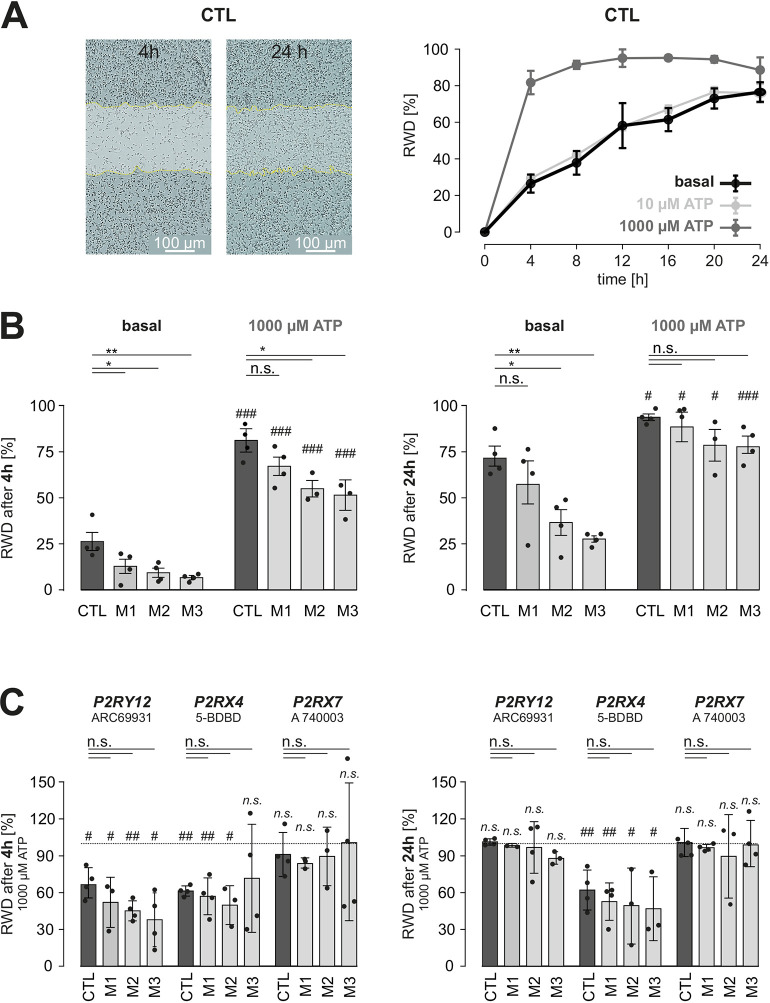
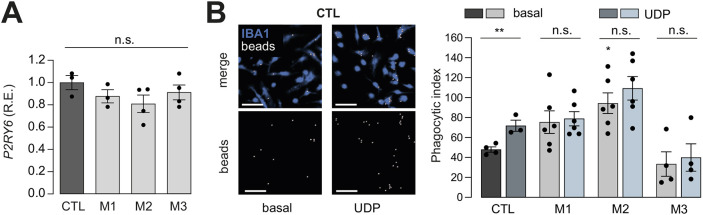
Neurofibromatosis type 1 (NF1) is an autosomal dominant condition caused by germline mutations in the neurofibromin 1 (NF1) gene. Children with NF1 are prone to the development of multiple nervous system abnormalities, including autism and brain tumors, which could reflect the effect of NF1 mutation on microglia function. Using heterozygous Nf1-mutant mice, we previously demonstrated that impaired purinergic signaling underlies deficits in microglia process extension and phagocytosis in situ. To determine whether these abnormalities are also observed in human microglia in the setting of NF1, we leveraged an engineered isogenic series of human induced pluripotent stem cells to generate human microglia-like (hiMGL) cells heterozygous for three different NF1 gene mutations found in patients with NF1. Whereas all NF1-mutant and isogenic control hiMGL cells expressed classical microglia markers and exhibited similar transcriptomes and cytokine/chemokine release profiles, only NF1-mutant hiMGL cells had defects in P2X receptor activation, phagocytosis and motility. Taken together, these findings indicate that heterozygous NF1 mutations impair a subset of the functional properties of human microglia, which could contribute to the neurological abnormalities seen in children with NF1.

Keywords: Human induced pluripotent stem cells; Microglia; Motility; Neurofibromatosis 1; Phagocytosis; Purinergic receptors.


Conflict of interest statement

Competing interests The authors declare no competing or financial interests.

Figures

Fig. 1.
Fig. 1.
hiMGL cell differentiation from control hiPSCs. (A) Representative brightfield images of human induced microglia-like (hiMGL) cells differentiated from male BJFF.6 control (CTL) hiPSCs. Day 0: hiPSC cluster under regular hiPSC growth conditions. Mesodermal and hematopoietic differentiation was induced by the STEMdiff hematopoietic kit. Day 2: mesodermal differentiation. Day 12: hematopoietic progenitor cells (HPCs). Day 30: microglial differentiation using serum-free basal media supplemented with IL–34 (100 ng/ml), M–CSF (25 ng/ml) and TGFβ1 (50 ng/ml). Day 38: CX3CL1 (100 ng/ml) and CD200 (100 ng/ml) were also added for hiMGL cell maturation for the final three days in vitro. Scale bars: 200 μm (days 0, 2, 12 and 30); 50 μm (day 38). (B) Relative mRNA expression (R.E.) levels of the microglial markers AIF1, P2RY12 and TMEM119 were assessed in BJFF.6-derived control (CTL) hiPSCs, HPCs and hiMGL cells, as well as in THP-1-derived human macrophages (Mφ) and U87 human glioma cells by quantitative reverse transcription PCR (RT-PCR). Expression levels are shown relative to expression of the TATA box-binding protein (TBP) housekeeping gene (n=3). Results are represented as the mean±s.e.m. Data were analyzed by one-way ANOVA followed by Tukey's multiple comparisons test. **P< 0.01; ***P<0.001. (C) Immunohistochemical staining of BJFF.6-derived hiMGL cells with IBA1-, TMEM119- and P2RY2-specific antibodies. Nuclei were stained with DAPI. Merged images show the combined signal for DAPI, IBA1 and P2RY12 or TMEM119. Images are representative of three independent experiments. Scale bars: 200 μm (overview); 20 μm (inlay).
Fig. 2.
Fig. 2.
NF1-mutant hiPSCs differentiate into hiMGL cells. (A) Schematic depicting the location of mutations engineered into the NF1 gene locus by CRISPR/Cas9 editing of CTL hiPSCs, generating three different NF1-mutant hiPSC lines. Mutant 1 (M1), OPG c.1149C>A p.Cys383X; mutant 2 (M2), ST18 c.2041C>T p.Arg681X; mutant 3 (M3), dup_GT c.3431-32_dupGT p.Thr1145Val_FS. (B) Relative mRNA expression (R.E.) levels of the AIF1, P2RY12 and TMEM119 microglial markers were assessed in CTL and NF1-mutant hiMGL cells (M1-M3) by quantitative RT-PCR. Gene expression levels are shown relative to expression in CTL hiMGL cells. The housekeeping gene TBP was used for normalization (n=3). Results are represented as the mean±s.e.m. Data were analyzed using a one-way ANOVA followed by a Tukey's multiple comparisons test. No significant differences (n.s.) were found between CTL and M1-M3 hiMGL cells. (C) Immunohistochemical staining of CTL and NF1-mutant (M1-M3) hiMGL cells for IBA1 and P2RY12 expression. Nuclei were stained with DAPI. Merged images show the combined signal for DAPI, IBA1 and P2RY12. Images are representative of three independent experiments. Scale bars: 50 μm.
Fig. 3.
Fig. 3.
RNA sequencing reveals few differences between NF1-mutant and CTL hiMGL cells, whereas the induced secretome remains unchanged. (A) Principal component analysis (PCA) plot generated from RNA sequencing data (CTL, blue; M1, red; M3, yellow). (B) Heatmap showing unsupervised hierarchical clustering generated from RNA sequencing data for CTL, M1 and M3 hiMGL cells. (C,D) Volcano plot demonstrating genes differentially expressed between M1 versus M3 (C) or between M1 and M3 versus CTL (D) (FDR<0.05, fold change cutoff of −5 and 5). Grey dots indicate genes with no change (N/C) in expression, blue dots indicate genes with decreased expression and red dots indicate genes with increased expression. (E) Relative mRNA expression (R.E.) of Toll-like receptor 4 (TLR4) in CTL and NF1-mutant (M1-M3) hiMGL cells by quantitative RT-PCR. Gene expression levels are shown relative to expression in CTL hiMGL cells. The housekeeping gene TBP was used for normalization (n=3). Data were normalized to TLR4 expression levels in CTL hiMGL cells. Results are represented as the mean±s.e.m. Data were analyzed by one-way ANOVA. (F) Multiplex immunoassay was used to detect TNF-α (left) and IL-6 (right) in supernatants from CTL and NF1-mutant (M1-M3) hiMGL cells in response to 1 μg/ml LPS stimulation for 24 h (n=3-4). Data between basal and LPS conditions were analyzed using two-tailed unpaired t-tests. Results are represented as the mean±s.e.m. Cytokine release under basal or LPS conditions was not significantly different between CTL and M1, M2 and M3 hiMGL cells (one-way ANOVA). The data showing the release of additional cytokines are included in Fig. S4. n.s., not significant; *P<0.05; **P<0.01; ***P<0.001.
Fig. 4.
Fig. 4.
Metabotropic purinergic responses are similar in CTL and NF1-mutant hiMGL cells. (A) Representative transmission light microscopy image of CTL hiMGL cells with the patch pipette approaching the cell. Scale bar: 20 μm. (B) Representative patch-clamp experiments on CTL hiMGL cells. Left: membrane currents were recorded from a single CTL hiMGL cell. The membrane was repetitively clamped at potentials between −140 and 60 mV every 5 s from a holding potential of −20 mV. Application of 10 µM ATP is indicated by the bar. Note the typical microglial response to ATP with activation of currents in the outward direction. Right: current-voltage relationships were obtained from the current recordings on the left. Purinergic responses (black) were determined by subtraction of current-voltage relationships before (dark gray, 1) and during (light gray, 2) the first 15 s of ATP application. (C) Average current density to voltage relationships of ATP-induced metabotropic purinergic responses in microglia derived from CTL (black) and M1 (left, gray), M2 (middle, gray) or M3 (right, gray) NF1-mutant hiMGL cells. (D) Summary of the outward conductance (Gout) between 20 mV and 60 mV (left) and the reversal potentials (Vrev) (right) of ATP (10 µM)-evoked currents from CTL and NF1-mutant hiMGL cells. Data in C,D are presented as the mean±s.e.m. Statistical comparison in D was done by a one-way ANOVA. (E) cAMP levels of cell lysates from CTL and NF1-mutant hiMGL cells were measured by ELISA (n=3-6). Data in E are presented as the mean±s.e.m. For statistical analysis, one-way ANOVA was performed. n.s., not significant, P≥0.05. Number of experiments: CTL, n=15; M1, n=11; M2, n=13; M3, n=13.
Fig. 5.
Fig. 5.
Ionotropic purinergic responses are reduced in NF1-mutant hiMGL cells. (A) Representative patch-clamp experiment. Left: membrane currents recorded from a single CTL hiMGL cell. From a holding potential of −20 mV, the membrane was repetitively clamped at potentials between −140 and 60 mV every 5 s. Application of 1000 µM ATP is indicated by the bar. Note the typical microglial response to ATP with activation of currents in inward and outward directions. Right: current-voltage relationships obtained from the recording on the left. The purinergic response (black) was determined by subtraction of current-voltage relationships before (dark gray, 1) and 15 s after (light gray, 2) the onset of ATP application. (B) Summary of the inward conductance (Gin) of ATP (1000 µM)-evoked currents between −100 mV and −120 mV. Statistical comparison was performed using a one-way ANOVA followed by a Dunnett's multiple comparisons test. (C) Sample time courses of currents clamped at potentials as described in A of M1 (left), M2 (middle) and M3 (right) hiMGL cells during application of 1000 µM ATP as indicated by the bars. Note the absence of evoked inward currents. (D) Average current density to voltage relationships of ATP (1000 µM) responses in CTL hiMGL cells relative to those in the three NF1-mutant hiMGL cell lines. Data in B and D are presented as the mean±s.e.m. Number of experiments: CTL, n=13; M1, n=9; M2, n=14; M3, n=11. **P≤0.01; ***P≤0.001.
Fig. 6.
Fig. 6.
Basal and ATP-induced motility in CTL and NF1-mutant hiMGL cells. (A) Left: representative images from scratch wound experiments in CTL hiMGL cells analyzed at 4 h and 24 h after the initial wound. Color masks (white) and dotted lines (yellow) indicate the initial scratch wound area and border, respectively, at 0 h. Scale bars: 100 μm. Right: relative wound density (RWD) was assessed over the course of 24 h, comparing CTL hiMGL cell motility in the absence and presence of ATP (10 µM and 1000 µM). Data are represented as the mean±s.e.m. (B) RWD under control conditions and in the presence of 1000 µM ATP after 4 h (left) and 24 h (right), represented as mean±s.e.m. n=4 for CTL and NF1-mutants. (C) RWD in the presence of 1000 µM ATP and inhibitors of P2RY12 (10 µM ARC69931), P2RX4 (100 µM 5-BDBD) or P2RX7 (100 µM A 740003). Data are normalized to the RWD values for CTL or mutant hiMGL cells in the absence of inhibitors (1000 µM ATP only) and represented as the mean±s.e.m. For B,C, comparisons among the CTL, M1, M2 and M3 groups were performed using one-way ANOVA followed by Tukey's multiple comparisons test and significant differences are indicated with asterisks. Comparisons between basal and 1000 µM ATP conditions were performed using a two-tailed unpaired Student's t-test and significant differences are indicated with hashtags. n.s., not significant, P>0.05; */#P<0.05; **/##P<0.01; ###P<0.001.
Fig. 7.
Fig. 7.
Analysis of differences in phagocytic activity between CTL and NF1-mutant hiMGL cells. (A) Relative P2RY6 mRNA expression (R.E.) levels in CTL and NF1-mutant hiMGL cells by quantitative RT-PCR. Gene expression levels are shown relative to expression in CTL hiMGL cells. Data were normalized to P2RY6 and TBP (housekeeping gene) expression in CTL hiMGL cells (n=3). Results are represented as the mean±s.e.m. Data were analyzed using a one-way ANOVA. (B) Phagocytic activity was assessed using fluorescent microbeads. CTL and NF1-mutant hiMGL cells were incubated for 1 h with the beads with or without the addition of 100 μM UDP. Left: representative images of CTL hiMGL cells at the end of the assay under basal and UDP conditions. IBA1 staining is indicated in blue and the beads are indicated in white. Top panels are an overlay of IBA1 (blue) and beads (white), whereas the lower panels show beads only. Control and UDP (100 µM) treatment conditions are shown in the left and right panels, respectively. Scale bars: 20 µm. Right: phagocytic activity presented as the phagocytic index, which is a measure of the percentage of cells exhibiting 0, 1, 2 or >3 engulfed beads. Results are represented as the mean±s.e.m. Comparisons among the CTL, M1, M2 and M3 groups were performed using one-way ANOVA followed by Tukey's multiple comparisons test. Comparisons between basal and UDP conditions were performed using a two-tailed unpaired Student's t-test. n=5 for CTL and n=3 for NF1-mutant hiMGL cells. Outliers were identified using Grubb's test and removed accordingly. n.s., not significant, P>0.05; **P<0.01.

References

    1. Abels, E. R., Nieland, L., Hickman, S., Broekman, M. L. D., El Khoury, J. and Maas, S. L. N. (2021). Comparative analysis identifies similarities between the human and murine microglial sensomes. Int. J. Mol. Sci. 22, 1495. 10.3390/ijms22031495 - DOI - PMC - PubMed
    1. Anastasaki, C., Wegscheid, M. L., Hartigan, K., Papke, J. B., Kopp, N. D., Chen, J., Cobb, O., Dougherty, J. D. and Gutmann, D. H. (2020). Human iPSC-derived neurons and cerebral organoids establish differential effects of germline NF1 gene mutations. Stem Cell Rep. 14, 541-550. 10.1016/j.stemcr.2020.03.007 - DOI - PMC - PubMed
    1. Boucsein, C., Kettenmann, H. and Nolte, C. (2000). Electrophysiological properties of microglial cells in normal and pathologic rat brain slices. Eur. J. Neurosci. 12, 2049-2058. 10.1046/j.1460-9568.2000.00100.x - DOI - PubMed
    1. Butovsky, O., Jedrychowski, M. P., Moore, C. S., Cialic, R., Lanser, A. J., Gabriely, G., Koeglsperger, T., Dake, B., Wu, P. M., Doykan, C. E.et al. (2014). Identification of a unique TGF-β-dependent molecular and functional signature in microglia. Nat. Neurosci. 17, 131-143. 10.1038/nn.3599 - DOI - PMC - PubMed
    1. Costa, A., Haage, V., Yang, S., Wegner, S., Ersoy, B., Ugursu, B., Rex, A., Kronenberg, G., Gertz, K., Endres, M.et al. (2021). Deletion of muscarinic acetylcholine receptor 3 in microglia impacts brain ischemic injury. Brain. Behav. Immun. 91, 89-104. 10.1016/j.bbi.2020.09.008 - DOI - PubMed

Publication types

Associated data