. 2023 Nov 22;8(22):e171962.
doi: 10.1172/jci.insight.171962.

Anti-NF-κB peptide derived from nuclear acidic protein attenuates ovariectomy-induced osteoporosis in mice

Affiliations

Anti-NF-κB peptide derived from nuclear acidic protein attenuates ovariectomy-induced osteoporosis in mice

Kenji Takami et al. JCI Insight. .

Abstract

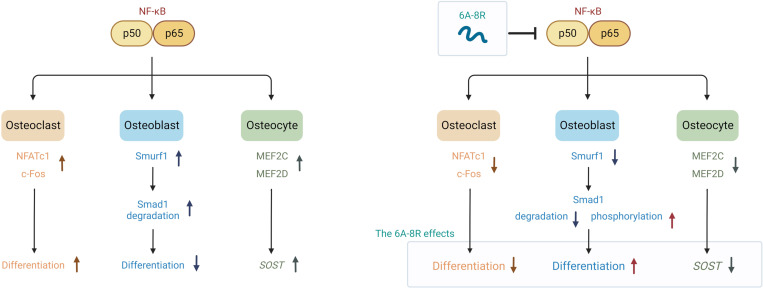
NF-κB is a transcription factor that is activated with aging. It plays a key role in the development of osteoporosis by promoting osteoclast differentiation and inhibiting osteoblast differentiation. In this study, we developed a small anti-NF-κB peptide called 6A-8R from a nuclear acidic protein (also known as macromolecular translocation inhibitor II, Zn2+-binding protein, or parathymosin) that inhibits transcriptional activity of NF-κB without altering its nuclear translocation and binding to DNA. Intraperitoneal injection of 6A-8R attenuated ovariectomy-induced osteoporosis in mice by inhibiting osteoclast differentiation, promoting osteoblast differentiation, and inhibiting sclerostin production by osteocytes in vivo with no apparent side effects. Conversely, in vitro, 6A-8R inhibited osteoclast differentiation by inhibiting NF-κB transcriptional activity, promoted osteoblast differentiation by promoting Smad1 phosphorylation, and inhibited sclerostin expression in osteocytes by inhibiting myocyte enhancer factors 2C and 2D. These findings suggest that 6A-8R has the potential to be an antiosteoporotic therapeutic agent with uncoupling properties.

Keywords: Bone Biology; Mouse models; NF-kappaB; Osteoporosis.


Conflict of interest statement

Conflict of interest: KE has received speaking fees from Asahi-Kasei, Daiichi-Sankyo, Eisai, and Eli Lilly.

Figures

Figure 1
Figure 1. Preparation of MTI-II–based anti–NF-κB drugs.
(A) Schematic representations of MTI-II, 40A-8R, and 6A-8R. A, amino acids; R, oligoarginine residues; NLS, nuclear localization signal. (B) Amino acid sequence of 40A and the candidate sequences of 12A and 6A in the active site. The 2 effector sequences are enclosed in a box. Monotonous runs of 6 or 8 arginine residues (6R or 8R) were added to the C-terminal region of each peptide. (C) NF-κB–induced luciferase activity was measured in HeLa cells transfected with MTI-II, 12A-6R, and 6A-6R expression vectors along with 2 luciferase reporter genes (κB-Luc2P and TK-hRLuc). Luciferase activity was measured after stimulation with TNF-α (1 ng/mL). Data are expressed as a ratio of κB-Luc2P activity to TK-hRLuc activity (internal control) and are presented as mean ± SD (n = 4 without TNF-α, n = 12 with TNF-α). NC, negative (empty vector) control. (D) NF-κB–induced luciferase activity was measured in HeLa cells transfected with luciferase reporter genes (κB-Luc2P and TK-hRLuc). After 10 hours of transfection, the cells were cultured with each concentration of 12A-8R and 6A-8R for 24 hours; subsequently, TNF-α (1 ng/mL) was added. Luciferase activity was measured 4.5 hours after stimulation with TNF-α. Data are expressed as a ratio of κB-Luc2P activity to TK-hRLuc activity (internal control) and are presented as mean ± SD (n = 4 without TNF-α, n = 12 with TNF-α). (E) Quantitative real-time PCR of mouse bone marrow mononuclear cells (BMMCs) and MC3T3-E1 cells. The relative gene expression of Mti-II with or without differentiating stimulations and 6A-8R (3 mg/mL) is plotted on the y axis. Data were statistically analyzed using 1-way ANOVA and Tukey-Kramer test. **P < 0.01; ****P < 0.0001. NS, not significant.
Figure 2
Figure 2. Effects of 6A-8R on ovariectomized (OVX) mice.
(A) Schematic protocol of the animal experiment. Four milligrams of 6A-8R was intraperitoneally administered 5 days per week for 4 weeks, and samples (femurs) were collected. (B) Percentage changes in the body weight of the mice from baseline in each group. (C) Micro-CT images of the distal part of the femur on day 28 after OVX with or without 6A-8R administration. (D) Cancellous bone volume (BV)/tissue volume (TV), trabecular number (Tb.N), trabecular thickness (Tb.Th), and trabecular separation (Tb.Sp). Data are expressed as mean ± SD (n = 7 or 9) and were statistically analyzed using 1-way ANOVA and the Tukey-Kramer test. *P < 0.05; **P < 0.01; ***P < 0.001; ****P < 0.0001.
Figure 3
Figure 3. Histological and histomorphometric analysis of the distal part of the femur for osteoclasts in Sham-operated and OVX mice with or without intraperitoneal injection of 6A-8R (4 mg) 5 days per week for 4 weeks.
(A) Histological findings of the distal part of the femur stained with hematoxylin and eosin. Scale bar: 1 mm. (B) TRAP staining. Scale bars: 1 mm (top and middle rows) and 200 μm (bottom row). (C) Plot of the number of TRAP-positive cells per unit trabecular surface. Data are expressed as mean ± SD (n = 7 or 9). (D) Histomorphometric findings of the distal part of the femur. Plots of the number of osteoclasts (Oc.N) (N/mm), number of multinucleated osteoclasts (M.Oc.N) (N/mm), and eroded surface (ES)/bone surface (BS) (%). Data are expressed as mean ± SD (n = 4) and were statistically analyzed using 1-way ANOVA and the Tukey-Kramer test. **P < 0.01; ***P < 0.001; ****P < 0.0001.
Figure 4
Figure 4. Histological and histomorphometric analysis of the distal part of the femur for osteoblasts and osteocytes in Sham-operated and OVX mice with or without intraperitoneal injection of 6A-8R (4 mg) 5 days per week for 4 weeks.
(A) Osteocalcin staining. (B) Sclerostin staining. Scale bars (A and B): 1 mm (top rows) and 200 μm (bottom rows). (C) Plot of the number of osteocalcin-positive cells per unit trabecular surface. (D) Plot of the number of sclerostin-positive cells per total osteocytes. Data are expressed as mean ± SD (n = 7 or 9). (E) Plots of the number of osteoblasts (Ob.N) (N/mm), bone formation rate (BFR)/bone surface (BS) (mm³/mm²/year), and mineral apposition rate (MAR) (μm/day). (F) Images of MAR under fluorescent light (white arrow, double-labeled surface). Scale bars: 10 μm. Data are expressed as mean ± SD (n = 4) and were statistically analyzed using 1-way ANOVA and the Tukey-Kramer test. *P < 0.05; **P < 0.01; ***P < 0.001; ****P < 0.0001.
Figure 5
Figure 5. Effects of 6A-8R administration on osteoclasts.
(A) Mouse bone marrow mononuclear cells (BMMCs) were transfected with a luciferase reporter gene (κB-Luc2P). After 24 hours of transfection, the cells were cultured with or without RANKL (50 ng/mL) for 6 hours together with indicated concentrations of 6A-8R. Data are expressed as mean ± SD (n = 3 or 6). (B) TRAP staining was performed, and the number of TRAP-positive cells was determined by microscopy. Scale bars: 100 μm. Data are expressed as mean ± SD (n = 3). (C) The bone resorption activity of osteoclasts was evaluated using an osteo-assay plate. Data are expressed as mean ± SD (n = 4). (D and E) Western blotting analysis of mouse BMMCs cultured with RANKL (50 ng/mL) with or without 6A-8R (3 mg/mL). (F) Changes in the expression of genes involved in osteoclast differentiation was assessed. Data are expressed as mean ± SD (n = 4). (G) Immunofluorescence microscopy analysis of p65 was performed on mouse BMMCs before and after stimulation with RANKL (50 ng/mL) and with or without 6A-8R (3 mg/mL). Red, p65 immunofluorescent staining; blue, 4′,6-diamidino-2-phenylindole (DAPI) nuclear staining. Scale bars: 20 μm. (H) CUT&RUN analysis of mouse BMMCs was performed 60 minutes after stimulation with RANKL (50 ng/mL) with or without 6A-8R (3 mg/mL). Data are expressed as mean ± SD (n = 4). *P < 0.05; **P < 0.01; ***P < 0.001; ****P < 0.0001 by 1-way ANOVA and the Tukey-Kramer test (AC and F) or Mann-Whitney U test (H). NS, not significant.
Figure 6
Figure 6. Effects of 6A-8R on osteoblasts.
(A) The effect of 6A-8R on alkaline phosphatase (ALP) of MC3T3-E1 cells stimulated with TNF-α (1 ng/mL) was evaluated using ALP staining. (B) The effect of 6A-8R on the mineralization of MC3T3-E1 cells stimulated with TNF-α (1 ng/mL) was evaluated using Alizarin red staining. Data (bottom) are expressed as mean ± SD (n = 3). (CE) The effects of 6A-8R on the phosphorylation of p65, expression of p50, phosphorylation of IκBα, phosphorylation of Smad1, and expression of Smurf1 after TNF-α stimulation were analyzed using Western blotting. (F) The effects of 6A-8R on the gene expression of runt-related transcription factor 2 (Runx2), Osterix, activating transcription factor 4 (Atf4), and Alp were analyzed using quantitative real-time PCR. Data are expressed as mean ± SD (n = 4). (G and H) The effects of 6A-8R on the proliferation of mouse bone marrow mononuclear cells (BMMCs) and MC3T3-E1 cells were evaluated using water-soluble tetrazolium assay. Data are expressed as mean ± SD (n = 3). *P < 0.05; **P < 0.01; ***P < 0.001; ****P < 0.0001 by 1-way ANOVA and the Tukey-Kramer test (B and F) or 2-tailed Student’s t test (G and H). NS, not significant.
Figure 7
Figure 7. Effects of 6A-8R on osteocytes.
(A) The expression of the sclerosteosis gene (SOST) in sarcoma osteogenic (SaOS-2) cells after TNF-α (1 ng/mL) stimulation with 6A-8R was analyzed using quantitative real-time PCR. Data are expressed as mean ± SD (n = 4) and were statistically analyzed using 1-way ANOVA and Tukey-Kramer test. **P < 0.01, ***P < 0.001. (B) Western blotting analysis of myocyte enhancer factor 2C (MEF2C) and MEF2D in SaOS-2 cells cultured with TNF-α (1 ng/mL) with or without 6A-8R (3 mg/mL). Volumetric analysis was performed utilizing β-actin as a loading control.
Figure 8
Figure 8. Hypothetical scheme summarizing the effects of NF-κB without (left) or with (right) 6A-8R on osteoclasts, osteoblasts, and osteocytes.

References

    1. Weivoda MM, et al. Identification of osteoclast-osteoblast coupling factors in humans reveals links between bone and energy metabolism. Nat Commun. 2020;11(1):87. doi: 10.1038/s41467-019-14003-6. - DOI - PMC - PubMed
    1. Chen X, et al. Osteoblast-osteoclast interactions. Connect Tissue Res. 2018;59(2):99–107. doi: 10.1080/03008207.2017.1290085. - DOI - PMC - PubMed
    1. Black DM, et al. Atypical femur fracture risk versus fragility fracture prevention with bisphosphonates. N Engl J Med. 2020;383(8):743–753. doi: 10.1056/NEJMoa1916525. - DOI - PMC - PubMed
    1. Tsai JN, et al. Effects of two years of teriparatide, denosumab, or both on bone microarchitecture and strength (DATA-HRpQCT study) J Clin Endocrinol Metab. 2016;101(5):2023–2030. doi: 10.1210/jc.2016-1160. - DOI - PMC - PubMed
    1. Vestergaard Kvist A, et al. Cardiovascular safety profile of romosozumab: a pharmacovigilance analysis of the US Food and Drug Administration adverse event reporting system (FAERS) J Clin Med. 2021;10(8):1660. doi: 10.3390/jcm10081660. - DOI - PMC - PubMed

Publication types