. 2023 Dec 12;17(23):23746-23760.
doi: 10.1021/acsnano.3c07555. Epub 2023 Nov 22.

Biomimetic Macrophage Membrane-Camouflaged Nanoparticles Induce Ferroptosis by Promoting Mitochondrial Damage in Glioblastoma

Affiliations

Biomimetic Macrophage Membrane-Camouflaged Nanoparticles Induce Ferroptosis by Promoting Mitochondrial Damage in Glioblastoma

Zhengcong Cao et al. ACS Nano. .

Abstract

The increasing understanding of ferroptosis has indicated its role and therapeutic potential in cancer; however, this knowledge has yet to be translated into effective therapies. Glioblastoma (GBM) patients face a bleak prognosis and encounter challenges due to the limited treatment options available. In this study, we conducted a genome-wide CRISPR-Cas9 screening in the presence of a ferroptosis inducer (RSL3) to identify the key driver genes involved in ferroptosis. We identified ALOX15, a key lipoxygenase (LOX), as an essential driver of ferroptosis. Small activating RNA (saRNA) was used to mediate the expression of ALOX15 promoted ferroptosis in GBM cells. We then coated saALOX15-loaded mesoporous polydopamine (MPDA) with Angiopep-2-modified macrophage membranes (MMs) to reduce the clearance by the mononuclear phagocyte system (MPS) and increase the ability of the complex to cross the blood-brain barrier (BBB) during specific targeted therapy of orthotopic GBM. These generated hybrid nanoparticles (NPs) induced ferroptosis by mediating mitochondrial dysfunction and rendering mitochondrial morphology abnormal. In vivo, the modified MM enabled the NPs to target GBM cells, exert a marked inhibitory effect on GBM progression, and promote GBM radiosensitivity. Our results reveal ALOX15 to be a promising therapeutic target in GBM and suggest a biomimetic strategy that depends on the biological properties of MMs to enhance the in vivo performance of NPs for treating GBM.

Keywords: ALOX15; ferroptosis; glioblastoma; macrophage membrane; nanoparticle.


Conflict of interest statement

The authors declare no competing financial interest.

Figures
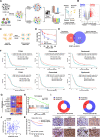
Figure 1
Figure 1
Genome-wide CRISPR–Cas9 library screening and RNA sequencing led to the identification of ALOX15 as an essential driver of ferroptosis in glioma. (A) Schematics of the experimental design. (B) Volcano plot displaying the log2 fold change and adjusted P value for all sgRNAs identified in the screen. (C) Induction of RSL3-resistant cells from parental LN229 cells by RSL3 treatment. RNA-Seq was performed in RSL3-resistant cells in parallel with parental cells. (D) RSL3-resistant LN229 cells and parental LN229 cells were treated with RSL3 with the gradient concentrations. IC50 was assessed by cell counting kit-8(CCK-8) at 48 h. (E) Venn diagrams show overlapped essential driver genes for ferroptosis. (F) Prognostic significance of ALOX15 and PCBP1 up-regulation in glioma in TCGA, Gravendeel and Rembrandt databases. (G) RNA-seq was performed in patients with high ALOX15 expression and low ALOX15 expression. (H) GSEA demonstrated that ferroptosis-related genes were significantly enriched following glioma samples with high expression of ALOX15. (I) Representative images of IHC staining of ALOX15 in specimens of nonrelapsed and relapsed patients. (J) Pearson correlation analysis revealed that the expression of ALOX15 was positively correlated with the expression of 4-HNE. (K) Kaplan–Meier estimate of survival time for glioma patients with low versus high expression of ALOX15.
Figure 2
Figure 2
SaALOX15-mediated activation of ALOX15 promotes ferroptosis in GBM cells. (A, B) A fluorescent reporter system was constructed to indicate the activation of the ALOX15 promoter. LN229 cells were transfected with saALOX15 with the gradient concentrations, and the level of mcherry-ON was measured by a confocal microscope. Scale bar = 10 μm. (C) qRT-PCR and immunoblot were used to detect the overexpress efficiency of saALOX15. (D) Detection of living and dead cells. Scale bar = 10 μm. (E) The ratio of oxidized to nonoxidized lipids. (F) Liperfluo staining visualized lipid ROS in cells after treatment. (G) Confocal microscopy visualized the alterations in lipid peroxidation in LN229 cells after C11-BODIPY probe staining. Scale bar = 10 μm. (H) Confocal microscopy visualized the alterations in MMP (Δψm) in LN229 cells after JC-1 staining. Scale bar = 10 μm.
Figure 3
Figure 3
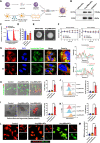
Synthesis and characterization of Ang-MMsaNPs. (A) Construction schematic diagram of Ang-MMsaNPs. (B) Biomarkers of macrophage membrane (MM) detected by Immunoblot. (C) Hydrodynamic diameter change analysis of NPs. (D) Zeta potential change analysis of NPs. (E) Transmission electron microscopy images of purified NPs. (F) Detection of the stability of NPs. (G) In vitro endosomal escape capability of Ang-MMsaNPs in LN229 cells by confocal microscopy. Scale bar = 5 μm. (H) Detection of living and dead cells after Ang-MMsaNPs treatment. Scale bar = 10 μm. (I) Detection of living and dead cells in PDOs after Ang-MMsaNPs treatment. Scale bar = 100 μm. (J) The ratio of oxidized to nonoxidized lipids after Ang-MMsaNPs treatment. (K) Liperfluo staining visualized lipid ROS in cells after Ang-MMsaNPs treatment. (L) Confocal microscopy visualized the alterations in lipid peroxidation after Ang-MMsaNPs treatment. Scale bar = 10 μm. (M) The expression level of lipid peroxidation products (MDA) after Ang-MMsaNPs treatment.
Figure 4
Figure 4
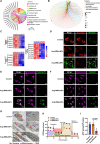
Ang-MMsaNPs induce GBM ferroptosis by promoting mitochondrial damage. (A) The Gene Ontology (GO) function enrichment analysis. (B) KEGG enrichment analysis of genes differentially expressed after Ang-MMsaNPs treatment. (C) Differential expression analysis of the mitochondrial electron transport chain (ETC) complexes I (NDUFs), IV (COXs), and V (ATPSs) related genes after Ang-MMsaNPs treatment. (D) Confocal microscopy visualized the alterations in MMP (Δψm) after Ang-MMsaNPs treatment. Scale bar = 10 μm. (E) Confocal microscopy visualized the alterations in mitochondrial lipid peroxidation after MitoPeDPP and MitoBright LT Deep Red staining. Scale bar = 10 μm. (F) Confocal microscopy visualized the alterations in mitochondrial ROS after MitoSOX and MitoBright LT Deep Red staining. Scale bar = 10 μm. (G) Transmission electron microscopy images of LN229 cells after Ang-MMsaNPs treatment. Nu, nucleus; red arrows, mitochondria; yellow arrows, rough endoplasmic reticulum. (H) The real-time oxygen consumption rate (OCR) was measured after Ang-MMsaNPs treatment by Seahorse XF extracellular flux analyzer. (I) Thy level of ATP after Ang-MMsaNPs treatment.
Figure 5
Figure 5
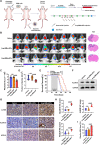
Ang-MMsaNPs escape the MPS and effectively target and accumulate in GBM. (A) Schematic image. Process of Ang-MMsaNPs animal tail vein injection, spleen harvesting, immunomagnetic separation, monocytes isolation, and flow cytometry sorting. (B) The levels of ICG positivity in CD11b+ monocytes were measured after Ang-MMsaNPs treatment by flow cytometry. (C) Schematic image of the BBB model in vitro. (D) Immunofluorescence images detected MPDA-NPs and Ang-MMsaNPs uptake into LN229 cells after passing through a bEnd.3 monolayer. Scale bar, 10 μm. (E) Fluorescence images of orthotopic LN229-bearing nude mice and major organs following injection of ICG-labeled MPDA-NPs and Ang-MMsaNPs. (F) ICG-labeled NPs fluorescence from major organs in orthotopic mice model after intravenous injection of different types of NPs.
Figure 6
Figure 6
The in vivo therapeutic efficacy of Ang-MMsaNPs in orthotopic GBM-bearing mice. (A) Schematic image. Timeline of the LN229 orthotopic tumor model receiving NPs therapy. (B, C) Luciferase luminescence levels of mice following the indicated treatments. (D) Tumor volume quantification after the last treatment. (E) Survival curves of LN229-bearing mice following the indicated treatments. n = 8 animals per treatment group. (F) Western blot was used to detect the overexpression efficiency of saALOX15 in tumor cells after NPs treatment. (G, H) IHC analysis of ALOX15, ACSL4 and 4-HNE expression in tumor tissues after NPs treatment. (I) The expression level of MDA in tumor tissues after NPs treatment.
Figure 7
Figure 7
The combination of Ang-MMsaNPs and RT is efficient for tumor regression in GBM. (A) Schematic image. Timeline of the LN229 orthotopic tumor model receiving combination therapy. (B, C) Luciferase luminescence levels of mice following the indicated treatments. (D) Tumor volume quantification after the last treatment. (E) Survival curves of LN229-bearing mice following the indicated treatments. n = 8 animals per treatment group. (F) Western blot was used to detect the overexpress efficiency of saALOX15 in tumor cells after combination treatment. (G, H) IHC analysis of ALOX15, ACSL4 and 4-HNE expression in tumor tissues after combination treatment. (I) The expression level of MDA in tumor tissues after combination treatment.

References

    1. Gu J.; Mu N.; Jia B.; Guo Q.; Pan L.; Zhu M.; Zhang W.; Zhang K.; Li W.; Li M.; Wei L.; Xue X.; Zhang Y.; Zhang W. Targeting radiation-tolerant persister cells as a strategy for inhibiting radioresistance and recurrence in glioblastoma. Neuro Oncol 2022, 24 (7), 1056–1070. 10.1093/neuonc/noab288. - DOI - PMC - PubMed
    1. Liu T.; Zhu C.; Chen X.; Guan G.; Zou C.; Shen S.; Wu J.; Wang Y.; Lin Z.; Chen L.; Cheng P.; Cheng W.; Wu A. Ferroptosis, as the most enriched programmed cell death process in glioma, induces immunosuppression and immunotherapy resistance. Neuro Oncol 2022, 24 (7), 1113–1125. 10.1093/neuonc/noac033. - DOI - PMC - PubMed
    1. Quail D. F.; Joyce J. A. The Microenvironmental Landscape of Brain Tumors. Cancer Cell 2017, 31 (3), 326–341. 10.1016/j.ccell.2017.02.009. - DOI - PMC - PubMed
    1. Tang W.; Fan W.; Lau J.; Deng L.; Shen Z.; Chen X. Emerging blood-brain-barrier-crossing nanotechnology for brain cancer theranostics. Chem. Soc. Rev. 2019, 48 (11), 2967–3014. 10.1039/C8CS00805A. - DOI - PubMed
    1. Sampson J. H.; Gunn M. D.; Fecci P. E.; Ashley D. M. Brain immunology and immunotherapy in brain tumours. Nat. Rev. Cancer 2020, 20 (1), 12–25. 10.1038/s41568-019-0224-7. - DOI - PMC - PubMed

Publication types