. 2023 Dec 13;23(23):10971-10982.
doi: 10.1021/acs.nanolett.3c03222. Epub 2023 Nov 22.

Intracerebral Nanoparticle Transport Facilitated by Alzheimer Pathology and Age

Affiliations

Intracerebral Nanoparticle Transport Facilitated by Alzheimer Pathology and Age

Gregory C Tracy et al. Nano Lett. .

Abstract

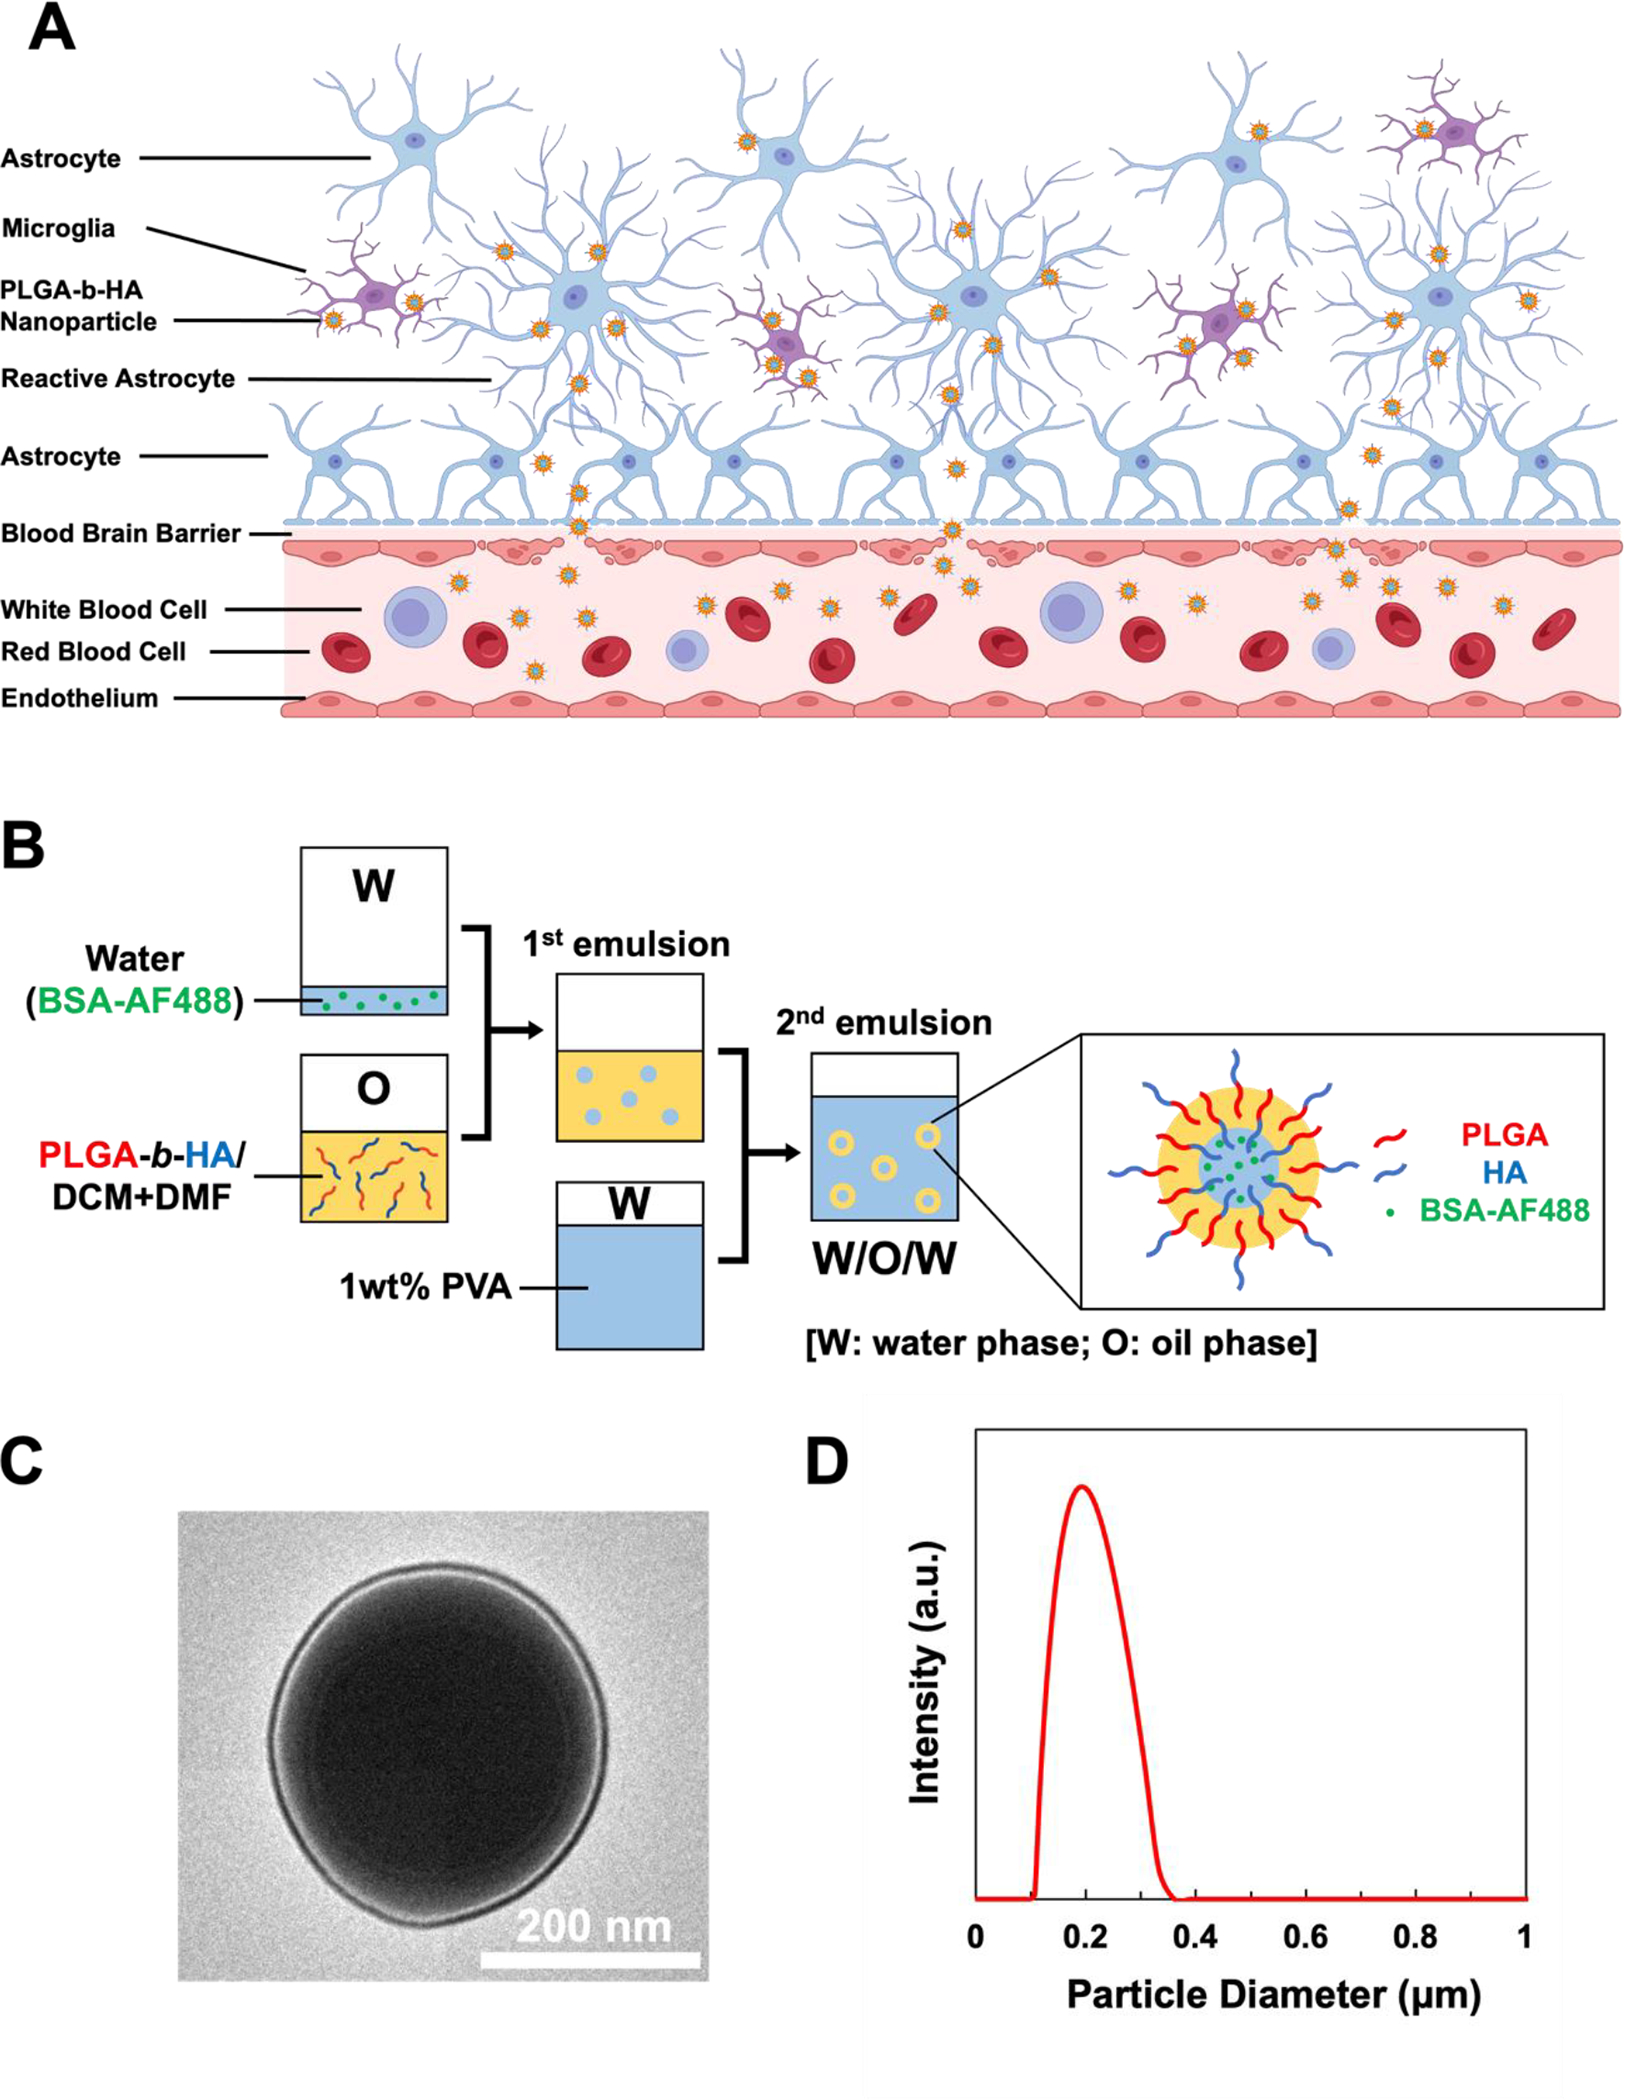
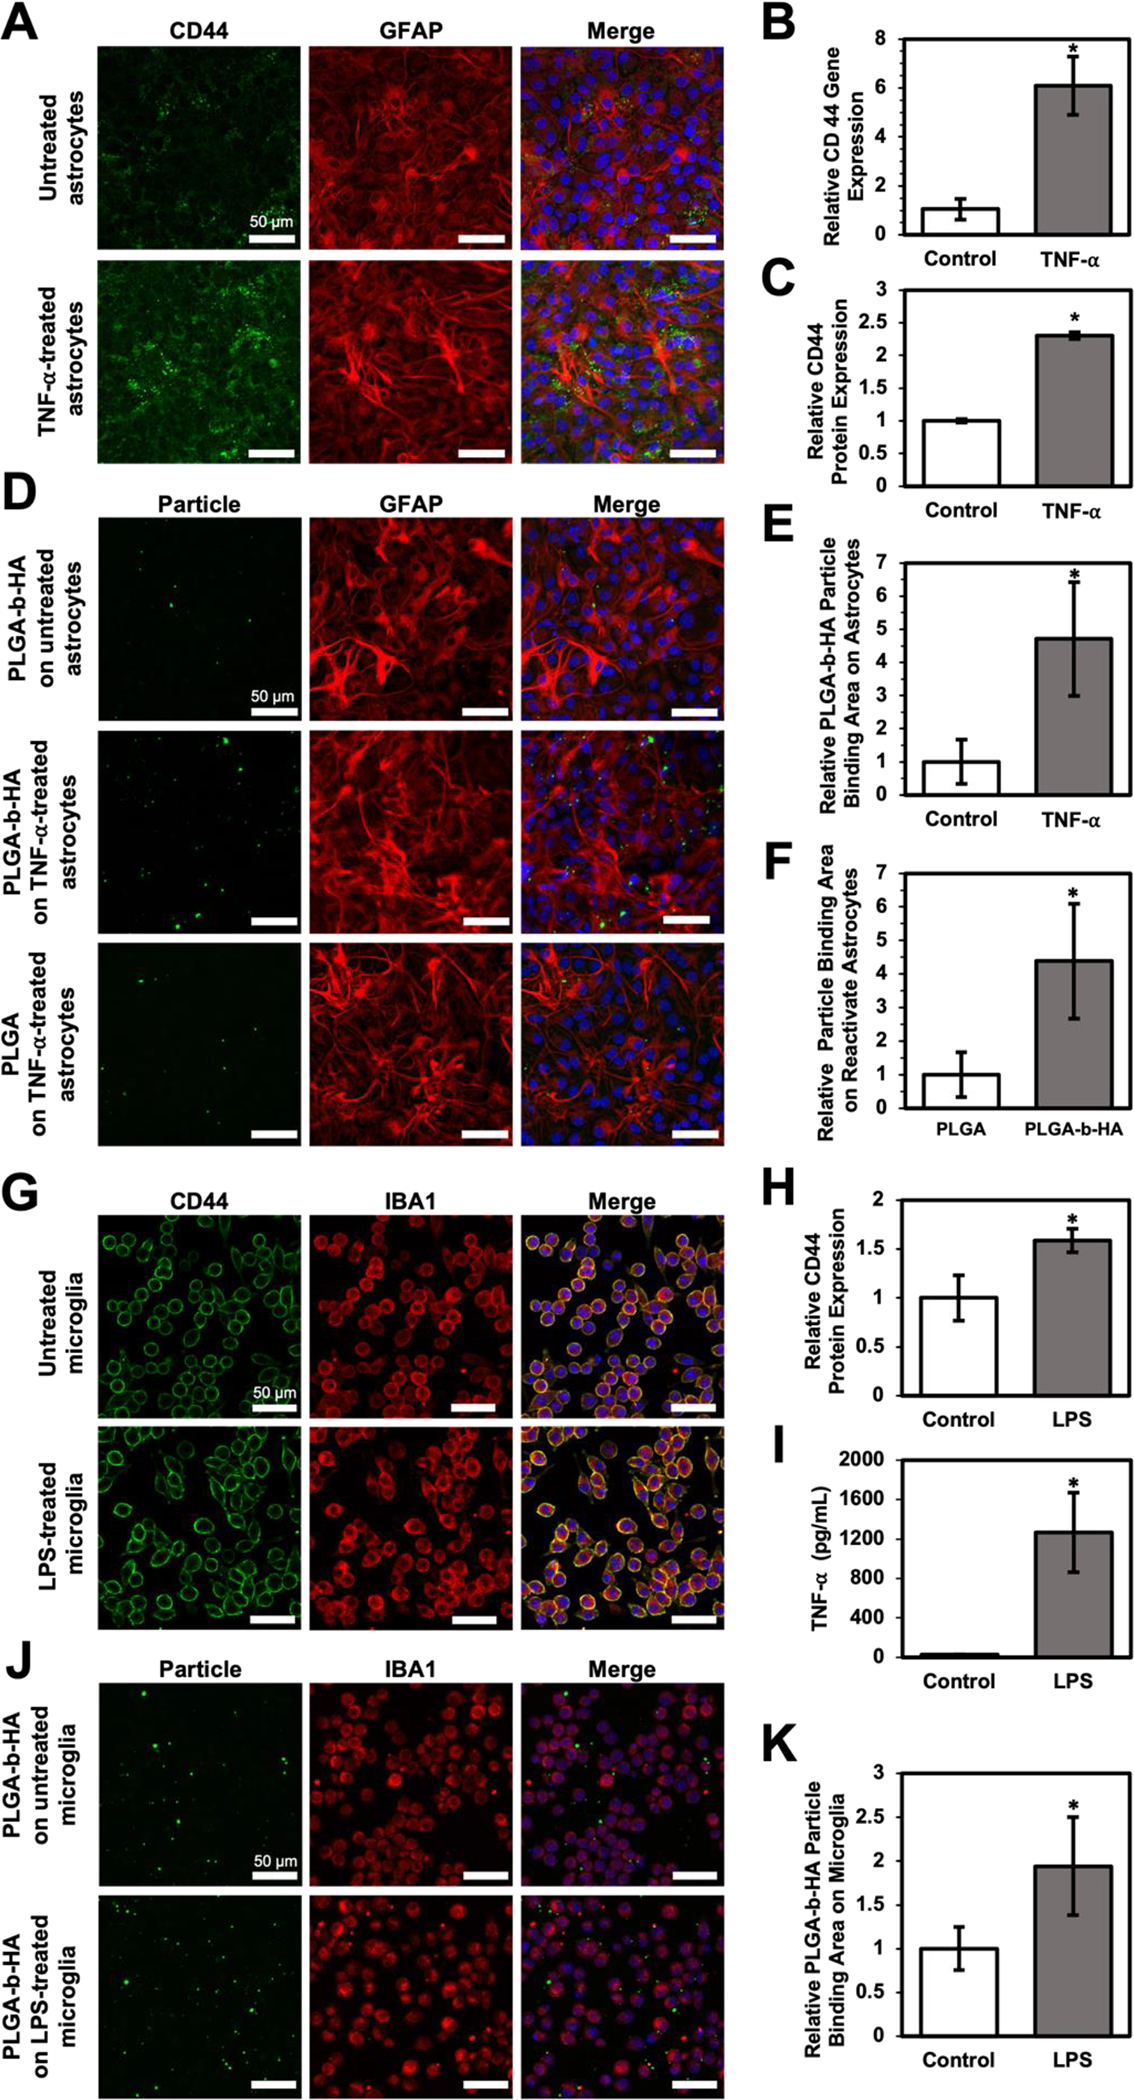
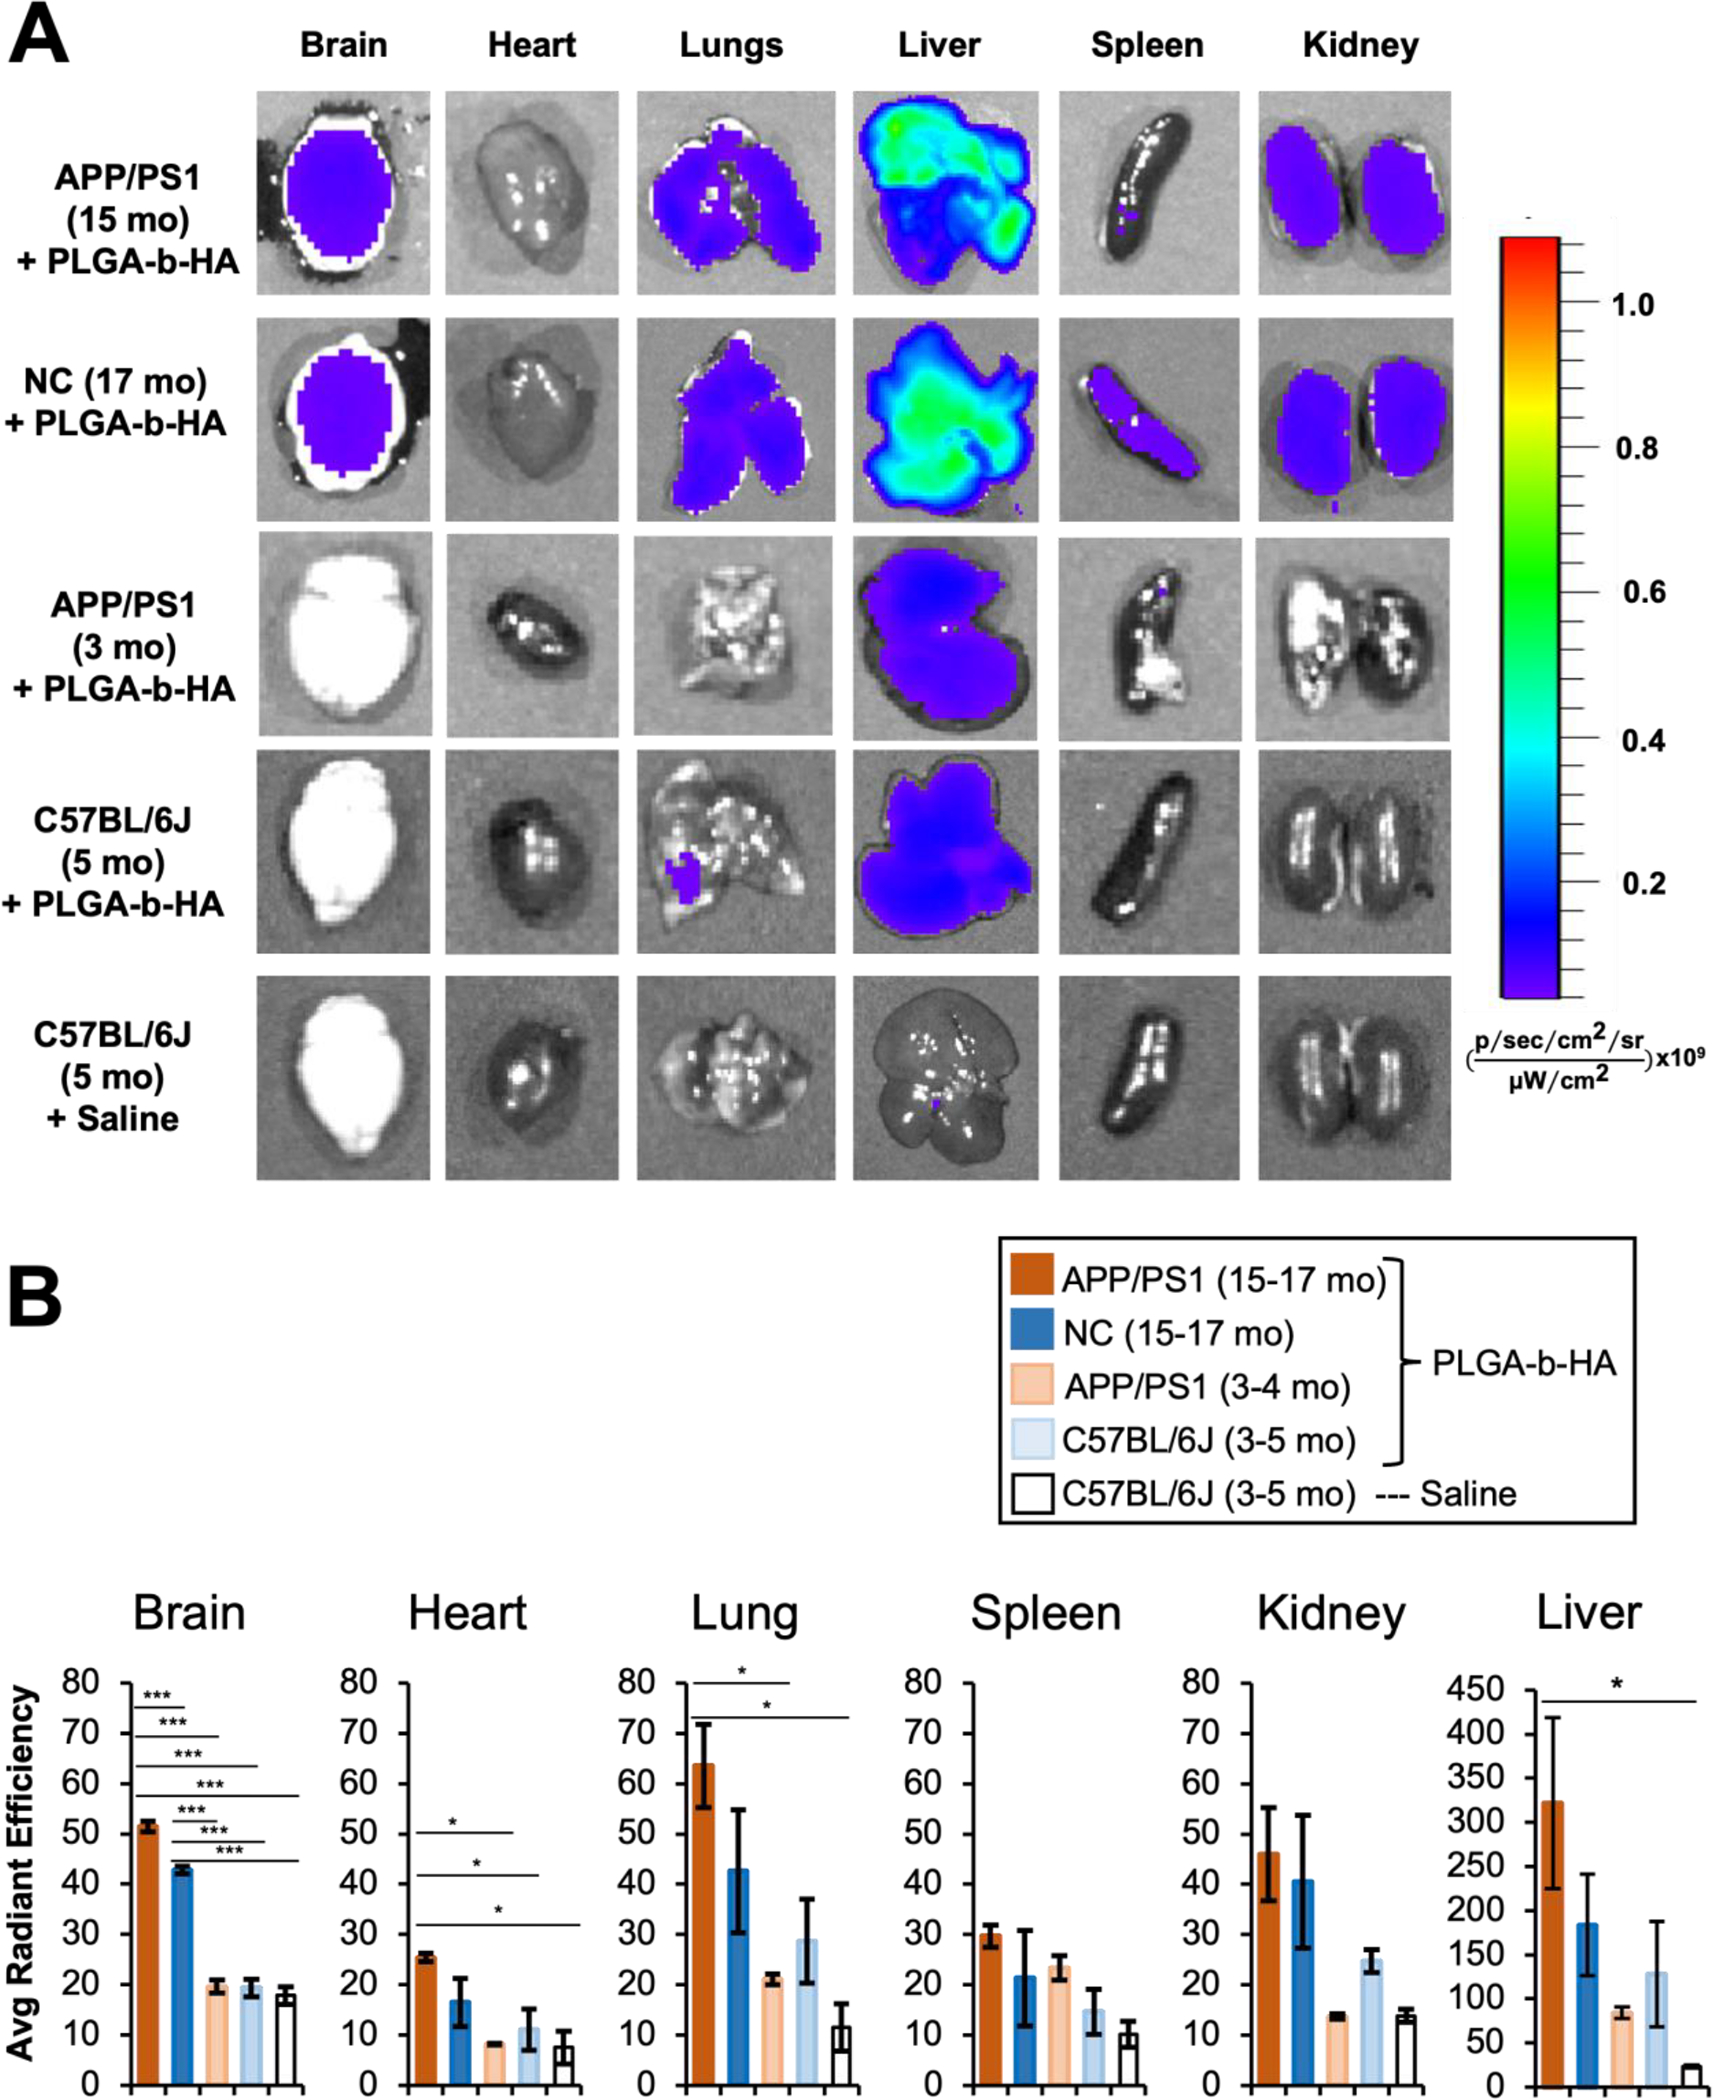
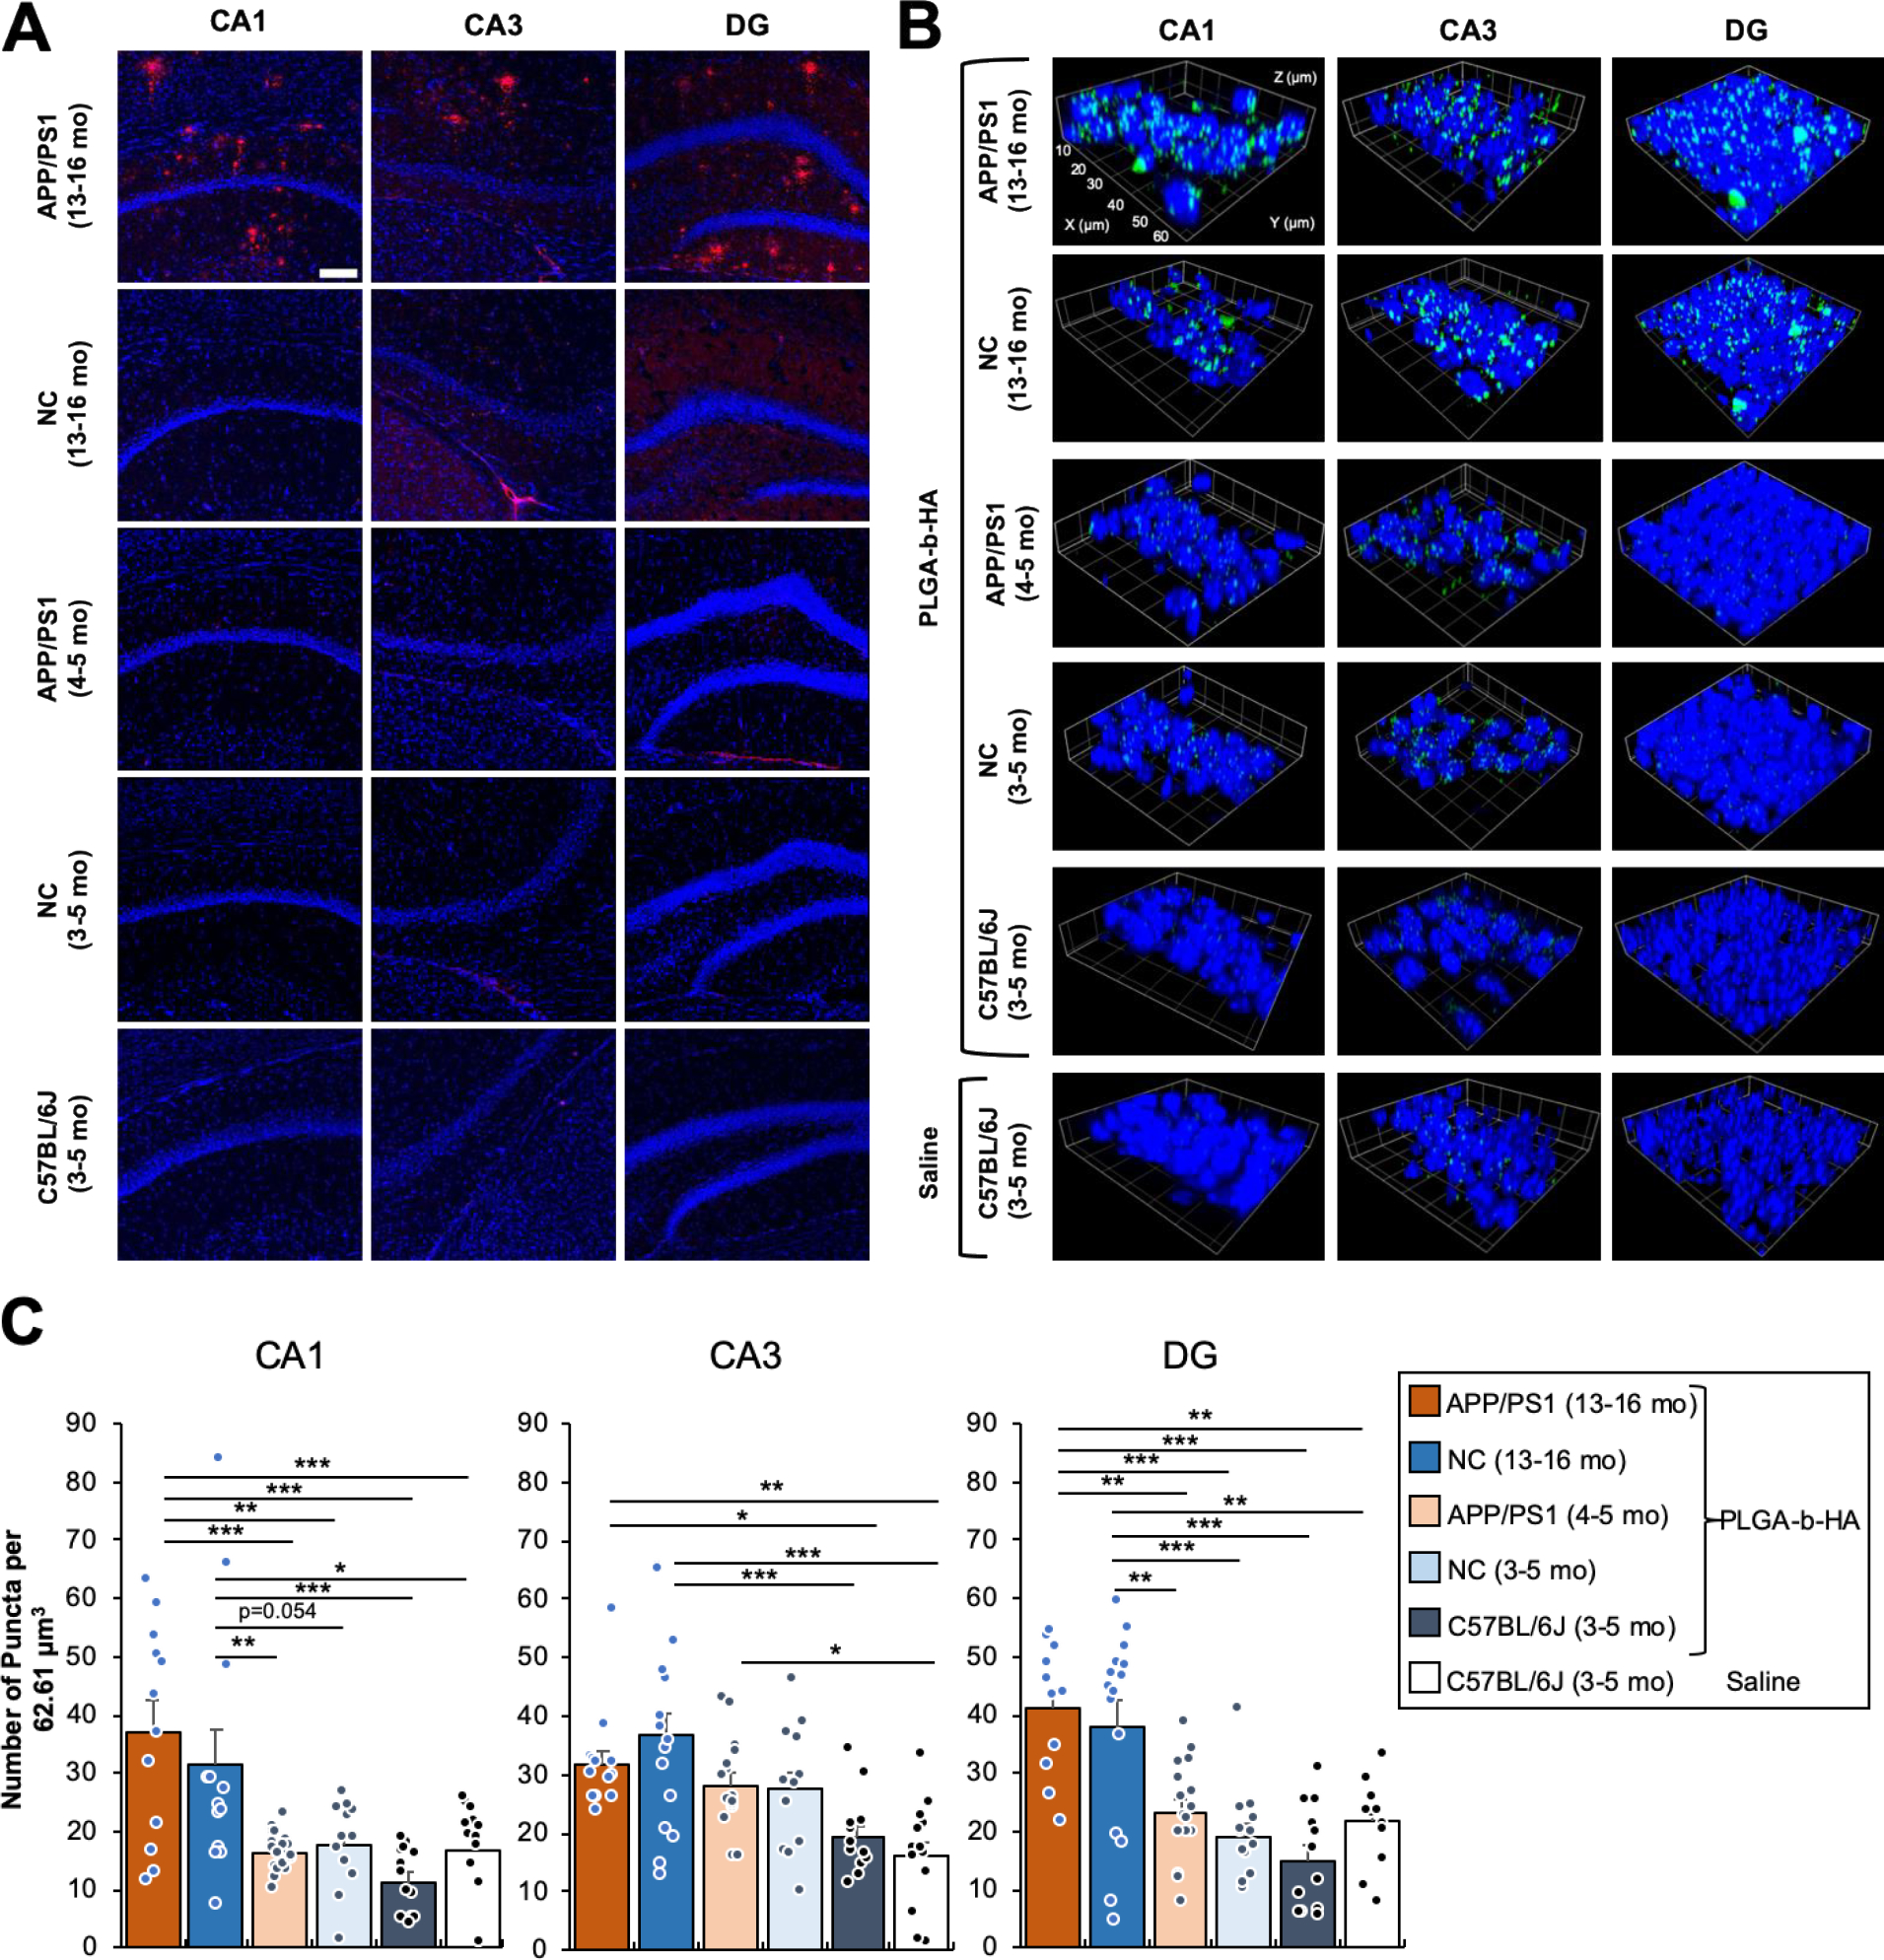
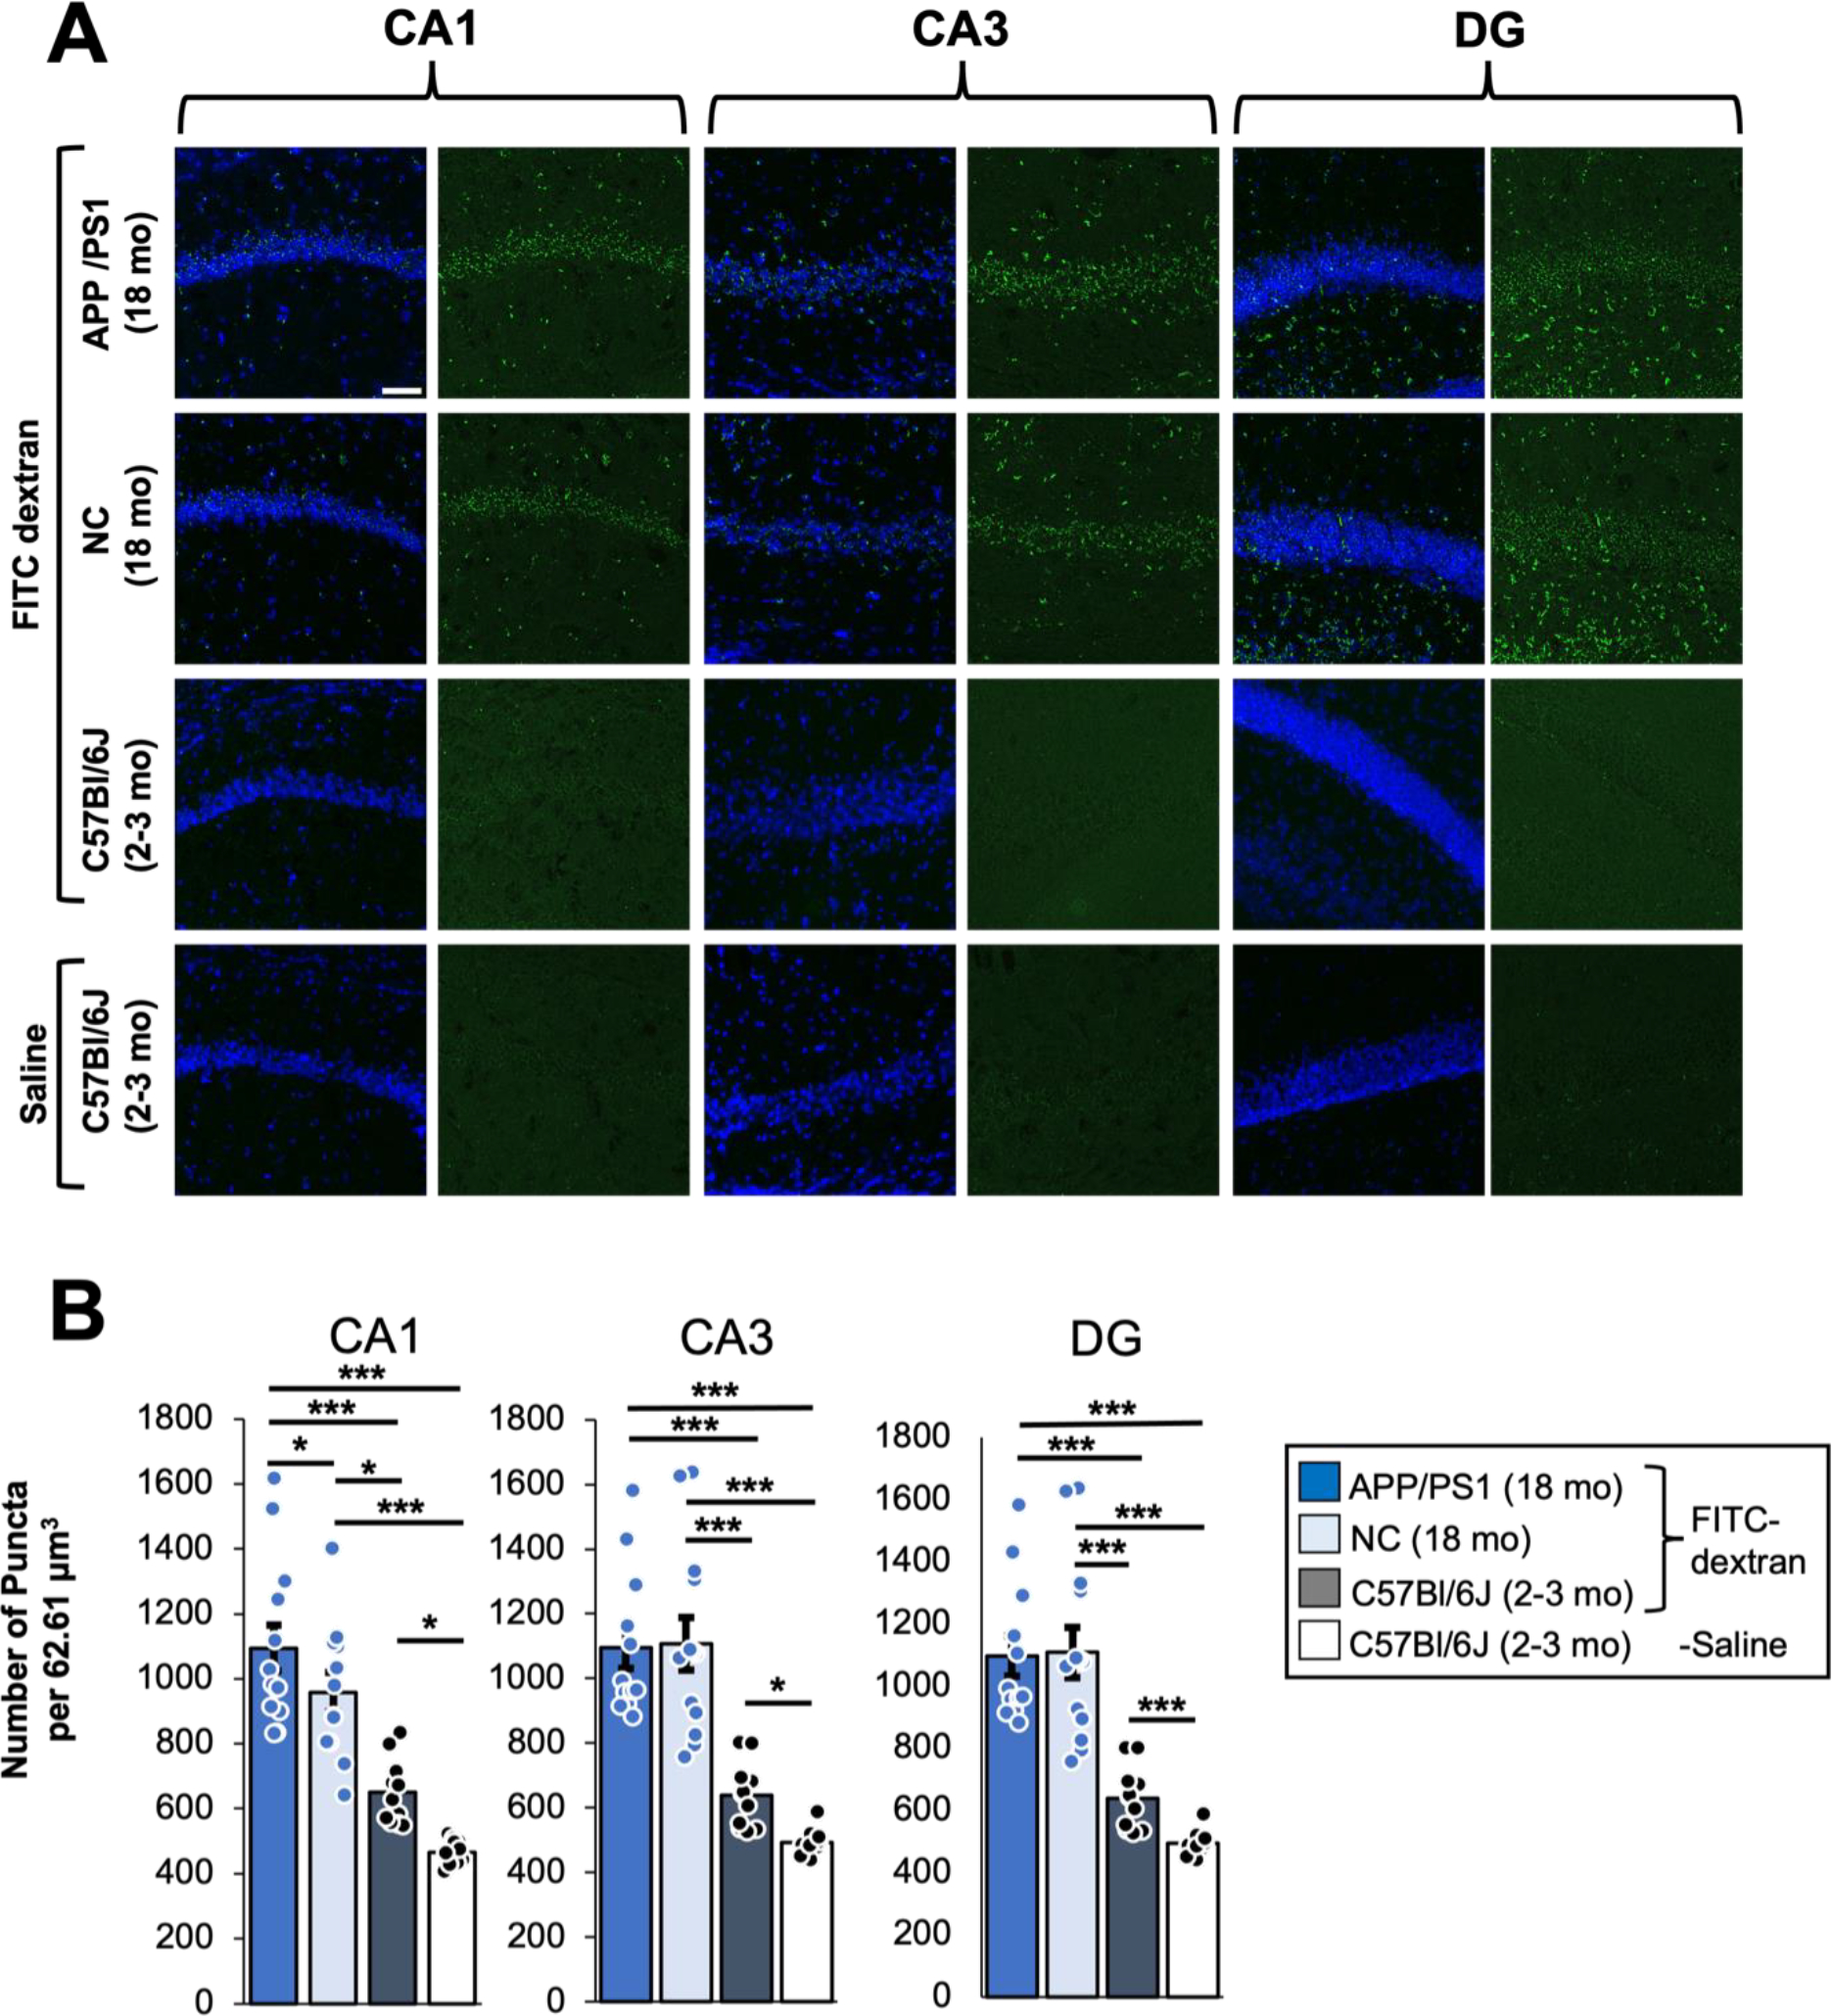
Nanoparticles have emerged as potential transporters of drugs targeting Alzheimer's disease (AD), but their design should consider the blood-brain barrier (BBB) integrity and neuroinflammation of the AD brain. This study presents that aging is a significant factor for the brain localization and retention of nanoparticles, which we engineered to bind with reactive astrocytes and activated microglia. We assembled 200 nm-diameter particles using a block copolymer of poly(lactic-co-glycolic acid) (PLGA) and CD44-binding hyaluronic acid (HA). The resulting PLGA-b-HA nanoparticles displayed increased binding to CD44-expressing reactive astrocytes and activated microglia. Upon intravascular injection, nanoparticles were localized to the hippocampi of both APP/PS1 AD model mice and their control littermates at 13-16 months of age due to enhanced transvascular transport through the leaky BBB. No particles were found in the hippocampi of young adult mice. These findings demonstrate the brain localization of nanoparticles due to aging-induced BBB breakdown regardless of AD pathology.

Keywords: Alzheimer’s disease; PLGA nanoparticles; aging; blood-brain barrier; hyaluronic acid; reactive astrocytes.


Conflict of interest statement

CONFLICT OF INTEREST

The authors declare that the research was conducted in the absence of any commercial or financial relationships that could be construed as a potential conflict of interest.

Figures

Figure 1.
Figure 1.. Synthesis and Characterization of PLGA-b-HA nanoparticles.
(A) A schematic illustration of PLGA-b-HA nanoparticles penetrating the blood-brain barrier (BBB) in aged or diseased conditioned and their subsequent binding to the reactive astrocytes and microglia. Created with BioRender.com (B) Illustration of double emulsion process to prepare PLGA-b-HA particles encapsulating AF488-conjugated BSA (W: water phase; O: oil phase). (C) Transmission electron microscopic image of PLGA-b-HA nanoparticle. (D) Size distribution of PLGA-b-HA nanoparticles analyzed via dynamic light scattering.
Figure 2.
Figure 2.. PLGA-b-HA particles preferentially bind to TNF-⍺-stimulated reactive astrocytes and LPS-stimulated microglia that express CD44.
(A) TNF⍺-activated CD44 expression of NSC-derived astrocytes. Immunofluorescence images of astrocytes without or with 24 h TNF-⍺ treatment. Astrocytes were labeled with GFAP antibody (red), CD44 was labeled with CD44 antibody (green), and nuclei were stained with DAPI (blue). (B) Relative CD44-encoding mRNA expression level and (C) CD44 expression area of NSCs-derived astrocyte without (Control) and with TNF-⍺ treatment. (D) Immunofluorescence images of nanoparticles associating with reactive or untreated astrocytes. 0.5 mg/mL of PLGA particles or PLGA-b-HA particles were incubated with untreated or TNF-⍺-treated astrocytes for 20 minutes. Both PLGA and PLGA-b-HA particles were encapsulated with AF488 (Green)-conjugated BSA. Astrocytes were colored in red, and the nuclei were labeled in blue. (E) Quantitative analysis of PLGA-b-HA nanoparticles bound to astrocytes treated with/without TNF-⍺. The binding area of the PLGA-b-HA particles was normalized to the binding area observed on untreated astrocytes. (F) Quantitative analysis of PLGA and PLGA-b-HA nanoparticle bound to TNF-⍺-treated astrocytes. Particle binding area on activated astrocytes was normalized to that of PLGA particles. (G) LPS enhanced CD44 expression of microglia. Immunofluorescence images of microglia after 24 hours without or with 10 ng/mL LPS stimulation. Microglia were labeled with IBA1 antibody(red), CD44 was labeled with CD44 antibody (green), and nuclei were stained with DAPI (blue). (H) Relative CD44 expression area normalized by microglia cell number without (Control) and with hours LPS treatment (LPS). (n > 8, * = p < 0.05) (I) TNF-⍺ concentration in the medium of microglia cultured without (Control) and with LPS for 24 hours (LPS). (n = 3, * = p < 0.05) (J) Immunofluorescence images of particles binging to LPS-treated microglia. PLGA-b-HA particles encapsulating AF 488-conjugated BSA were incubated with untreated or LPS-treated microglia for 20 minutes. Particles binding to the microglia were presented in green, microglia were presented in red, and the nucleus were presented in blue. (K) Analysis of PLGA-b-HA particle binding area on microglia without (Control) or with LPS treatment (LPS). The binding area was divided by total cell number in each view and normalized to the value of the control group. (n > 8, * = p < 0.05) Data represent the mean ± SEM. Unpaired Student t-test results are shown (n > 4, *p < 0.05).
Figure 3.
Figure 3.. Intravenously injected PLGA-b-HA nanoparticles localize to the brain in aged APP/PS1 and control mice but not young adult mice.
Mice received an i.v. injection of saline or PLGA-b-HA particles encapsulating AF647-conjugated BSA (Dose: 16 mg/kg). At 2 h post injection, various organs were quickly dissected and imaged using IVIS. All images were taken with an excitation wavelength of 640 nm and an emission wavelength of 680 nm. (A) Representative ex vivo fluorescence images of the organs of 3–5-month-old wild-type mice receiving saline (n = 3 mice), 5-month-old young C57BL/6J mice receiving fluorescent PLGA-b-HA particles (n = 3 mice), 3–4-month-old young APP/PS1 mice receiving fluorescent PLGA-b-HA particles (n = 3 mice), 15–17-month-old APP/PS1 mice receiving fluorescent PLGA-b-HA particles (n = 3 mice), and 15–17-month-old non-carrier (NC) control littermates receiving fluorescent PLGA-b-HA particles (n = 3 mice). (B) Quantification of particle fluorescent intensity per unit area in brain and other organs. Data represents the mean ± SEM. One-way ANOVA with Tukey Post Hoc test results are shown (*p<0.05; ***p<0.001).
Figure 4.
Figure 4.. Intravenously injected PLGA-b-HA nanoparticles localize to the hippocampi of both aged APP/PS1 mice and their control littermates but not young adult mice.
(A) Coronal brain cryosections were immunostained for Aβ and counterstained with nuclear marker Hoechst 33342. Extracellular senile Aβ plaques were observed in all areas of the hippocampi of aged APP/PS1 mice (13–16-month-old), but not in the age-matched non-carrier (NC) mice (13–16-month-old) or young APP/PS1, NC control, and C57BL/6J mice (3–5-month-old). Confocal z-stack images (an optical section of 1.0 μm) were collected from the CA1, CA3, and Dente gyrus (DG) regions of the hippocampus and shown as representative images. Image size: 640.17 μm x 640.17 μm. Scale bar: 100μm. (B) Young adult APP/PS1, NC control littermates, and C57BL/6J mice (3–5 mo old), and aged APP/PS1 mice and their NC control littermates (13–17 mo old) received an i.v. injection of saline or PLGA-b-HA particles encapsulating AF488-conjugated BSA (16 mg / kg) via their tail veins. After 2 h, mice were subjected to transcardial perfusion of PBS followed by fixation with 2% PFA. Cryoprotected brain tissues were sectioned to 30 μm coronal sections and counterstained with nuclear marker Hoechst 33342. Confocal images (an optical section of 1.0 μm) were collected from the CA1, CA3, and Dente gyrus (DG) regions of the hippocampus. Image size: 62.68 μm x 62.68 μm x 1.0 μm. Scale: each inset square is 10 μm x 10 μm. (C) Quantification of the average number of particles. Data represents the mean ± SEM. Particles are counted when artificial unit (AU) intensity is 5 standard deviations above the mean intensity for each image using the ThunderStorm plug-in with ImageJ. Sample size in CA1 (z-stack images and particle-injected mice): n = 12 from 3 aged APP/PS1 mice, n = 13 from 3 aged NC mice, n = 22 from 3 adult APP/PS1 mice, n = 12 from 3 adult NC mice, and n = 13 from 3 adult C57BL/6J mice. Sample size in CA3 (z-stack images and particle-injected mice): n = 13 from 3 aged APP/PS1 mice, n = 16 from 3 aged NC mice, n = 15 from 3 adult APP/PS1 mice, n = 12 from 2 adult NC mice, n = 12 from 3 adult C57BL/6J mice. Sample size in DG (z-stack images and particle-injected mice): n = 11 from 3 aged APP/PS1 mice, n = 15 from 3 aged NC mice, n = 16 from 3 adult APP/PS1 mice, n = 13 from 2 adult NC mice, and n = 12 from 3 adult C57BL/6J mice. Sample size of images analyzed for saline-injected mice: CA1 = 13, CA3 = 13, and DG = 12 from 3 adult C57BL/6J mice. One-way ANOVA with Tukey Post Hoc test results are shown (*p<0.05; **p<0.01; ***p<0.001).
Figure 5.
Figure 5.. The BBB leakage are present in aged APP/PS1 mice and their control littermates but not young adult C57BL/6J mice.
Young adult C57BL/6J mice (1.5–2 mo old), aged APP/PS1 mice and their non-carrier (NC) control littermates (18 mo old) received an i.v. injection of 100 μl of FITC-dextran (50 mg/ml, MW 20 kDa,). A separate cohort of young adult C57BL/6J mice (2–3 mo old) received saline injection for negative control groups. After 1 h, mice were subjected to transcardial perfusion of PBS followed by fixation with 2% PFA. Cryoprotected brain tissues were sectioned to 30 μm coronal sections and counterstained with nuclear marker Hoechst 33342. Confocal z-stack images (an optical section of 1.0 μm) were collected from the CA1, CA3, and Dente gyrus (DG) regions of the hippocampus. (A) Representative images showing a maximum projection z-stack of indicated brain regions for FITC-dextran. Scale bar: 50 μm. (B) Quantification of the background subtracted FITC fluorescence intensities within 90 μm2 images which were maximum projected from the z-stack series using Fiji (ImageJ). 3-way ANOVA with age, genotype, and injection type as the three factors with post-hoc Fisher test results. Sample size: 12 z-project (1 μm z step) images between 2 individual mice per condition.

References

    1. Collaborators GBDN, Global, regional, and national burden of neurological disorders, 1990–2016: a systematic analysis for the Global Burden of Disease Study 2016. Lancet Neurol 2019, 18 (5), 459–480. - PMC - PubMed
    1. McKhann G; Drachman D; Folstein M; Katzman R; Price D; Stadlan EM, Clinical diagnosis of Alzheimer’s disease: report of the NINCDS-ADRDA Work Group under the auspices of Department of Health and Human Services Task Force on Alzheimer’s Disease. Neurology 1984, 34 (7), 939–44. - PubMed
    1. 2021 Alzheimer’s disease facts and figures. Alzheimers Dement 2021, 17 (3), 327–406. - PubMed
    1. Espuny-Camacho I; Arranz AM; Fiers M; Snellinx A; Ando K; Munck S; Bonnefont J; Lambot L; Corthout N; Omodho L; Vanden Eynden E; Radaelli E; Tesseur I; Wray S; Ebneth A; Hardy J; Leroy K; Brion J-P; Vanderhaeghen P; De Strooper B, Hallmarks of Alzheimer’s Disease in Stem-Cell-Derived Human Neurons Transplanted into Mouse Brain. Neuron 2017, 93 (5), 1066–1081.e8. - PubMed
    1. Yu D; Zhang H; Liu Z; Liu C; Du X; Ren J; Qu X, Hydrogen-Bonded Organic Framework (HOF)-Based Single-Neural Stem Cell Encapsulation and Transplantation to Remodel Impaired Neural Networks. Angewandte Chemie International Edition 2022, 61 (28), e202201485. - PubMed

Publication types

Substances