

A multiscale model of the role of microenvironmental factors in cell segregation and heterogeneity in breast cancer development
- PMID: 37992135
- PMCID: PMC10699633
- DOI: 10.1371/journal.pcbi.1011673
A multiscale model of the role of microenvironmental factors in cell segregation and heterogeneity in breast cancer development
Abstract
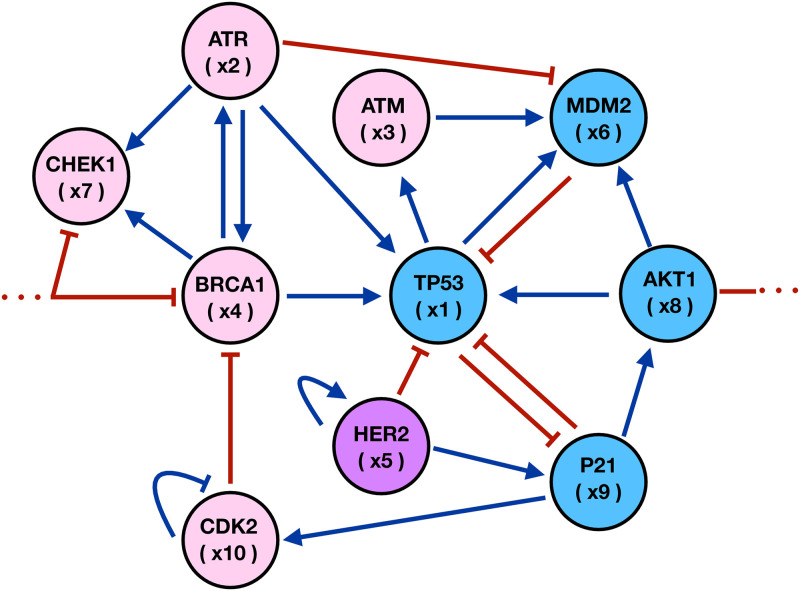
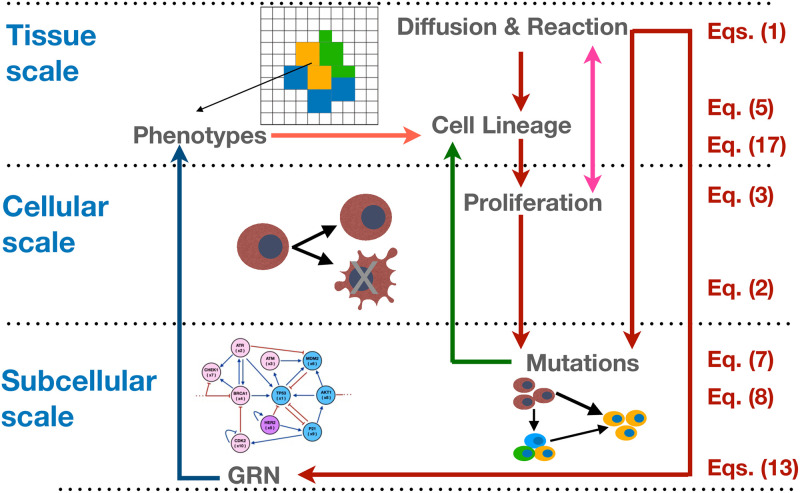
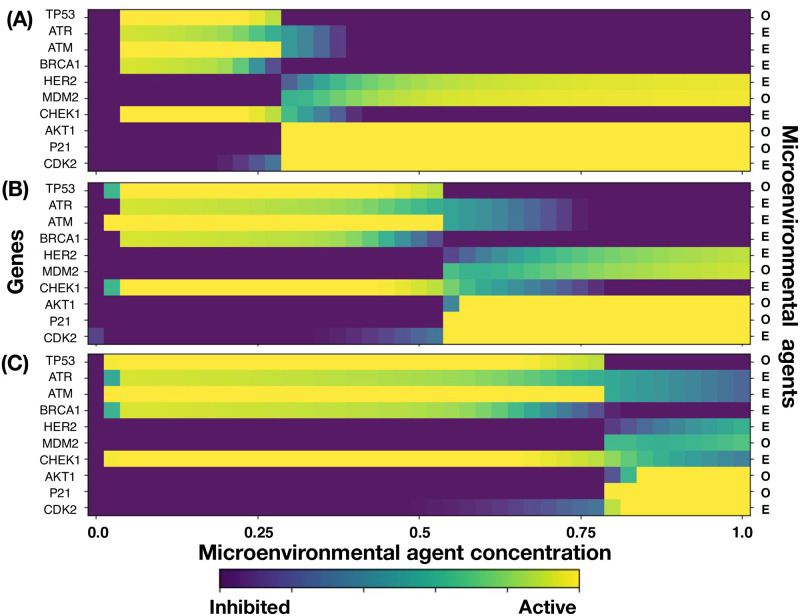
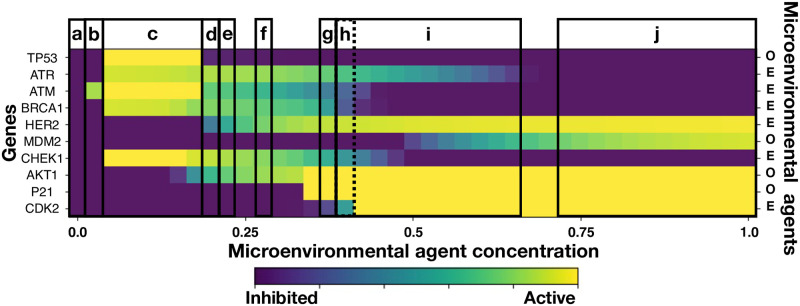
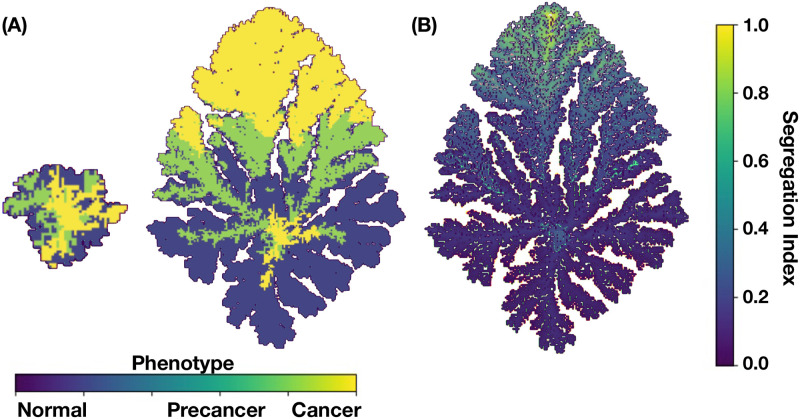
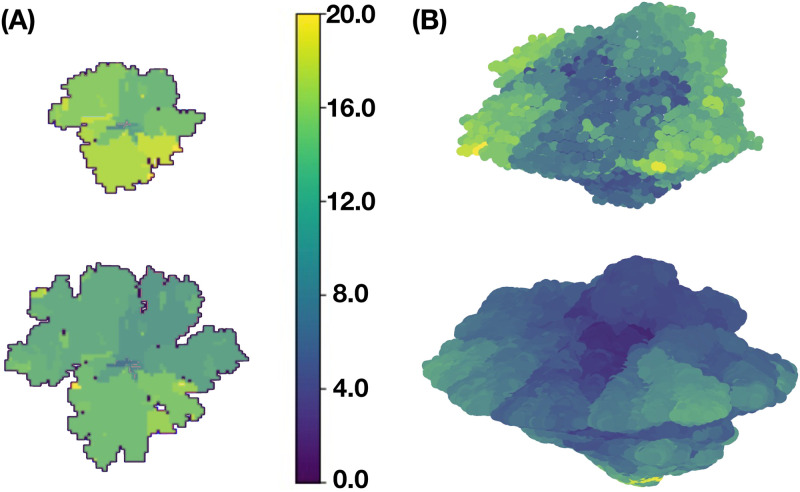
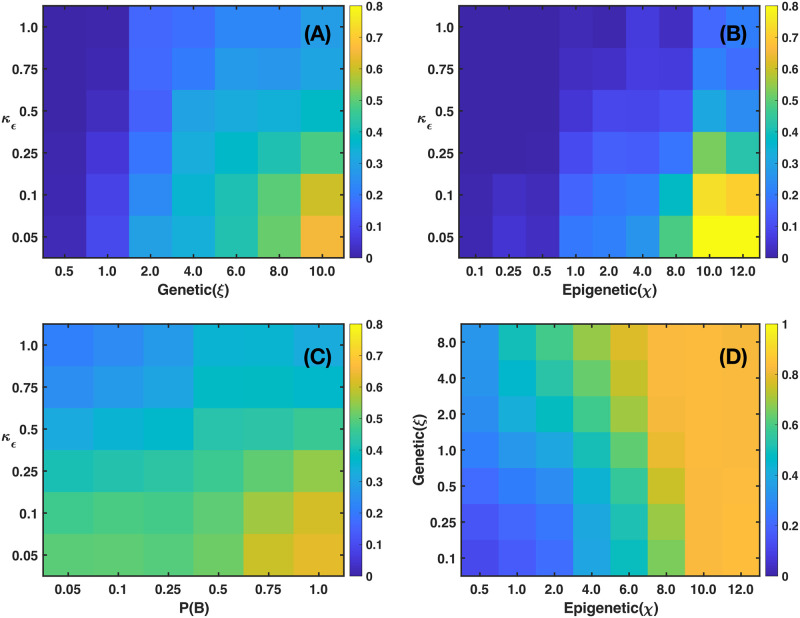
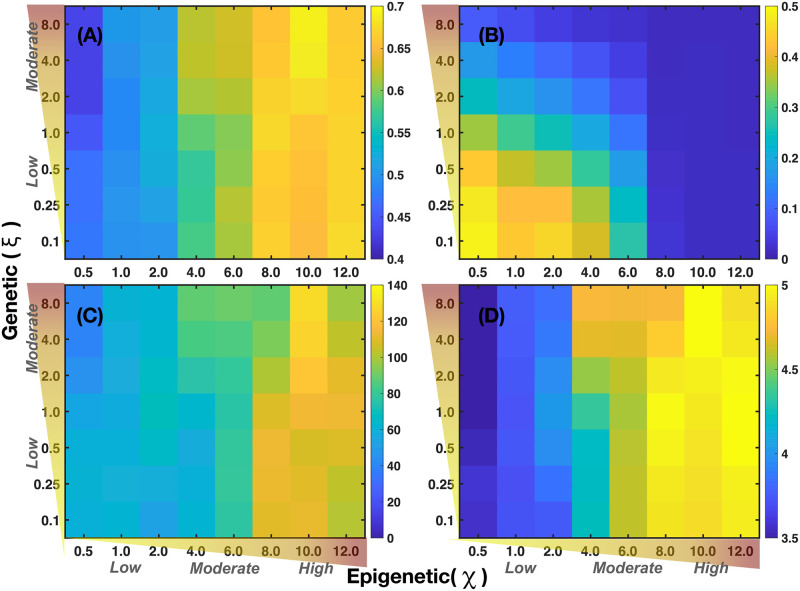
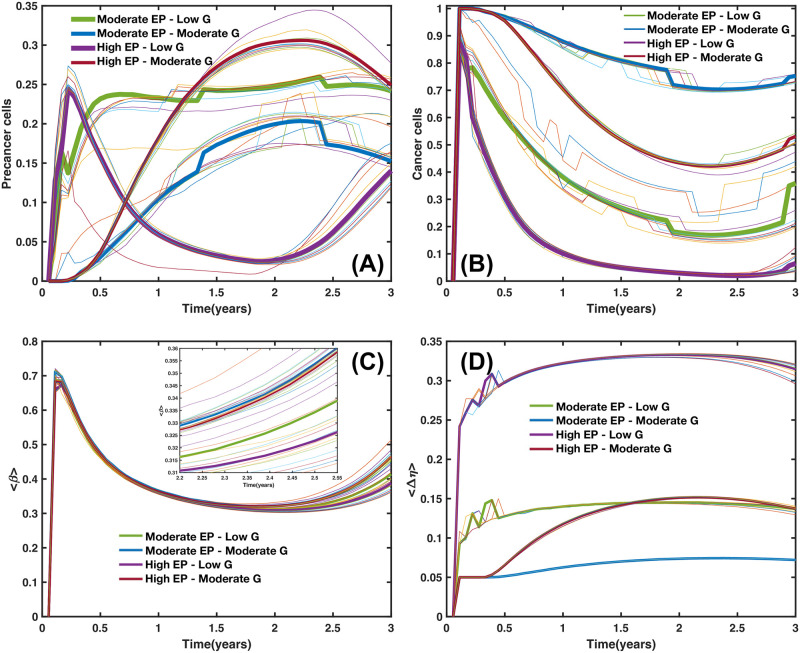
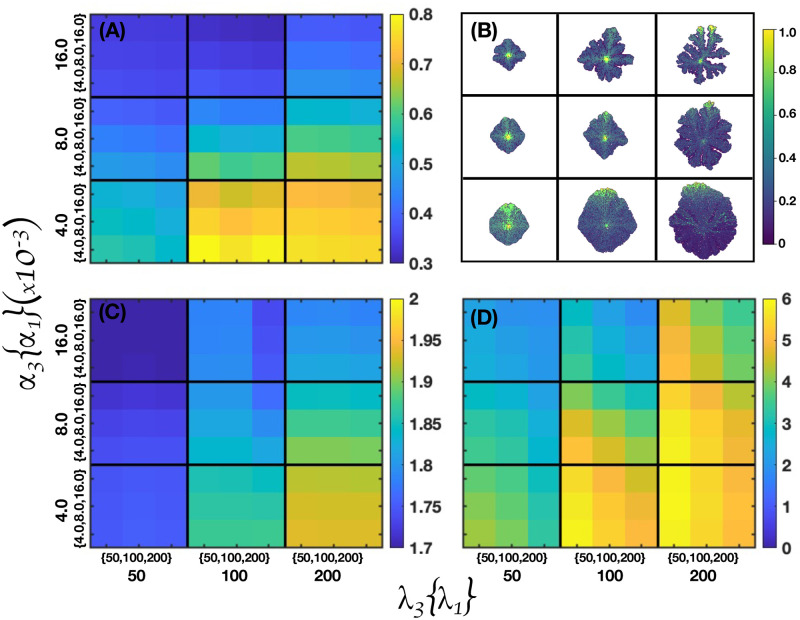
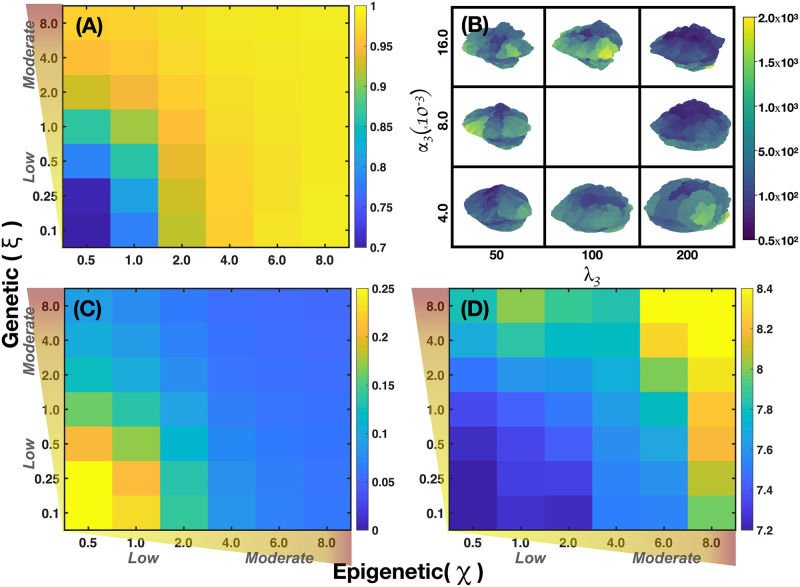
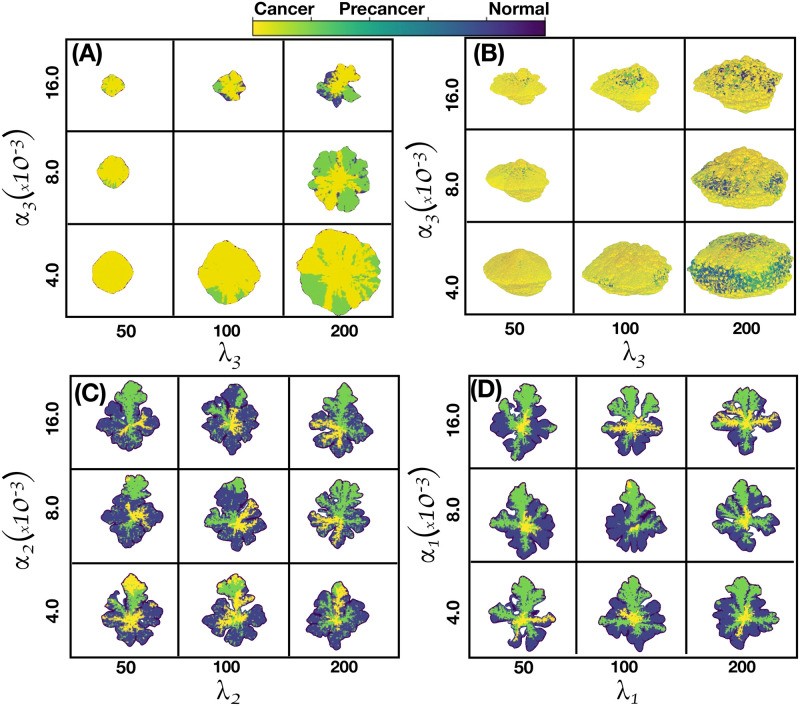
We analyzed a quantitative multiscale model that describes the epigenetic dynamics during the growth and evolution of an avascular tumor. A gene regulatory network (GRN) formed by a set of ten genes that are believed to play an important role in breast cancer development was kinetically coupled to the microenvironmental agents: glucose, estrogens, and oxygen. The dynamics of spontaneous mutations was described by a Yule-Furry master equation whose solution represents the probability that a given cell in the tissue undergoes a certain number of mutations at a given time. We assumed that the mutation rate is modified by a spatial gradient of nutrients. The tumor mass was simulated by means of cellular automata supplemented with a set of reaction diffusion equations that described the transport of microenvironmental agents. By analyzing the epigenetic state space described by the GRN dynamics, we found three attractors that were identified with cellular epigenetic states: normal, precancer and cancer. For two-dimensional (2D) and three-dimensional (3D) tumors we calculated the spatial distribution of the following quantities: (i) number of mutations, (ii) mutation of each gene and, (iii) phenotypes. Using estrogen as the principal microenvironmental agent that regulates cell proliferation process, we obtained tumor shapes for different values of estrogen consumption and supply rates. It was found that he majority of mutations occurred in cells that were located close to the 2D tumor perimeter or close to the 3D tumor surface. Also, it was found that the occurrence of different phenotypes in the tumor are controlled by estrogen concentration levels since they can change the individual cell threshold and gene expression levels. All results were consistently observed for 2D and 3D tumors.
Copyright: © 2023 Romero-Arias et al. This is an open access article distributed under the terms of the Creative Commons Attribution License, which permits unrestricted use, distribution, and reproduction in any medium, provided the original author and source are credited.
Conflict of interest statement
The authors have declared that no competing interests exist.
Figures
Similar articles
-
Modelling non-homogeneous stochastic reaction-diffusion systems: the case study of gemcitabine-treated non-small cell lung cancer growth.BMC Bioinformatics. 2012;13 Suppl 14(Suppl 14):S14. doi: 10.1186/1471-2105-13-S14-S14. Epub 2012 Sep 7. BMC Bioinformatics. 2012. PMID: 23095709 Free PMC article.
-
Genotoxic metabolites of estradiol in breast: potential mechanism of estradiol induced carcinogenesis.J Steroid Biochem Mol Biol. 2003 Sep;86(3-5):477-86. doi: 10.1016/s0960-0760(03)00377-7. J Steroid Biochem Mol Biol. 2003. PMID: 14623547 Review.
-
Bayesian calibration of a stochastic, multiscale agent-based model for predicting in vitro tumor growth.PLoS Comput Biol. 2021 Nov 29;17(11):e1008845. doi: 10.1371/journal.pcbi.1008845. eCollection 2021 Nov. PLoS Comput Biol. 2021. PMID: 34843457 Free PMC article.
-
A New Mathematical Model for Controlling Tumor Growth Based on Microenvironment Acidity and Oxygen Concentration.Biomed Res Int. 2021 Jan 25;2021:8886050. doi: 10.1155/2021/8886050. eCollection 2021. Biomed Res Int. 2021. PMID: 33575354 Free PMC article.
-
Microenvironmental regulation of estrogen signals in breast cancer.Breast Cancer. 2007;14(2):175-81. doi: 10.2325/jbcs.975. Breast Cancer. 2007. PMID: 17485903 Review.
References
-
- Roose T, Chapman SJ, Maini PK. Mathematical models of avascular tumor growth. SIAM Review. 2007;49:179–208. doi: 10.1137/S0036144504446291 - DOI
-
- Mag S, Iwamoto K, Okada-Hatakeyama M. Current status of mathematical modelling of cancer from the viewpoint of cancer hallmarks. Current Opinion in Systems Biology. 2017;2:39–48. doi: 10.1016/j.coisb.2017.02.008 - DOI
MeSH terms
Substances
LinkOut - more resources
Full Text Sources
Medical
Miscellaneous
