. 2023 Nov 24;9(47):eadi0889.
doi: 10.1126/sciadv.adi0889. Epub 2023 Nov 22.

Augmenting L3MBTL2-induced condensates suppresses tumor growth in osteosarcoma

Affiliations

Augmenting L3MBTL2-induced condensates suppresses tumor growth in osteosarcoma

Li Zhong et al. Sci Adv. .

Abstract

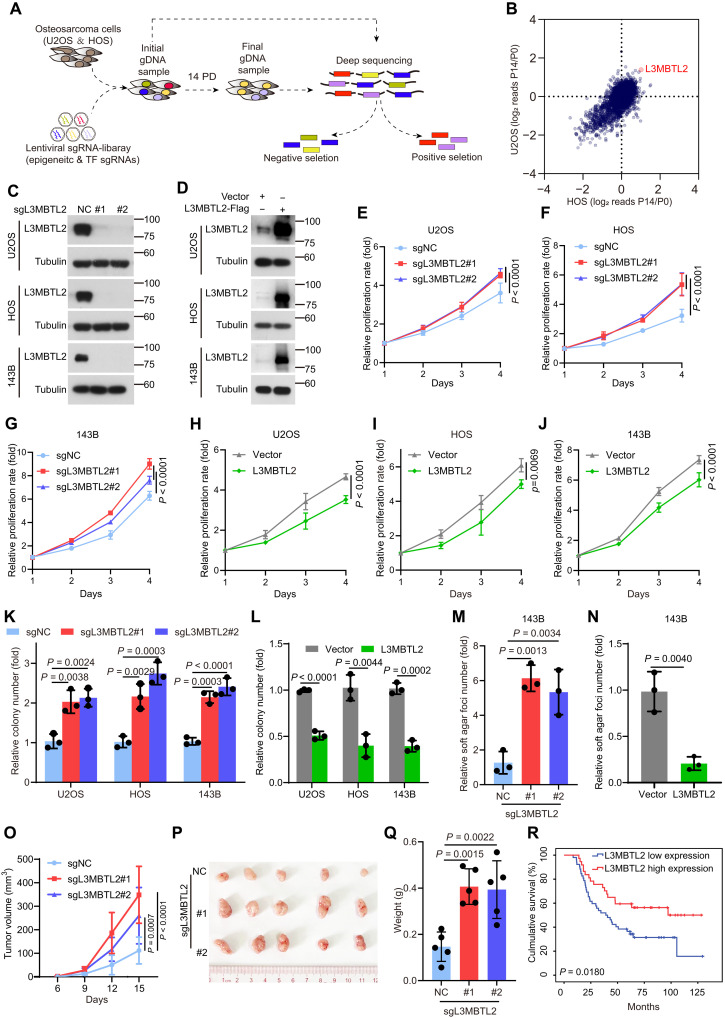
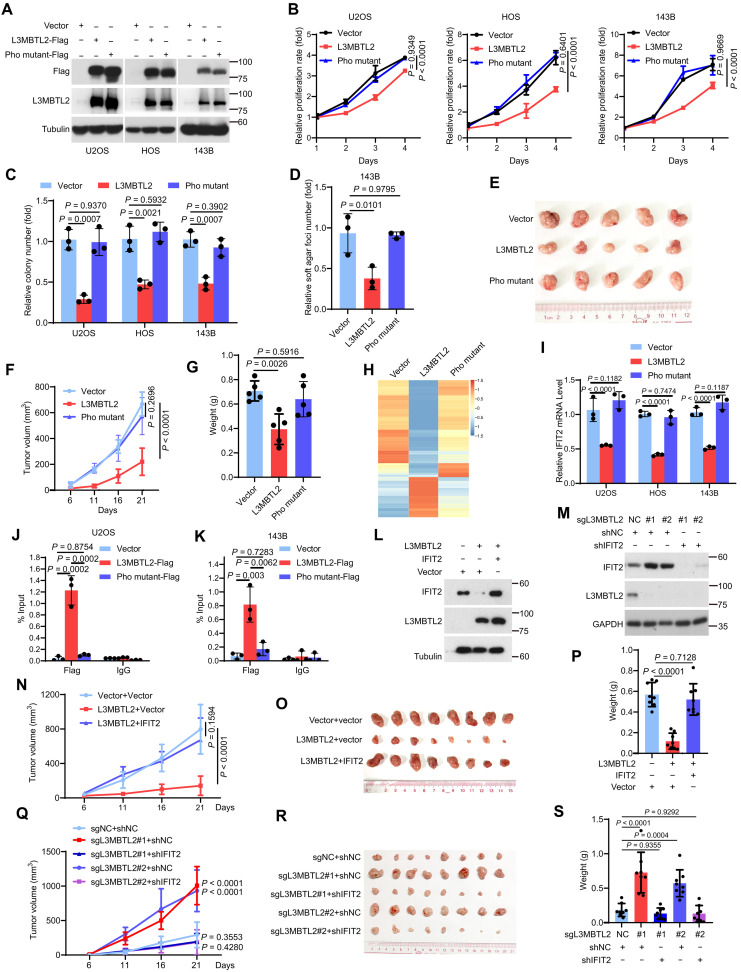
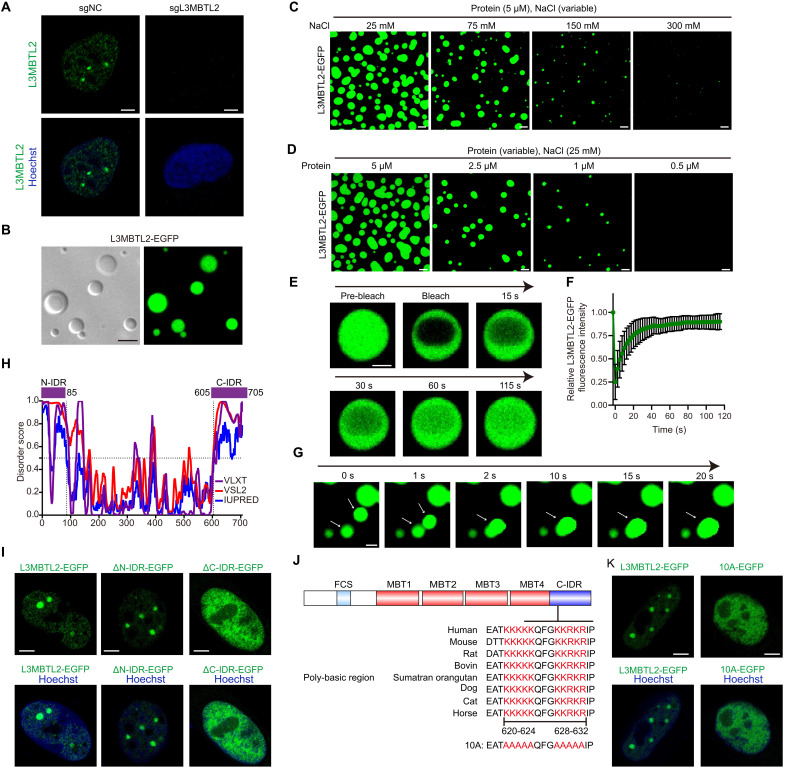
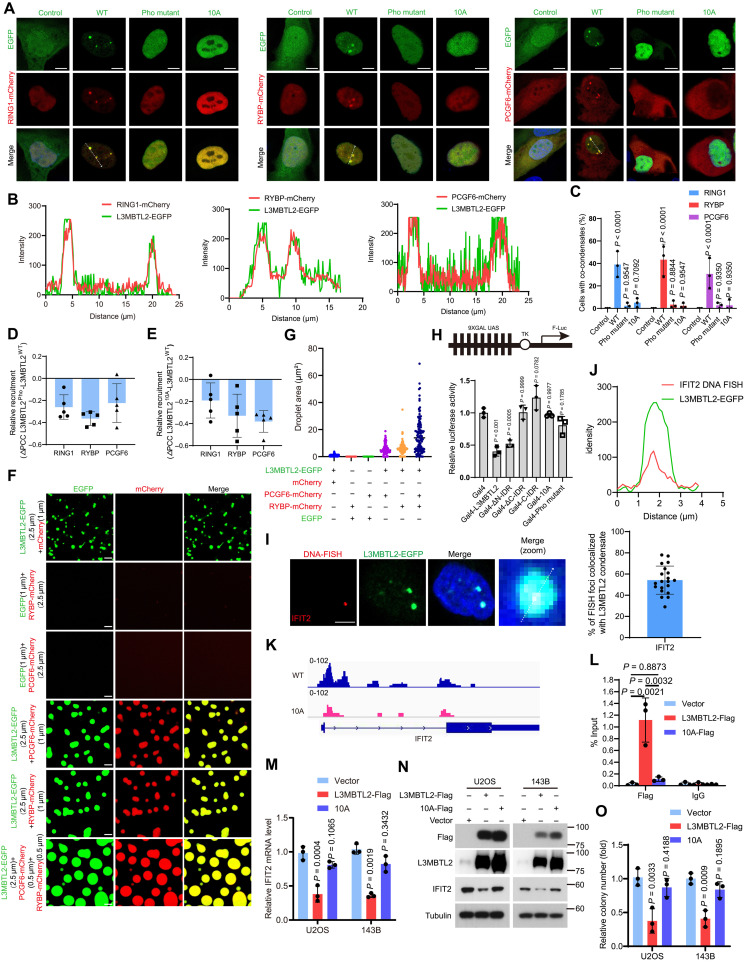
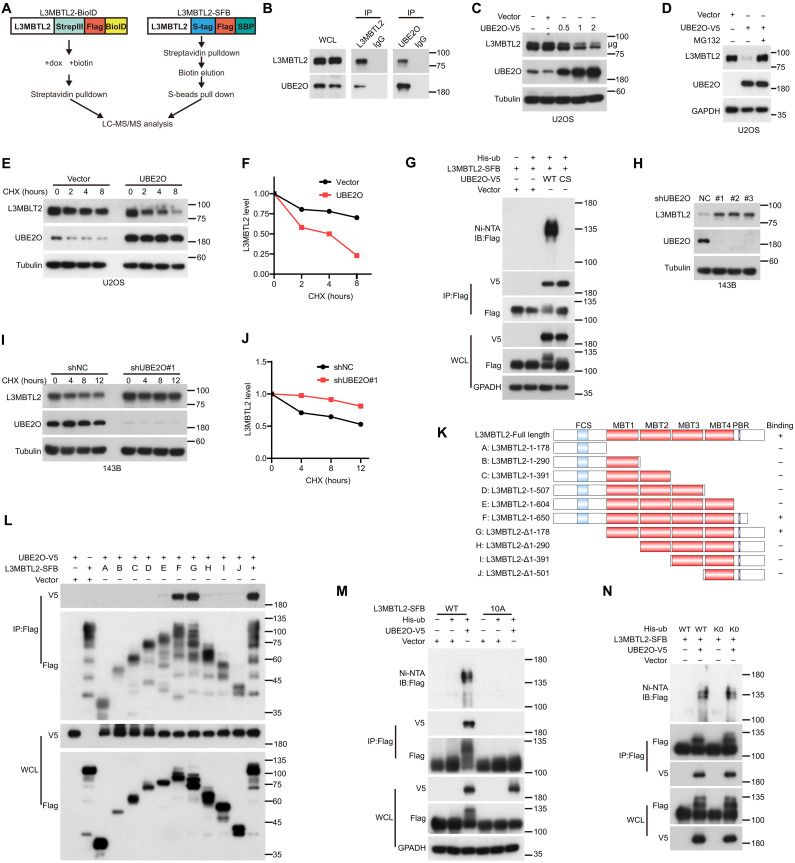
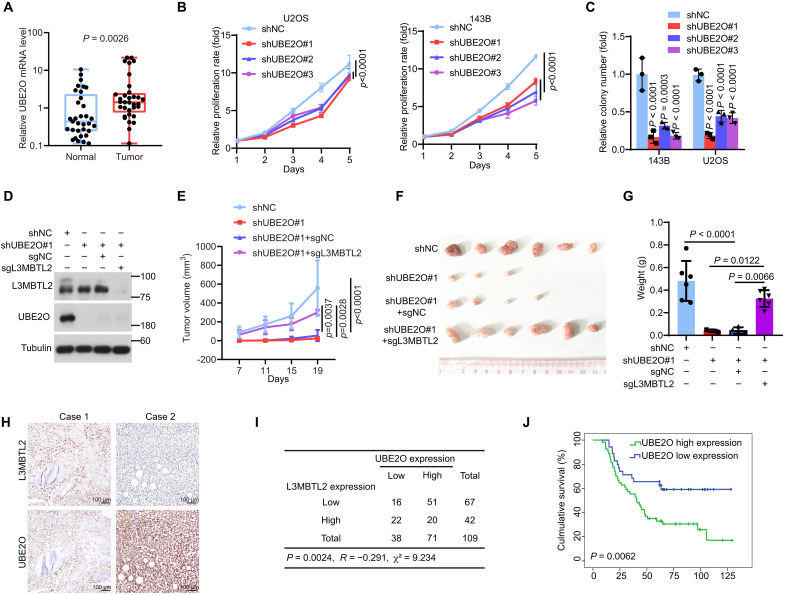
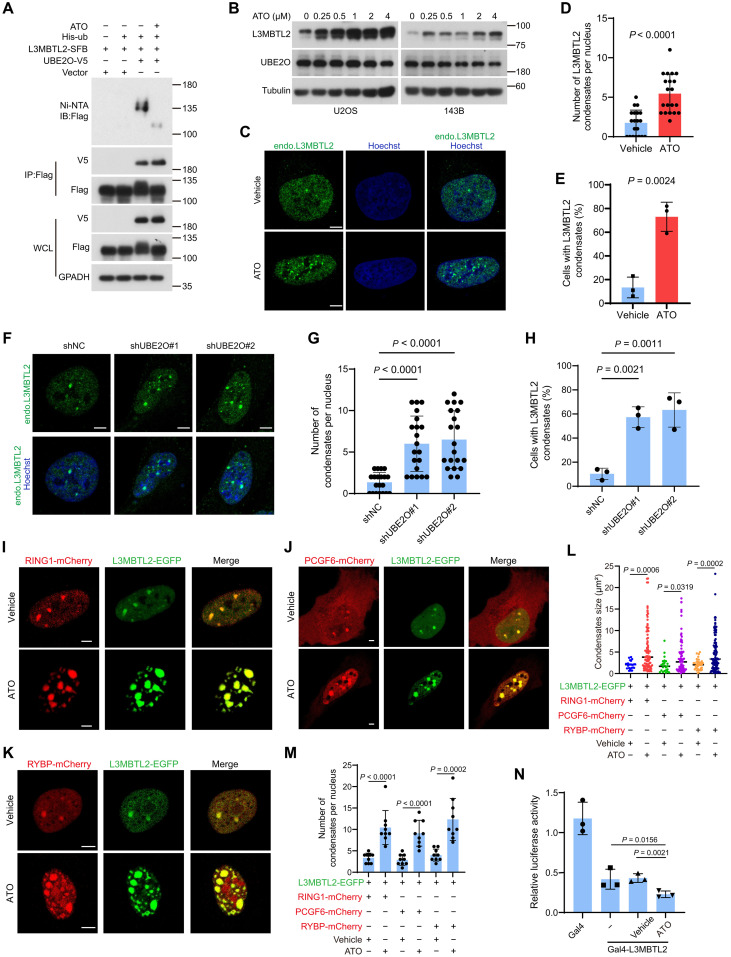
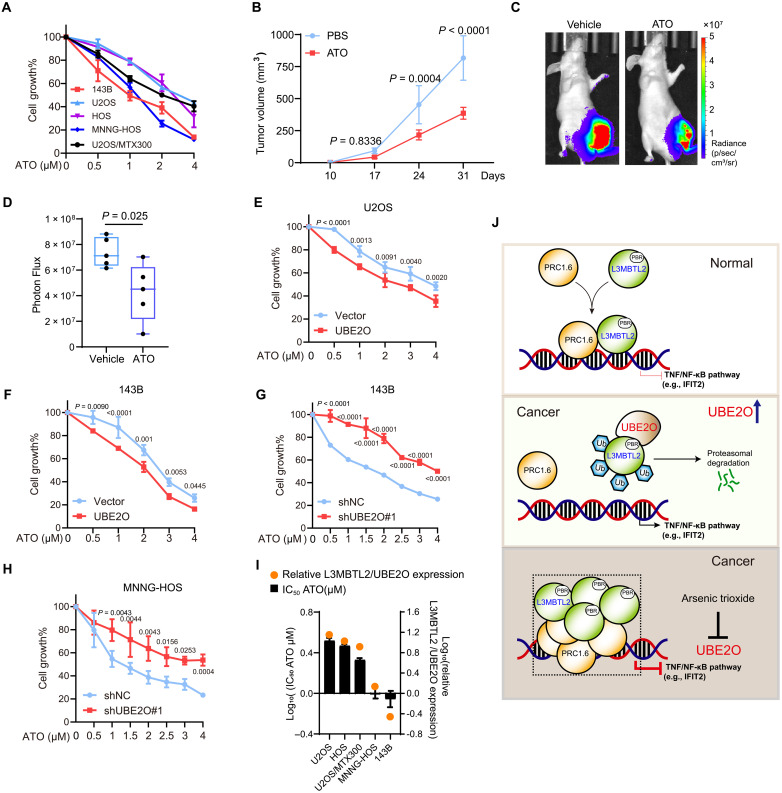
Osteosarcoma is a highly aggressive cancer and lacks effective therapeutic targets. We found that L3MBTL2 acts as a tumor suppressor by transcriptionally repressing IFIT2 in osteosarcoma. L3MBTL2 recruits the components of Polycomb repressive complex 1.6 to form condensates via both Pho-binding pockets and polybasic regions within carboxyl-terminal intrinsically disordered regions; the L3MBTL2-induced condensates are required for its tumor suppression. Multi-monoubiquitination of L3MBTL2 by UBE2O results in its proteasomal degradation, and the UBE2O/L3MBTL2 axis was crucial for osteosarcoma growth. There is a reverse correlation between L3MBTL2 and UBE2O in osteosarcoma tissues, and higher UBE2O and lower L3MBTL2 are associated with poorer prognosis in osteosarcoma. Pharmacological blockage of UBE2O by arsenic trioxide can enhance L3MBTL2-induced condensates and consequently suppress osteosarcoma growth. Our findings unveil a crucial biological function of L3MBTL2-induced condensates in mediating tumor suppression, proposing the UBE2O-L3MBTL2 axis as a potential cancer therapeutic target in osteosarcoma.


Figures

Fig. 1.
Fig. 1.. CRISPR-Cas9 screening of cell viability identifies L3MBTL2 as the tumor suppressor in osteosarcoma.
(A) Schematic of CRISPR screening strategy. (B) Scatter plot comparison of CRISPR screening in U2OS and HOS cells. Plotted is the average log2 fold change in abundance of all sgRNAs targeting a given gene at final (P14) versus initial reference (P0). (C and D) The indicated stable cells were analyzed by Western blotting. Data are representative of n = 3 biologically independent experiments. (E to J) Cell viability of the indicated stable cells was measured by MTT assay at the indicated time points. (K to N) Colony formation (K and L) and anchorage-independent (M and N) assays were performed for the indicated stable cells. The colony numbers per field were counted. Data in (E to N) are means ± SD of n = 3 biologically independent experiments. P values are shown. (O to Q) The indicated 143B stable cells were subcutaneously injected into mice. (O) Tumor size was measured at the indicated time points, and tumors were dissected at the end point. (P) Representative images of subcutaneous xenograft tumors. (Q) Tumor weight was measured at the end point. n = 5 biologically independent mice. Data are means ± SD. P values are shown. (R) Overall survival curves were analyzed on the basis of L3MBTL2 protein levels in patients with osteosarcoma by Kaplan-Meier method. Fifty-two and 37 cases with low and high expression of L3MBTL2, designed as L3MBTL2 low expression and L3MBTL2 high expression, respectively, were plotted, and P values are shown.
Fig. 2.
Fig. 2.. L3MBTL2 suppresses tumor growth by transcriptionally repressing IFIT2, which depends on its Pho-binding pocket.
(A) The indicated stable cells were analyzed by Western blotting. (B) Cell viability of the indicated stable cells was measured by MTT assay at the indicated time points. (C and D) Colony formation (C) and anchorage-independent assay (D) were performed for the indicated stable cells. The colony numbers per field were counted. (E to G) The indicated 143B stable cells were subcutaneously injected into mice. (E) Representative images of subcutaneous xenograft tumors. (F) Tumor size was measured at the indicated time points. (G) Tumor weight was measured at the end point. n = 5 biologically independent mice. Data are means ± SD. P values are shown. (H) The heatmap shows relative expression levels of down- or up-regulated genes in the indicated 143B stable cells. (I) The relative IFIT2 mRNA levels were normalized to the GAPDH levels in the indicated stable cells as determined by RT-qPCR. (J and K) ChIP-qPCR analysis of L3MBTL2-Flag or Pho mutant-Flag occupancy at IFIT2 promoter region in the indicated stable cells. (L and M) The indicated 143B stable cells were analyzed by Western blotting. (N to S) The indicated 143B stable cells were subcutaneously injected into mice. (N and Q) Tumor volumes from mice subcutaneously injected with the indicated stable 143B cells were measured at the indicated days, and tumors were dissected at the end point. (O and R) Representative images of subcutaneous xenograft tumors. (P and S) Tumor weight was measured at the end point. n = 8 biologically independent mice. Data are means ± SD. P values are shown. Data in (A, L and M) are representative of n = 3 biologically independent experiments. Data in (B to D and I to K) are means ± SD of n = 3 biologically independent experiments. P values are shown.
Fig. 3.
Fig. 3.. L3MBTL2 protein forms condensates via both polybasic regions and Pho-binding pocket.
(A) Representative images of immunofluorescence staining for endogenous L3MBTL2 (anti-L3MBTL2, active motif, green) in the indicated U2OS stable cells. (B) Representative differential interference contrast (left) and fluorescence (right) microscopy images of 10 μM purified L3MBTL2-EGFP in the phase separation buffer with 25 mM NaCl for 1 min at 25°C. (C) Representative images of 5 μM purified L3MBTL2-EGFP in the phase separation buffer with the indicated NaCl concentration and 1% (w/v) PEG-6000 for 1 min at 25°C. (D) Representative images of purified L3MBTL2-EGFP at the indicated protein concentration in the phase separation buffer with 25 mM NaCl and 1% (w/v) PEG-6000 for 1 min at 25°C. (E) Representative FRAP recovery images of L3MBTL-EGFP droplets in the phase separation buffer with 50 mM NaCl and 1% PEG-6000 at the indicated times. Scale bar, 2.5 μm. (F) Relative quantification of FRAP recovery kinetics of L3MBTL2-EGFP droplets averaged from n = 12 biologically independent experiments. Data are means ± SD. (G) Representative time-lapse images showing fusion of two droplets formed by 5 μM L3MBTL-EGFP proteins in the phase separation buffer with 50 mM NaCl and 1% (w/v) PEG-6000 for 1 min at 25°C. Scale bar, 2 μm. (H) Analysis of the intrinsically disorder tendency of L3MBTL2 by using PONDR and IUPred2. (I) Representative images of U2OS cells transiently expressing L3MBTL2 wild type (1 to 705 amino acids), ΔN-IDR (86 to 705 amino acids), or ΔC-IDR (1 to 604 amino acids) fused to EGFP. (J) Conservation of PBR sequences (620 to 624 and 628 to 632 amino acids) within L3MBTL2 C-IDR across homologs. 10A: Ten K or R in PBR of L3MBTL2 were mutated to A. (K) Representative images of U2OS cells transiently expressing L3MBTL2 wild type or 10A mutant fused to EGFP. Data in (A to D, G, I, and K) are representative of n = 3 biologically independent experiments. Scale bars, 5 μm (A to D, I, and K).
Fig. 4.
Fig. 4.. L3MBTL2 condensates execute its tumor suppression by selectively enriching the components of PRC1.6 complex.
(A) Representative images of U2OS cells cotransfected with the indicated plasmids for 24 hours. Scale bars, 5 μm. (B) Line scan analysis of the fluorescence intensity along with the indicated line in (A). (C) Percentage of n = 100 cells with co-condensates in the indicated cells from (A). (D and E) Relative change in recruitment of the indicated PRC1.6-mCherry for L3MBTL2 wild type, Pho (D), or 10A (E). n = 5. means ± SD. (F) Representative images of the indicated proteins in the phase separation buffer with 25 mM NaCl for 1 min at 25°C. Scale bars, 5 μm. (G) Quantification of the droplets area in (F) was calculated. (H) HEK293T cells were transfected with the indicated constructs, along with the 9xGal-TK-luc reporter and the Renilla control reporter for 24 hours. Then, cells were analyzed for the relative luciferase activity. (I) Left: Confocal images of L3MBTL2-EGFP condensates and IFIT2 loci by DNA FISH in U2OS cells stably expressing pTeton-L3MBTL2-EGFP. Right: Quantification of DNA FISH foci colocalized with L3MBTL2 nuclear condensate (n = 20). Scale bar, 5 μm. (J) Line scan analysis of the fluorescence intensity along with the indicated line in (I). (K) Genome browser screenshots of CUT&Tag tracks illustrating binding of L3MBTL2 wild type and 10A to the IFIT2 promoter in the indicated 143B stable cells. (L) Chip-qPCR analysis of L3MBTL2 occupancy at IFIT2 promoter region in the indicated stable cells. n = 3. means ± SD. (M) The relative IFIT2 mRNA levels were normalized to the GAPDH levels in the indicated stable cells, as determined by RT-qPCR. n = 3. means ± SD. (N) The indicated stable cells were analyzed by Western blotting. (O) Colony formation assays were performed for the indicated stable cells. n = 3. means ± SD. Data in (A, C, F, I, and N) are representative of n = 3 biologically independent experiments.
Fig. 5.
Fig. 5.. UBE2O multi-monoubiquitinates and degrades L3MBTL2 via binding the polybasic regions of L3MBTL2.
(A) Schematic description of mass spectrometry strategies. Left: L3MBTL2 fused to proximity-dependent biotin identification (BioID) protein. Right: L3MBTL2 fused to tandem affinity purification tag (SFB). (B). The co-IPs were performed using U2OS cells with anti-L3MBTL2, anti-UBE2O, or anti-IgG. WCL, whole cell lysate. (C) U2OS cells were transfected with UBE2O-V5 at the indicated concentrations for 48 hours and then were analyzed by Western blotting. (D) U2OS cells transfected with vector or UBE2O-V5 were incubated with or without MG132 for 8 hours and then were analyzed by Western blotting. (E) U2OS cells transfected with vector or UBE2O were incubated with cycloheximide (CHX; 20 μg/ml) for the indicated time points and then were analyzed by Western blotting. (F) Quantitation of L3MBTL2 protein levels in (E). (G, M, and N) HEK293T cells were cotransfected with the indicated plasmids for 48 hours and then were analyzed by immunoprecipitation using Ni-NTA (nitrilotriacetic acid) beads or anti-Flag beads followed by Western blotting. Ni-NTA, Ni2+-NTA. WT: UBE2O wild type (G), L3MBTL2 wild type (M), or ubiquitin wild type (N). CS (G): UBE2O catalytic mutant, C1040S; 10A (M): Ten K or R in PBR of L3MBTL2 were mutated to A; or K0 (N): ubiquitin lysine-deficient mutant. (H) The indicated 143B stable cells were analyzed by Western blotting. (I) The indicated 143B stable cells were treated with CHX (20 μg/ml) for the indicated time points and then were analyzed by Western blotting. (J) Quantitation of L3MBTL2 protein levels in (I). (K) Schematic description of L3MBTL2-SFB truncations used for co-IP assays with UBE2O-V5. (L) HEK293T cells were cotransfected with the indicated plasmids and then were analyzed by immunoprecipitation using anti-Flag beads followed by Western blotting. Data in (B to J and L to N) are representative of n = 3 biologically independent experiments.
Fig. 6.
Fig. 6.. UBE2O promotes tumor growth by mainly degrading L3MBTL2 in osteosarcoma.
(A) UBE2O mRNA levels were normalized to GAPDH levels in the paired osteosarcoma and normal tissues as determined by RT-qPCR. n = 33. Data are means ± SD. P values are shown. (B) Cell viability of the indicated stable cells was measured by MTT assay at the indicated time points. (C) Colony formation assay was performed for the indicated stable cells. The colony numbers per field were counted. Data in (B and C) are means ± SD of n = 3 biologically independent experiments. P values are shown. (D) The indicated 143B stable cells were analyzed by Western blotting. Data are representative of n = 3 biologically independent experiments. (E to G) The indicated 143B stable cells were subcutaneously injected into mice. (E) Tumor growth was measured at the indicated time points. (F) Representative images of xenograft tumors. (G) Tumor weight was measured at the end point. n = 6 biologically independent mice. Data are means ± SD. P values are shown. (H) Representative immunohistochemical images of both L3MBTL2 and UBE2O from 109 osteosarcoma tissues. (I) The correlation between L3MBTL2 and UBE2O protein levels in 109 osteosarcoma tissues from (I). P = 0.002, chi-square tests. R: Spearman correlation coefficient. (J) Overall survival curves were analyzed on the basis of UBE2O protein levels in patients with osteosarcoma by Kaplan-Meier method. Thirty-five and 54 cases with low and high expression of UBE2O, designed as UBE2O low expression and UBE2O high expression, respectively, were plotted, and P values are shown.
Fig. 7.
Fig. 7.. ATO stabilizes L3MBTL2 protein and augments the L3MBTL2-induced condensates.
(A) HEK293T cells were cotransfected the indicated plasmids for 48 hours and then were analyzed by immunoprecipitation using Ni-NTA and anti-FLAG beads followed by Western blotting. WCL, whole cell lysate. (B) U2OS and 143B cells were treated with increasing concentration of ATO for 12 hours and then were analyzed by Western blotting. (C) Representative images of immunofluorescence staining for endogenous L3MBTL2 in U2OS cells treated with ATO (1 μM) or vehicle for 12 hours. Scale bars, 5 μm. (D) Quantification of the numbers of L3MBTL2 condensate in cells from (C). Data are means ± SD of n = 20 cells. (E) Percentage of n = 100 cells with L3MBTL2 condensates in cells from (C). Data are means ± SD of n = 3 biologically independent experiments. (F) Representative images of immunofluorescence staining for endogenous L3MBTL2 in the indicated 143B stable cells. Scale bars, 5 μm. (G) Quantification of the numbers of L3MBTL2 condensate per nucleus in the indicated 143B stable cells (F). Data are means ± SD of n = 20 cells. (H) Percentage of n = 100 cells with L3MBTL2 condensates in the indicated 143B stable cells from (F). Data are means ± SD of n = 3 biologically independent experiments. (I to K) Representative fluorescence microscopy images of condensates formed by L3MBTL2-EGFP with Ring1-mCherry (I), PCGF6-mCherry (J), or RYBP-mCherry (K) in U2OS cells treated with ATO (1 μM) for 12 hours. Scale bars, 5 μm. Data in (A to C, F, and I to K) are representative of n = 3 biologically independent experiments. (L and M) Quantification of the size (L) and number (M) of the condensates from (I to K). Data are means ± SD of n = 10 cells. (N) HEK293T cells were transfected with the indicated constructs, along with the 9xGal-TK-luc reporter and the Renilla control reporter for 24 hours. Then, cells transfected with Gal4-L3MBTL2 were treated with or without ATO for 12 hours and analyzed for luciferase activity.
Fig. 8.
Fig. 8.. ATO suppresses cell proliferation and tumor growth through the UBE2O/L3MBTL2 axis in osteosarcoma.
(A) The indicated osteosarcoma cell lines were treated with the indicated concentration of ATO for 48 hours, and then, cell viability was determined by MTT assay. (B to D) 143B-Luc cells were orthotopically injected into mice. Starting on day 7, mice were treated with ATO (2 mg/kg, daily) by intraperitoneal injection. (B) Tumor growth was measured at the indicated time points. (C) Representative bioluminescence images of mice at the end point. (D) Automated quantification of bioluminescence images. n = 5 biologically independent mice. Data are means ± SD. P values are shown. (E to H) The indicated stable cells were treated with the indicated concentration of ATO for 48 hours, and then, cell viability was determined by MTT assay. (I) Median inhibitory concentration (IC50) values of ATO in the indicated osteosarcoma cell lines as determined by MTT assay, and the log10 both IC50 of ATO and relative protein levels of L3MBTL2 to UBE2O (L3MBTL2/UBE2O) in each cell line were plotted. (J) A proposed model for function and regulation of L3MBTL2 phase separation in osteosarcoma. In normal condition, L3MBTL2 forms nuclear condensates with other components of the PRC1.6 complex to transcriptionally repress TNF/NF-κB pathways (e.g., IFIT2). UBE2O, a E2/E3 hybrid ubiquitin-protein ligase, is highly expressed in osteosarcoma, and multi-monoubiquitinates and degrades L3MBTL2 via specifically binding to polybasic region (PBR) of L3MBTL2, and consequently promotes tumor growth by activating the TNF/NF-κB pathways (e.g., IFIT2). ATO, the inhibitor of UBE2O, stabilizes L3MBTL2 protein and augments the L3MBTL2-induced co-condensate with the components of PRC1.6 complex, inhibiting the TNF/NF-κB pathways (e.g., IFIT2), subsequently suppress osteosarcoma growth.

Similar articles

Cited by

References

    1. L. Mirabello, R. J. Troisi, S. A. Savage, International osteosarcoma incidence patterns in children and adolescents, middle ages and elderly persons. Int. J. Cancer 125, 229–234 (2009). - PMC - PubMed
    1. P. S. Meltzer, L. J. Helman, New horizons in the treatment of osteosarcoma. N. Engl. J. Med. 385, 2066–2076 (2021). - PubMed
    1. X. Chen, A. Bahrami, A. Pappo, J. Easton, J. Dalton, E. Hedlund, D. Ellison, S. Shurtleff, G. Wu, L. Wei, M. Parker, M. Rusch, P. Nagahawatte, J. Wu, S. Mao, K. Boggs, H. Mulder, D. Yergeau, C. Lu, L. Ding, M. Edmonson, C. Qu, J. Wang, Y. Li, F. Navid, N. C. Daw, E. R. Mardis, R. K. Wilson, J. R. Downing, J. Zhang, M. A. Dyer; St. Jude Children’s Research Hospital–Washington University Pediatric Cancer Genome Project , Recurrent somatic structural variations contribute to tumorigenesis in pediatric osteosarcoma. Cell Rep. 7, 104–112 (2014). - PMC - PubMed
    1. L. C. Sayles, M. R. Breese, A. L. Koehne, S. G. Leung, A. G. Lee, H. Y. Liu, A. Spillinger, A. T. Shah, B. Tanasa, K. Straessler, F. K. Hazard, S. L. Spunt, N. Marina, G. E. Kim, S. J. Cho, R. S. Avedian, D. G. Mohler, M. O. Kim, S. G. DuBois, D. S. Hawkins, E. A. Sweet-Cordero, Genome-informed targeted therapy for osteosarcoma. Cancer Discov. 9, 46–63 (2019). - PMC - PubMed
    1. W. Feng, D. C. Dean, F. J. Hornicek, D. Spentzos, R. M. Hoffman, H. Shi, Z. Duan, Myc is a prognostic biomarker and potential therapeutic target in osteosarcoma. Ther. Adv. Med. Oncol. 12, 1758835920922055 (2020). - PMC - PubMed

Substances