. 2024 Feb 1;30(3):586-599.
doi: 10.1158/1078-0432.CCR-23-0163.

Development of Resistance to Type II JAK2 Inhibitors in MPN Depends on AXL Kinase and Is Targetable

Affiliations

Development of Resistance to Type II JAK2 Inhibitors in MPN Depends on AXL Kinase and Is Targetable

Tamara Codilupi et al. Clin Cancer Res. .

Abstract

Purpose: Myeloproliferative neoplasms (MPN) dysregulate JAK2 signaling. Because clinical JAK2 inhibitors have limited disease-modifying effects, type II JAK2 inhibitors such as CHZ868 stabilizing inactive JAK2 and reducing MPN clones, gain interest. We studied whether MPN cells escape from type ll inhibition.

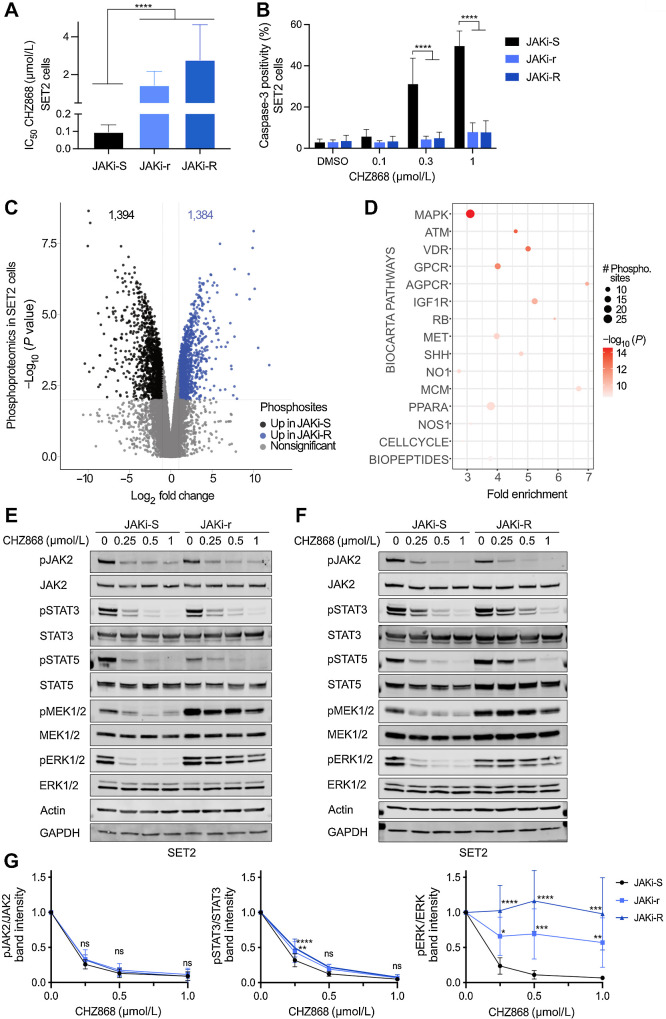
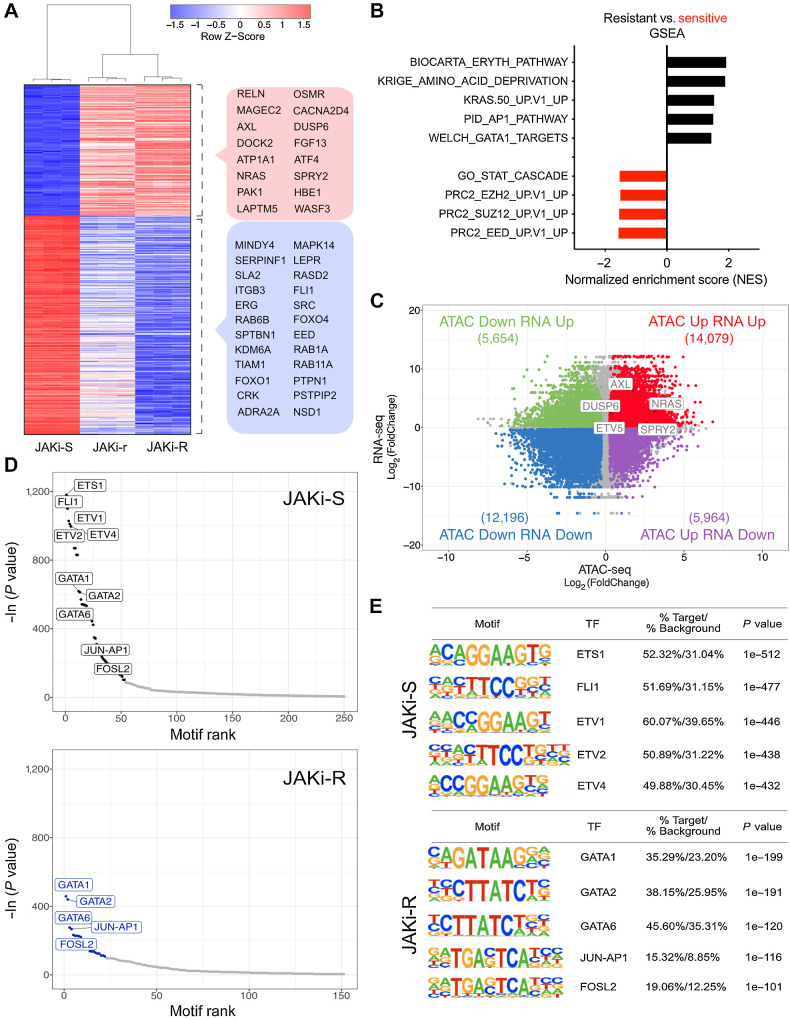
Experimental design: MPN cells were continuously exposed to CHZ868. We used phosphoproteomic analyses and ATAC/RNA sequencing to characterize acquired resistance to type II JAK2 inhibition, and targeted candidate mediators in MPN cells and mice.

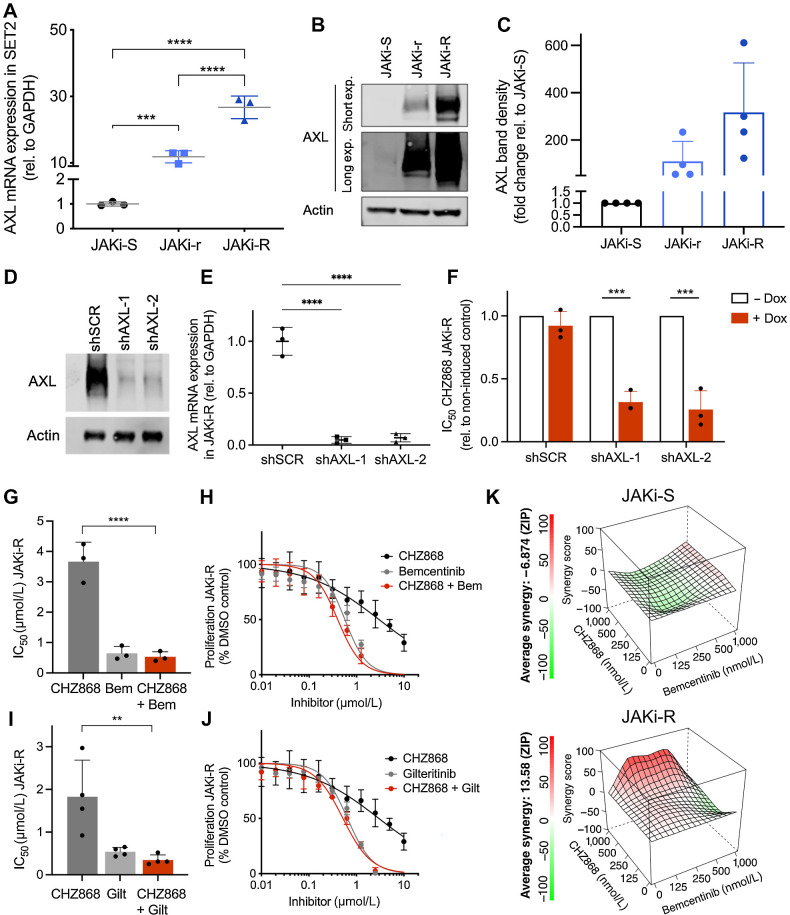
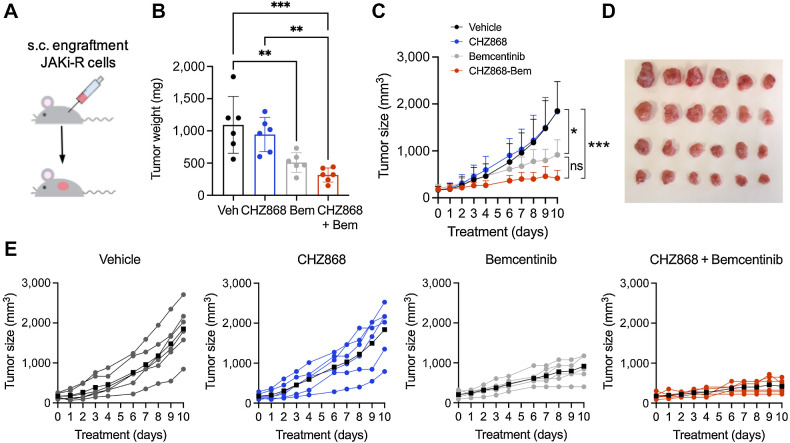
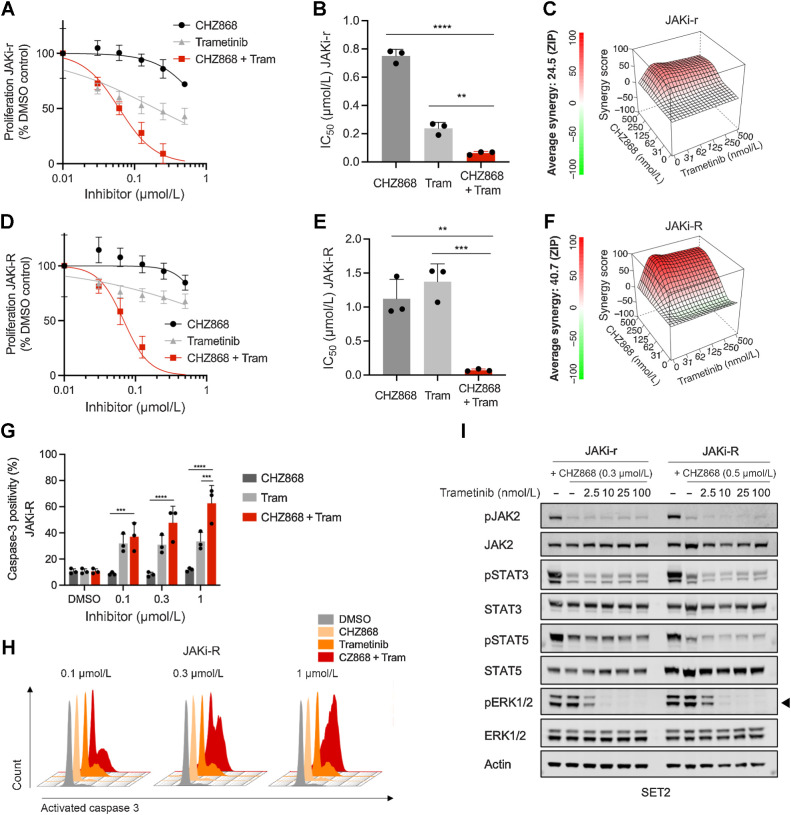
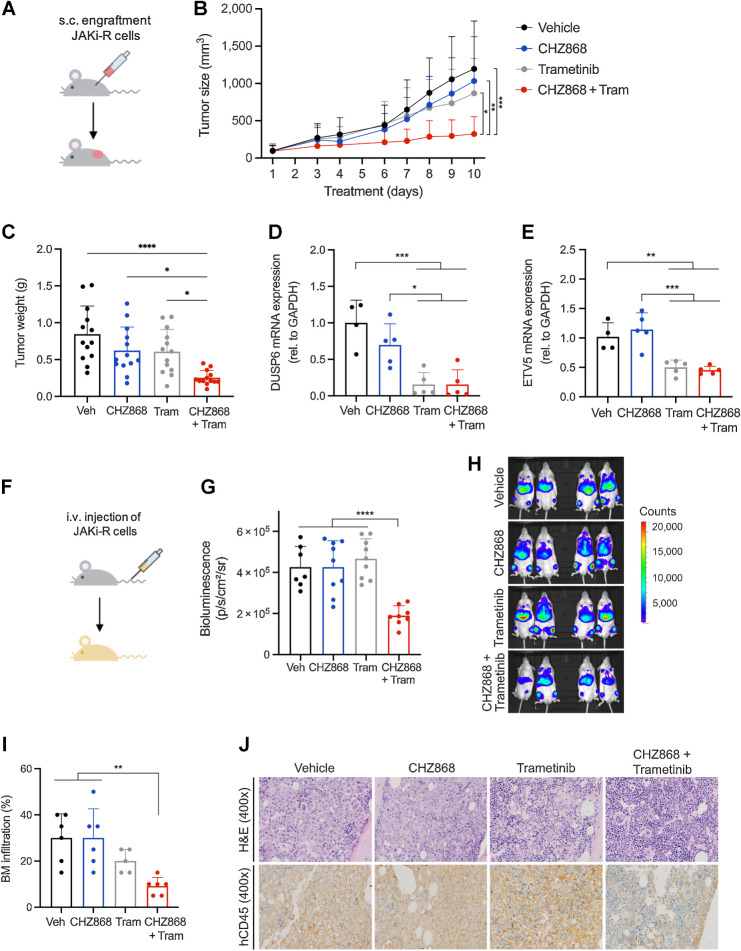
Results: MPN cells showed increased IC50 and reduced apoptosis upon CHZ868 reflecting acquired resistance to JAK2 inhibition. Among >2,500 differential phospho-sites, MAPK pathway activation was most prominent, while JAK2-STAT3/5 remained suppressed. Altered histone occupancy promoting AP-1/GATA binding motif exposure associated with upregulated AXL kinase and enriched RAS target gene profiles. AXL knockdown resensitized MPN cells and combined JAK2/AXL inhibition using bemcentinib or gilteritinib reduced IC50 to levels of sensitive cells. While resistant cells induced tumor growth in NOD/SCID gamma mice despite JAK2 inhibition, JAK2/AXL inhibition largely prevented tumor progression. Because inhibitors of MAPK pathway kinases such as MEK are clinically used in other malignancies, we evaluated JAK2/MAPK inhibition with trametinib to interfere with AXL/MAPK-induced resistance. Tumor growth was halted similarly to JAK2/AXL inhibition and in a systemic cell line-derived mouse model, marrow infiltration was decreased supporting dependency on AXL/MAPK.

Conclusions: We report on a novel mechanism of AXL/MAPK-driven escape from type II JAK2 inhibition, which is targetable at different nodes. This highlights AXL as mediator of acquired resistance warranting inhibition to enhance sustainability of JAK2 inhibition in MPN.


Figures

Figure 1. Acquired resistance to type II JAK2 inhibition occurs via MAPK pathway activation in MPN cells. A, JAK2 V617F mutant SET2 cells upon continuous exposure to the type II JAK2 inhibitor CHZ868 at 0.3 μmol/L (JAKi-r) or at 0.5 μmol/L (JAKi-R) developed significantly increased IC50 for CHZ868 as compared with JAK2 inhibitor sensitive SET2 cells (JAKi-S) reflecting acquired resistance (n = 3–5). B, Susceptibility for apoptosis induction in JAKi-r and JAKi-R cells was significantly reduced as compared with JAK2 inhibitor sensitive SET2 cells (JAKi-S) as reflected by caspase 3 activation upon exposure to CHZ868 for 48 hours (n = 3–4). C, Phosphoproteomic mass spectrometry analysis revealed differentially phosphorylated residues in JAKi-R cells as compared with JAKi-S cells as indicated by Volcano plot (blue: significant upregulation in JAKi-R cells, black: significant upregulation in JAKi-S cells, grey: nonsignificant changes). D, Pathway analysis by PathfindR of differentially phosphorylated sites in JAKi-R as compared with JAKi-S cells highlighted the MAPK pathway as most differentially phosphorylated pathway based on Biocarta gene sets. E and F, Immunoblotting confirmed activated MAPK pathway signaling in JAKi-r (E) and JAKi-R cells (F) in comparison with JAKi-S cells as reflected by pERK1/2 and pMEK1/2 despite exposure to increasing concentrations of type II JAK2 inhibitor CHZ868. JAK2, STAT3, and STAT5 remained inhibited in presence of CHZ868 in JAKi-r and JAKi-R cells similarly to JAKi-S cells. G, Densitometry of phosphoproteins shown in immunoblots confirmed increased ERK1/2 phosphorylation in JAKi-r and JAKi-R cells exposed to type II JAK2 inhibition with CHZ868 whereas JAKi-S cells showed dose-dependent inhibition of pERK (right panel). Densitometry also confirmed dose-dependent suppression of JAK2 and STAT3 phosphorylation upon type II JAK2 inhibition with CHZ868 in JAKi-r and JAKi-R cells similarly to JAKi-S cells (left and middle, n = 7–9). Data are presented as mean ± SD. Comparisons between 2 groups were performed by unpaired Student t test; multiple comparisons were performed by one-way ANOVA test with Tukey correction. P value ≤ 0.05 was considered significant (ns, not significant; *, P ≤ 0.05; **, P ≤ 0.01; ***, P ≤ 0.001; ****, P ≤ 0.0001).
Figure 1.
Acquired resistance to type II JAK2 inhibition occurs via MAPK pathway activation in MPN cells. A, JAK2 V617F mutant SET2 cells upon continuous exposure to the type II JAK2 inhibitor CHZ868 at 0.3 μmol/L (JAKi-r) or at 0.5 μmol/L (JAKi-R) developed significantly increased IC50 for CHZ868 as compared with JAK2 inhibitor sensitive SET2 cells (JAKi-S) reflecting acquired resistance (n = 3–5). B, Susceptibility for apoptosis induction in JAKi-r and JAKi-R cells was significantly reduced as compared with JAK2 inhibitor sensitive SET2 cells (JAKi-S) as reflected by caspase 3 activation upon exposure to CHZ868 for 48 hours (n = 3–4). C, Phosphoproteomic mass spectrometry analysis revealed differentially phosphorylated residues in JAKi-R cells as compared with JAKi-S cells as indicated by Volcano plot (blue: significant upregulation in JAKi-R cells, black: significant upregulation in JAKi-S cells, grey: nonsignificant changes). D, Pathway analysis by PathfindR of differentially phosphorylated sites in JAKi-R as compared with JAKi-S cells highlighted the MAPK pathway as most differentially phosphorylated pathway based on Biocarta gene sets. E and F, Immunoblotting confirmed activated MAPK pathway signaling in JAKi-r (E) and JAKi-R cells (F) in comparison with JAKi-S cells as reflected by pERK1/2 and pMEK1/2 despite exposure to increasing concentrations of type II JAK2 inhibitor CHZ868. JAK2, STAT3, and STAT5 remained inhibited in presence of CHZ868 in JAKi-r and JAKi-R cells similarly to JAKi-S cells. G, Densitometry of phosphoproteins shown in immunoblots confirmed increased ERK1/2 phosphorylation in JAKi-r and JAKi-R cells exposed to type II JAK2 inhibition with CHZ868 whereas JAKi-S cells showed dose-dependent inhibition of pERK (right panel). Densitometry also confirmed dose-dependent suppression of JAK2 and STAT3 phosphorylation upon type II JAK2 inhibition with CHZ868 in JAKi-r and JAKi-R cells similarly to JAKi-S cells (left and middle, n = 7–9). Data are presented as mean ± SD. Comparisons between 2 groups were performed by unpaired Student t test; multiple comparisons were performed by one-way ANOVA test with Tukey correction. P value ≤ 0.05 was considered significant (ns, not significant; *, P ≤ 0.05; **, P ≤ 0.01; ***, P ≤ 0.001; ****, P ≤ 0.0001).
Figure 2. Transcriptional programs and histone occupancy in acquired resistance to type II JAK2 inhibition. A, Differential expression analysis of JAK inhibitor resistant (JAKi-r and JAKi-R) vs. sensitive (JAKi-S) SET2 cells showed JAKi-r and JAKi-R cells clustered together as opposed to JAKi-S cells. The top 500 differentially expressed genes are displayed and genes with relation to MAPK signaling or epigenetic and transcriptional changes are highlighted (red box: upregulation, blue box: downregulation) including RAS and AXL tyrosine kinase. B, Differentially expressed genes between JAK2 inhibition resistant and sensitive cells were assessed by GSEA. C, RNA-seq and ATAC-seq analysis of paired samples revealed a high number of differentially expressed genes and differentially accessible chromatin regions, respectively, in JAK2 inhibition resistant as compared with sensitive cells (n = 3). Log2(FoldChange) of expression (y-axis) and accessibility (x-axis) is given for JAKi-R versus JAKi-S cells. Number of genes in each quadrant is indicated in brackets. A subset of genes relating to MAPK pathway signaling are highlighted (FDR-adjusted P value < 0.01, Fold Change > 1.2). D and E, Accessible chromatin regions were assessed for the presence of TF binding motifs by HOMER analysis in JAK2 inhibition sensitive (JAKi-S; upper panels) and resistant (JAKi-R; lower panels) cells, highlighting GATA and AP1 complex motifs in JAKi-R cells.
Figure 2.
Transcriptional programs and histone occupancy in acquired resistance to type II JAK2 inhibition. A, Differential expression analysis of JAK inhibitor resistant (JAKi-r and JAKi-R) vs. sensitive (JAKi-S) SET2 cells showed JAKi-r and JAKi-R cells clustered together as opposed to JAKi-S cells. The top 500 differentially expressed genes are displayed and genes with relation to MAPK signaling or epigenetic and transcriptional changes are highlighted (red box: upregulation, blue box: downregulation) including RAS and AXL tyrosine kinase. B, Differentially expressed genes between JAK2 inhibition resistant and sensitive cells were assessed by GSEA. C, RNA-seq and ATAC-seq analysis of paired samples revealed a high number of differentially expressed genes and differentially accessible chromatin regions, respectively, in JAK2 inhibition resistant as compared with sensitive cells (n = 3). Log2(FoldChange) of expression (y-axis) and accessibility (x-axis) is given for JAKi-R versus JAKi-S cells. Number of genes in each quadrant is indicated in brackets. A subset of genes relating to MAPK pathway signaling are highlighted (FDR-adjusted P value < 0.01, Fold Change > 1.2). D and E, Accessible chromatin regions were assessed for the presence of TF binding motifs by HOMER analysis in JAK2 inhibition sensitive (JAKi-S; upper panels) and resistant (JAKi-R; lower panels) cells, highlighting GATA and AP1 complex motifs in JAKi-R cells.
Figure 3. Acquired resistance to type II JAK2 inhibition is dependent on AXL tyrosine kinase. A, AXL mRNA expression was significantly increased in JAK inhibitor resistant (JAKi-r and JAKi-R) vs. sensitive cells (JAKi-S) relative to GAPDH (n = 3) consistent with RNA-seq (Fig. 2A). B and C, Increased AXL expression in JAKi resistant cells (JAKi-r and JAKi-R) was confirmed on protein level as indicated by immunoblotting (B) and respective densitometry (C; n = 4). D, Reduced AXL protein expression shown by immunoblotting upon shRNA-induced AXL knock-down with shAXL-1 and shAXL-2 hairpins vs. shSCR control in JAKi-R SET2 cells 48 hours after doxycycline induction. E, Significantly reduced AXL mRNA expression shown by qRT-PCR upon shRNA-induced AXL knock-down with shAXL-1 and shAXL-2 hairpins vs. shSCR control in JAKi-R SET2 cells 48 hours after doxycycline induction (n = 3). F, Significantly increased susceptibility of JAKi-R SET2 cells to type II JAK2 inhibition with CHZ868 as shown by reduced IC50 upon AXL depletion by two different shRNAs (shAXL-1, shAXL-2) upon doxycycline induction (+dox) as compared with shSCR control. Non-induced control (-dox), n = 3. G, Significantly reduced IC50 values in JAKi-R SET2 cells were achieved upon combined exposure with the AXL inhibitor bemcentinib and type II JAK2 inhibition with CHZ868 (n = 3). H, Representative graph showing reduced proliferation of JAKi-R SET2 cells exposed to the AXL inhibitor bemcentinib or combined JAK2 / AXL inhibition with CHZ868 / bemcentinib as compared with CHZ868 as a single agent. I, Significantly reduced IC50 values in JAKi-R SET2 cells were achieved upon combined exposure with the AXL/FLT3 inhibitor gilteritinib and type II JAK2 inhibition with CHZ868 (n = 4). J, Representative graph showing reduced proliferation of JAKi-R SET2 cells exposed to the AXL/FLT3 inhibitor gilteritinib or combined JAK2 / AXL inhibition with CHZ868 / gilteritinib as compared with CHZ868 as a single agent. K, Synergy analysis of type II JAK2 inhibitor CHZ868 with the AXL inhibitor bemcentinib in JAKi-S (upper panel) and JAKi-R (lower panel) SET2 cells showed positive synergy in JAKi-R cells, but not in JAKi-S cells (n = 3, mean values are shown for synergy scores along with representative graphs). Data are presented as mean ± SD and analyzed by one-way ANOVA (panels A, G, I) or two-tailed Student t test (F). ns, not significant; *, P ≤ 0.05; **, P ≤ 0.01; ***, P ≤ 0.001; ****, P ≤ 0.0001.
Figure 3.
Acquired resistance to type II JAK2 inhibition is dependent on AXL tyrosine kinase. A, AXL mRNA expression was significantly increased in JAK inhibitor resistant (JAKi-r and JAKi-R) vs. sensitive cells (JAKi-S) relative to GAPDH (n = 3) consistent with RNA-seq (Fig. 2A). B and C, Increased AXL expression in JAKi resistant cells (JAKi-r and JAKi-R) was confirmed on protein level as indicated by immunoblotting (B) and respective densitometry (C; n = 4). D, Reduced AXL protein expression shown by immunoblotting upon shRNA-induced AXL knock-down with shAXL-1 and shAXL-2 hairpins vs. shSCR control in JAKi-R SET2 cells 48 hours after doxycycline induction. E, Significantly reduced AXL mRNA expression shown by qRT-PCR upon shRNA-induced AXL knock-down with shAXL-1 and shAXL-2 hairpins vs. shSCR control in JAKi-R SET2 cells 48 hours after doxycycline induction (n = 3). F, Significantly increased susceptibility of JAKi-R SET2 cells to type II JAK2 inhibition with CHZ868 as shown by reduced IC50 upon AXL depletion by two different shRNAs (shAXL-1, shAXL-2) upon doxycycline induction (+dox) as compared with shSCR control. Non-induced control (-dox), n = 3. G, Significantly reduced IC50 values in JAKi-R SET2 cells were achieved upon combined exposure with the AXL inhibitor bemcentinib and type II JAK2 inhibition with CHZ868 (n = 3). H, Representative graph showing reduced proliferation of JAKi-R SET2 cells exposed to the AXL inhibitor bemcentinib or combined JAK2 / AXL inhibition with CHZ868 / bemcentinib as compared with CHZ868 as a single agent. I, Significantly reduced IC50 values in JAKi-R SET2 cells were achieved upon combined exposure with the AXL/FLT3 inhibitor gilteritinib and type II JAK2 inhibition with CHZ868 (n = 4). J, Representative graph showing reduced proliferation of JAKi-R SET2 cells exposed to the AXL/FLT3 inhibitor gilteritinib or combined JAK2 / AXL inhibition with CHZ868 / gilteritinib as compared with CHZ868 as a single agent. K, Synergy analysis of type II JAK2 inhibitor CHZ868 with the AXL inhibitor bemcentinib in JAKi-S (upper panel) and JAKi-R (lower panel) SET2 cells showed positive synergy in JAKi-R cells, but not in JAKi-S cells (n = 3, mean values are shown for synergy scores along with representative graphs). Data are presented as mean ± SD and analyzed by one-way ANOVA (panels A, G, I) or two-tailed Student t test (F). ns, not significant; *, P ≤ 0.05; **, P ≤ 0.01; ***, P ≤ 0.001; ****, P ≤ 0.0001.
Figure 4. Resistance to type II JAK inhibition is overcome in vivo by combined JAK2/AXL inhibition. A, JAK2 inhibitor resistant SET2 cells (JAKi-R) were injected subcutaneously into the flank of NSG mice. Animals were treated orally with type II JAK2 inhibitor CHZ868 15 mg/kg every day, AXL inhibitor bemcentinib (bem) 50 mg/kg twice a day, combined CHZ868 15 mg/kg every day/bemcentinib 50 mg/kg twice a day or vehicle control. Treatment was initiated at 100 mm3 tumor size and continued until maximal tumor size was reached in vehicle treated mice. B, Analysis of tumor weight at end of treatment confirmed significant reduction of tumor growth in vivo by AXL inhibition with bemcentinib or by combined JAK2/AXL inhibition with CHZ868/bemcentinib (n = 6/group). C, Tumor size over time showed tumor growth in vehicle-treated mice and analogously in CHZ868-treated mice suggesting resistance to type II JAK2 inhibition in vivo. AXL inhibition by bemcentinib significantly reduced tumor growth, while combined JAK2/AXL inhibition almost suppressed tumor growth (n = 6/group). D, Photographic image of isolated tumors at end of treatment. E, Tumor growth in individual mice is shown for each treatment group. Black lines indicate the average tumor size per group. Combined CHZ868/bemcentinib almost suppressed tumor growth in all the treated mice. Data are presented as mean ± SD and analyzed by one-way ANOVA. ns, not significant; *, P ≤ 0.05; **, P ≤ 0.01; ***, P ≤ 0.001; ****, P ≤ 0.0001.
Figure 4.
Resistance to type II JAK inhibition is overcome in vivo by combined JAK2/AXL inhibition. A, JAK2 inhibitor resistant SET2 cells (JAKi-R) were injected subcutaneously into the flank of NSG mice. Animals were treated orally with type II JAK2 inhibitor CHZ868 15 mg/kg every day, AXL inhibitor bemcentinib (bem) 50 mg/kg twice a day, combined CHZ868 15 mg/kg every day/bemcentinib 50 mg/kg twice a day or vehicle control. Treatment was initiated at 100 mm3 tumor size and continued until maximal tumor size was reached in vehicle treated mice. B, Analysis of tumor weight at end of treatment confirmed significant reduction of tumor growth in vivo by AXL inhibition with bemcentinib or by combined JAK2/AXL inhibition with CHZ868/bemcentinib (n = 6/group). C, Tumor size over time showed tumor growth in vehicle-treated mice and analogously in CHZ868-treated mice suggesting resistance to type II JAK2 inhibition in vivo. AXL inhibition by bemcentinib significantly reduced tumor growth, while combined JAK2/AXL inhibition almost suppressed tumor growth (n = 6/group). D, Photographic image of isolated tumors at end of treatment. E, Tumor growth in individual mice is shown for each treatment group. Black lines indicate the average tumor size per group. Combined CHZ868/bemcentinib almost suppressed tumor growth in all the treated mice. Data are presented as mean ± SD and analyzed by one-way ANOVA. ns, not significant; *, P ≤ 0.05; **, P ≤ 0.01; ***, P ≤ 0.001; ****, P ≤ 0.0001.
Figure 5. Targeting MAPK pathway abrogates acquired resistance to type II JAK2 inhibition in MPN cells. A, Proliferation of JAKi-r SET2 cells was effectively inhibited by combined JAK2/MAPK pathway inhibition with CHZ868/trametinib as shown by a representative graph of proliferation capacity upon 48 hours exposure of inhibitor exposure. B, IC50 was significantly reduced by combined CHZ868/trametinib in JAKi-r cells (n = 3). C, Synergy analysis of type II JAK2 inhibition with CHZ868 and MAPK pathway inhibition with trametinib showed positive synergy in JAKi-r cells. Mean of n = 3 experiments is shown for synergy score along with a representative graph D. Proliferation of JAKi-R SET2 cells was effectively inhibited by combined JAK2/MAPK pathway inhibition with CHZ868/trametinib as shown by a representative graph of proliferation capacity upon 48 hours of inhibitor exposure. E, IC50 was significantly reduced by combined CHZ868/trametinib in JAKi-R cells (n = 3). F, Synergy analysis of type II JAK2 inhibition with CHZ868 and MAPK pathway inhibition with trametinib showed positive synergy in JAKi-R cells. Mean of n = 3 experiments is shown for synergy score along with a representative graph G. Apoptotic cell death reflected by positivity for caspase-3 was induced by combined JAK2 / MAPK pathway inhibition by CHZ868/trametinib in JAKi-R cells upon 48 hours exposure to inhibitors (n = 3–4). H, Representative histograms of caspase-3 positivity in JAKi-R cells are shown. I, Immunoblotting showed dose-dependent suppression of MAPK pathway signaling reflected by pERK1/2 (arrowhead) in JAKi-r and JAKi-R SET2 cells upon exposure to increasing concentrations of trametinib combined with CHZ868. Data are presented as mean ± SD and analyzed by one-way ANOVA. ns, not significant; *, P ≤ 0.05; **, P ≤ 0.01; ***, P ≤ 0.001; ****, P ≤ 0.0001.
Figure 5.
Targeting MAPK pathway abrogates acquired resistance to type II JAK2 inhibition in MPN cells. A, Proliferation of JAKi-r SET2 cells was effectively inhibited by combined JAK2/MAPK pathway inhibition with CHZ868/trametinib as shown by a representative graph of proliferation capacity upon 48 hours exposure of inhibitor exposure. B, IC50 was significantly reduced by combined CHZ868/trametinib in JAKi-r cells (n = 3). C, Synergy analysis of type II JAK2 inhibition with CHZ868 and MAPK pathway inhibition with trametinib showed positive synergy in JAKi-r cells. Mean of n = 3 experiments is shown for synergy score along with a representative graph D. Proliferation of JAKi-R SET2 cells was effectively inhibited by combined JAK2/MAPK pathway inhibition with CHZ868/trametinib as shown by a representative graph of proliferation capacity upon 48 hours of inhibitor exposure. E, IC50 was significantly reduced by combined CHZ868/trametinib in JAKi-R cells (n = 3). F, Synergy analysis of type II JAK2 inhibition with CHZ868 and MAPK pathway inhibition with trametinib showed positive synergy in JAKi-R cells. Mean of n = 3 experiments is shown for synergy score along with a representative graph G. Apoptotic cell death reflected by positivity for caspase-3 was induced by combined JAK2 / MAPK pathway inhibition by CHZ868/trametinib in JAKi-R cells upon 48 hours exposure to inhibitors (n = 3–4). H, Representative histograms of caspase-3 positivity in JAKi-R cells are shown. I, Immunoblotting showed dose-dependent suppression of MAPK pathway signaling reflected by pERK1/2 (arrowhead) in JAKi-r and JAKi-R SET2 cells upon exposure to increasing concentrations of trametinib combined with CHZ868. Data are presented as mean ± SD and analyzed by one-way ANOVA. ns, not significant; *, P ≤ 0.05; **, P ≤ 0.01; ***, P ≤ 0.001; ****, P ≤ 0.0001.
Figure 6. Targeting MAPK pathway abrogates acquired resistance to type II JAK2 inhibition in vivo. A, Schema of in vivo model with subcutaneous engraftment. JAK2 inhibitor resistant SET2 cells (JAK2i-R) were injected into the flank of NSG mice. Animals were treated orally with type II JAK2 inhibitor CHZ868 15 mg/kg every day, MAPK inhibitor trametinib (tram) 0.3 mg/kg every day, combined CHZ868 15 mg/kg every day/MAPK inhibitor trametinib 0.3 mg/kg every day, or vehicle control. Treatment was initiated at 100 mm3 tumor size and continued until maximal tumor size was reached in vehicle-treated mice. B, Tumor size over time showed tumor growth in vehicle-treated mice similarly to CHZ868-treated mice. Combined JAK2/MAPK inhibition effectively reduced tumor size (n = 13/group). C, Analysis of tumor weight at end of treatment confirmed significant reduction of tumor growth in vivo by combined JAK2/MAPK inhibition with CHZ868 15 mg/kg every day/MAPK inhibitor trametinib 0.3 mg/kg every day (n = 13/group). D, Expression of MAPK pathway target DUSP6 was significantly reduced by combined JAK2/MAPK inhibition with CHZ868 15 mg/kg every day/MAPK inhibitor trametinib 0.3 mg/kg every day (n = 4–5/group). E, Expression of MAPK pathway target ETV5 was significantly reduced by combined JAK2/MAPK inhibition with CHZ868 15 mg/kg every day/MAPK inhibitor trametinib 0.3 mg/kg every day (n = 4–5/group). F, Schema of in vivo model with intravenous engraftment. JAK2 inhibitor resistant SET2 cells (JAK2i-R) stably expressing luciferase were injected intravenously into NSG mice and engraftment documented by bioluminescent imaging. Animals were treated orally with type II JAK2 inhibitor CHZ868 15 mg/kg every day, MAPK inhibitor trametinib 0.3 mg/kg every day, combined CHZ868 15 mg/kg every day/MAPK inhibitor trametinib 0.3 mg/kg every day, or vehicle control. G, Bioluminescent signal was significantly reduced in mice treated with combined CHZ868/trametinib at 7 days of treatment (n = 7–9/group). H, Representative bioluminescence images are shown. I, BM infiltration of JAK2i-R cells was determined as human CD45 positivity by IHC on BM sections. A significant reduction of BM infiltration was observed with combined CHZ868 15 mg/kg every day/MAPK inhibitor trametinib 0.3 mg/kg every day (n = 5–6/group). J, Representative images of BM sections stained with H&E (top) and IHC for hCD45 (lower panel) showed reduced infiltration with combined CHZ868 15 mg/kg every day/MAPK inhibitor trametinib 0.3 mg/kg every day. Original magnification x400. Data are presented as mean ± SD and analyzed by one-way ANOVA. ns, not significant; *, P ≤ 0.05; **, P ≤ 0.01; ***, P ≤ 0.001; ****, P ≤ 0.0001.
Figure 6.
Targeting MAPK pathway abrogates acquired resistance to type II JAK2 inhibition in vivo. A, Schema of in vivo model with subcutaneous engraftment. JAK2 inhibitor resistant SET2 cells (JAK2i-R) were injected into the flank of NSG mice. Animals were treated orally with type II JAK2 inhibitor CHZ868 15 mg/kg every day, MAPK inhibitor trametinib (tram) 0.3 mg/kg every day, combined CHZ868 15 mg/kg every day/MAPK inhibitor trametinib 0.3 mg/kg every day, or vehicle control. Treatment was initiated at 100 mm3 tumor size and continued until maximal tumor size was reached in vehicle-treated mice. B, Tumor size over time showed tumor growth in vehicle-treated mice similarly to CHZ868-treated mice. Combined JAK2/MAPK inhibition effectively reduced tumor size (n = 13/group). C, Analysis of tumor weight at end of treatment confirmed significant reduction of tumor growth in vivo by combined JAK2/MAPK inhibition with CHZ868 15 mg/kg every day/MAPK inhibitor trametinib 0.3 mg/kg every day (n = 13/group). D, Expression of MAPK pathway target DUSP6 was significantly reduced by combined JAK2/MAPK inhibition with CHZ868 15 mg/kg every day/MAPK inhibitor trametinib 0.3 mg/kg every day (n = 4–5/group). E, Expression of MAPK pathway target ETV5 was significantly reduced by combined JAK2/MAPK inhibition with CHZ868 15 mg/kg every day/MAPK inhibitor trametinib 0.3 mg/kg every day (n = 4–5/group). F, Schema of in vivo model with intravenous engraftment. JAK2 inhibitor resistant SET2 cells (JAK2i-R) stably expressing luciferase were injected intravenously into NSG mice and engraftment documented by bioluminescent imaging. Animals were treated orally with type II JAK2 inhibitor CHZ868 15 mg/kg every day, MAPK inhibitor trametinib 0.3 mg/kg every day, combined CHZ868 15 mg/kg every day/MAPK inhibitor trametinib 0.3 mg/kg every day, or vehicle control. G, Bioluminescent signal was significantly reduced in mice treated with combined CHZ868/trametinib at 7 days of treatment (n = 7–9/group). H, Representative bioluminescence images are shown. I, BM infiltration of JAK2i-R cells was determined as human CD45 positivity by IHC on BM sections. A significant reduction of BM infiltration was observed with combined CHZ868 15 mg/kg every day/MAPK inhibitor trametinib 0.3 mg/kg every day (n = 5–6/group). J, Representative images of BM sections stained with H&E (top) and IHC for hCD45 (lower panel) showed reduced infiltration with combined CHZ868 15 mg/kg every day/MAPK inhibitor trametinib 0.3 mg/kg every day. Original magnification x400. Data are presented as mean ± SD and analyzed by one-way ANOVA. ns, not significant; *, P ≤ 0.05; **, P ≤ 0.01; ***, P ≤ 0.001; ****, P ≤ 0.0001.

References

    1. Mullally A, Lane SW, Ball B, Megerdichian C, Okabe R, Al-Shahrour F, et al. . Physiological Jak2V617F expression causes a lethal myeloproliferative neoplasm with differential effects on hematopoietic stem and progenitor cells. Cancer Cell 2010;17:584–96. - PMC - PubMed
    1. Spivak JL. Myeloproliferative neoplasms. N Engl J Med 2017;376:2168–81. - PubMed
    1. Rampal R, Al-Shahrour F, Abdel-Wahab O, Patel JP, Brunel JP, Mermel CH, et al. . Integrated genomic analysis illustrates the central role of JAK-STAT pathway activation in myeloproliferative neoplasm pathogenesis. Blood 2014;123:e123–33. - PMC - PubMed
    1. Szybinski J, Meyer SC. Genetics of myeloproliferative neoplasms. Hematol Oncol Clin North Am 2021;35:217–36. - PubMed
    1. Meyer SC, Levine RL. Molecular pathways: molecular basis for sensitivity and resistance to JAK kinase inhibitors. Clin Cancer Res 2014;20:2051–9. - PMC - PubMed

Publication types