. 2024 Jan:190:106361.
doi: 10.1016/j.nbd.2023.106361. Epub 2023 Nov 20.

Cell-type brain-region specific changes in prefrontal cortex of a mouse model of alcohol dependence

Affiliations

Cell-type brain-region specific changes in prefrontal cortex of a mouse model of alcohol dependence

Nihal A Salem et al. Neurobiol Dis. 2024 Jan.

Abstract

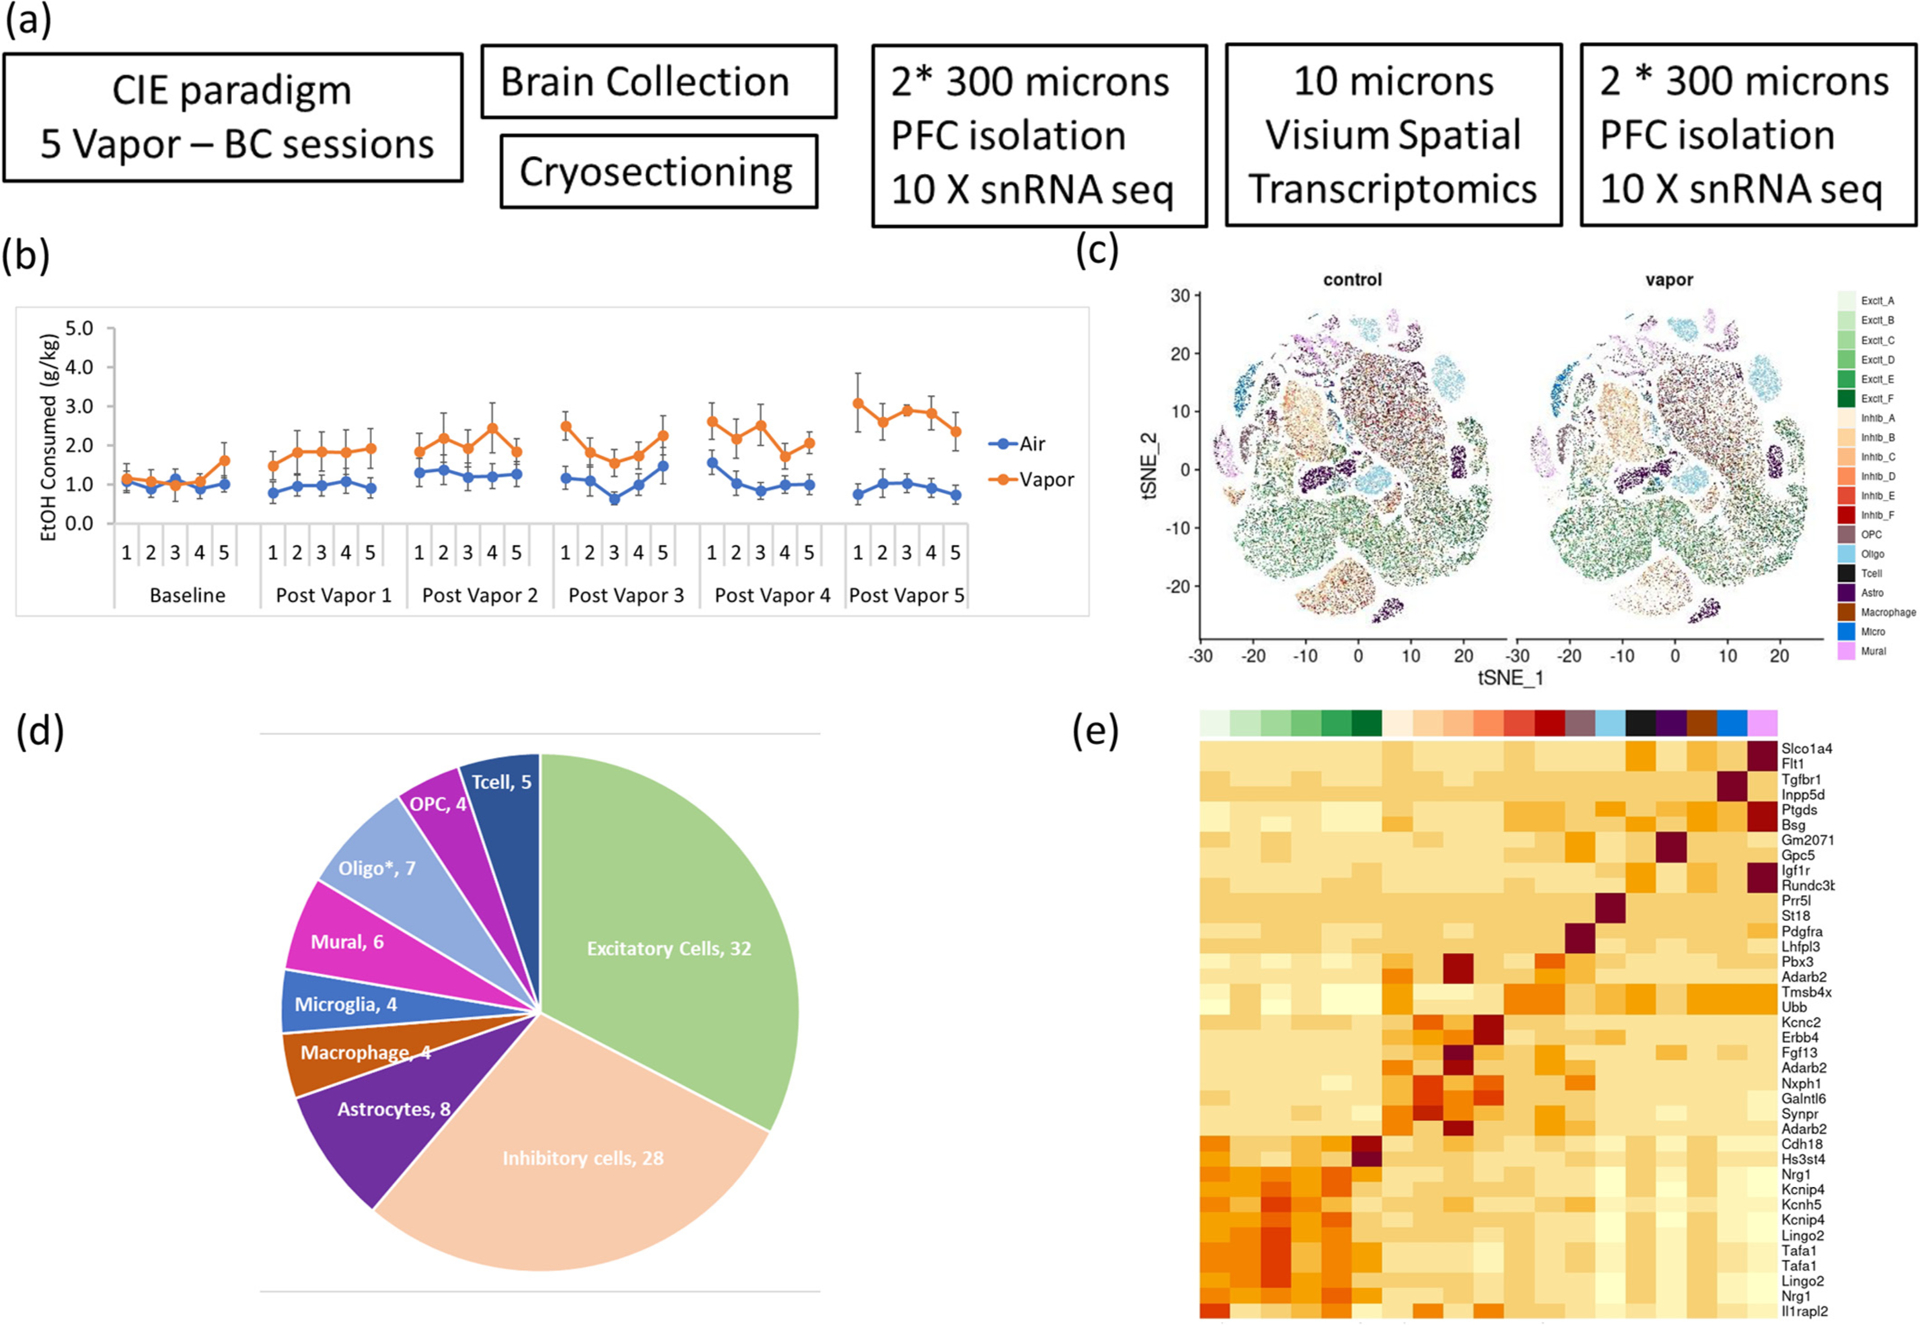
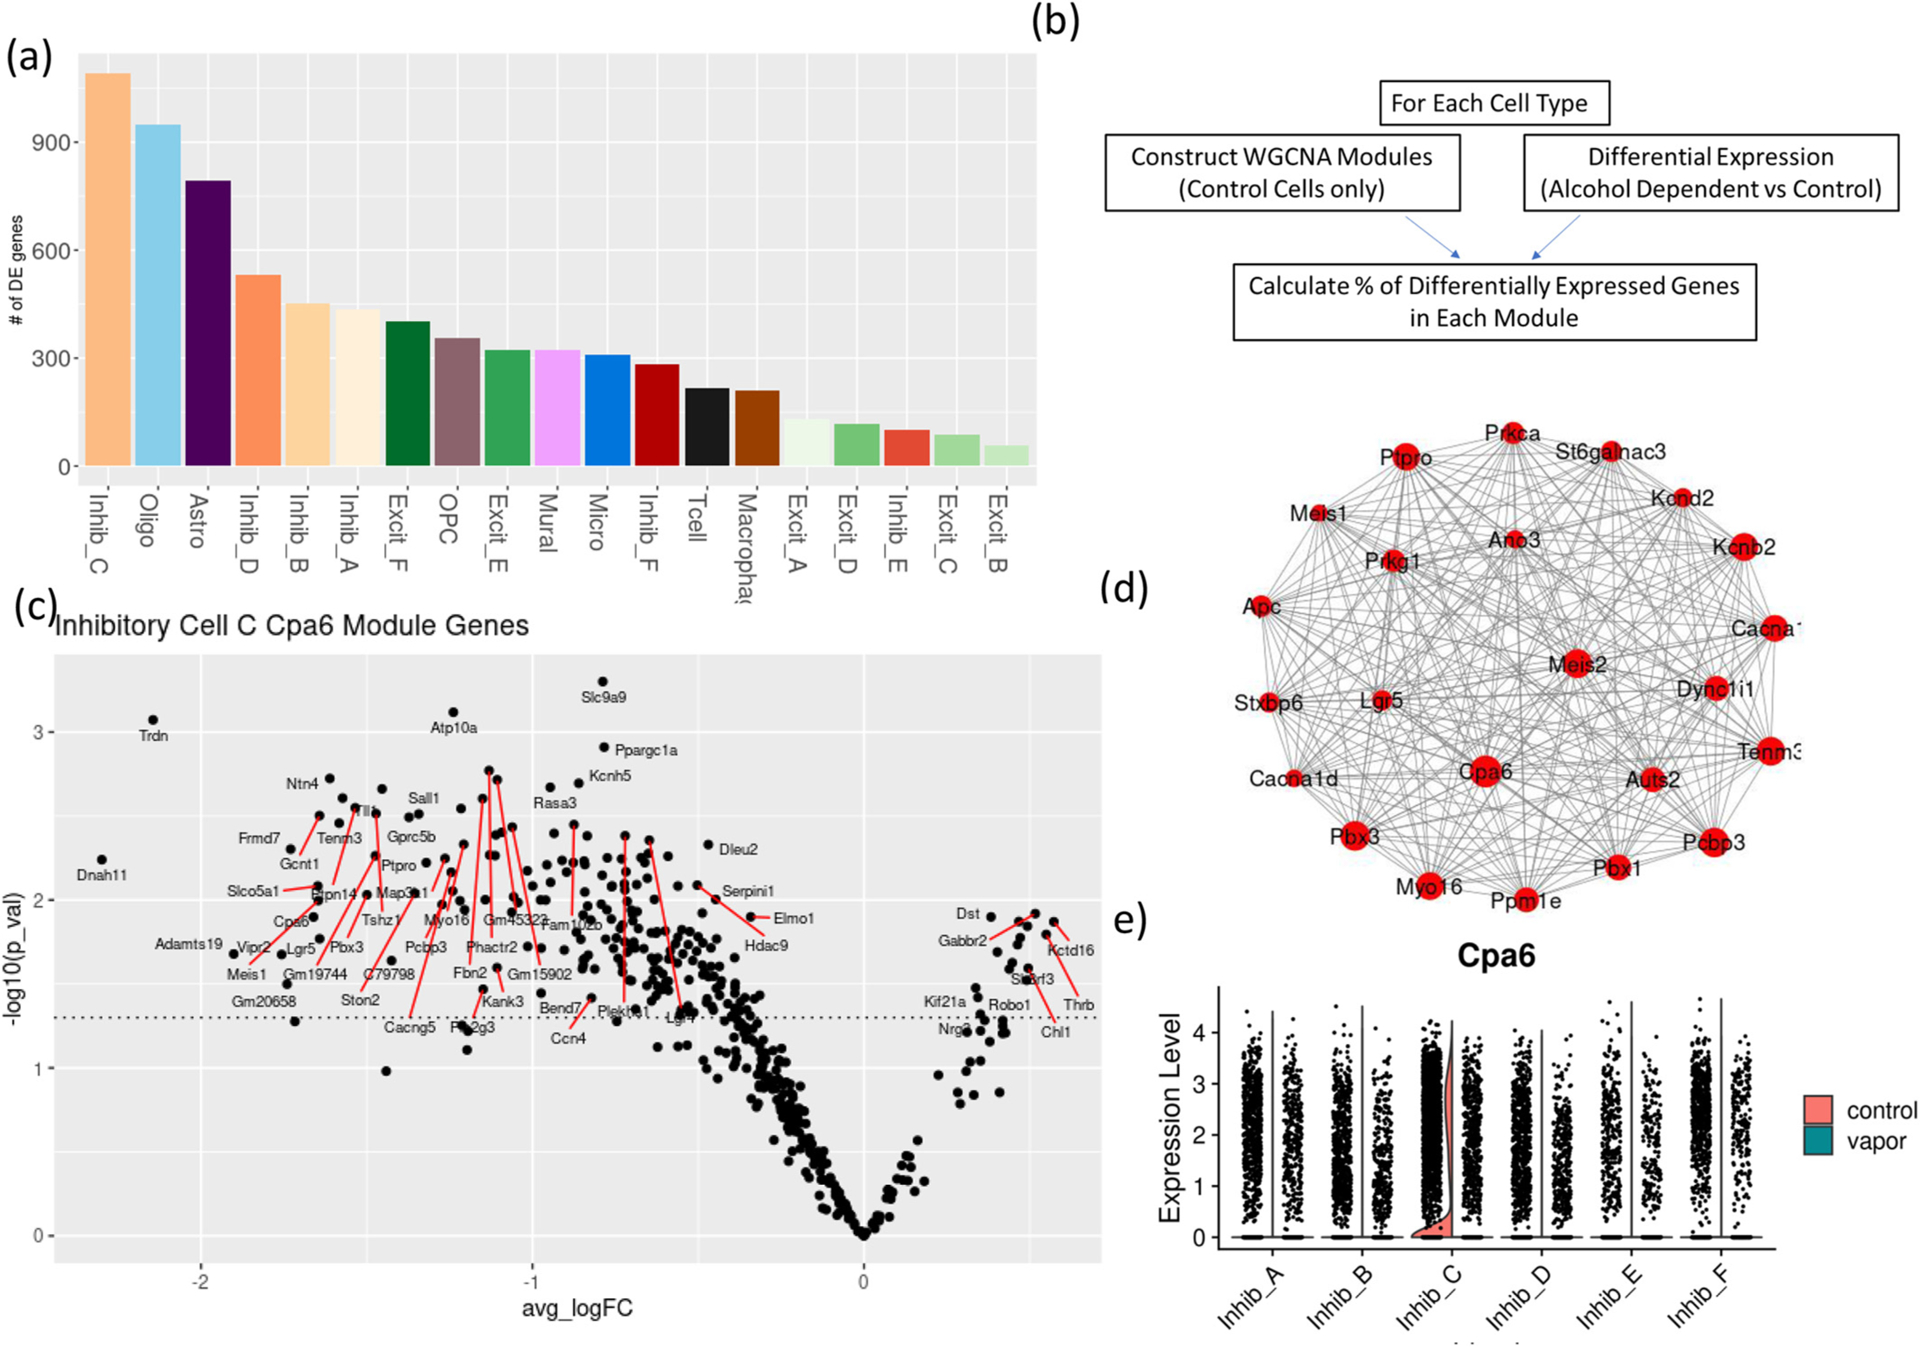
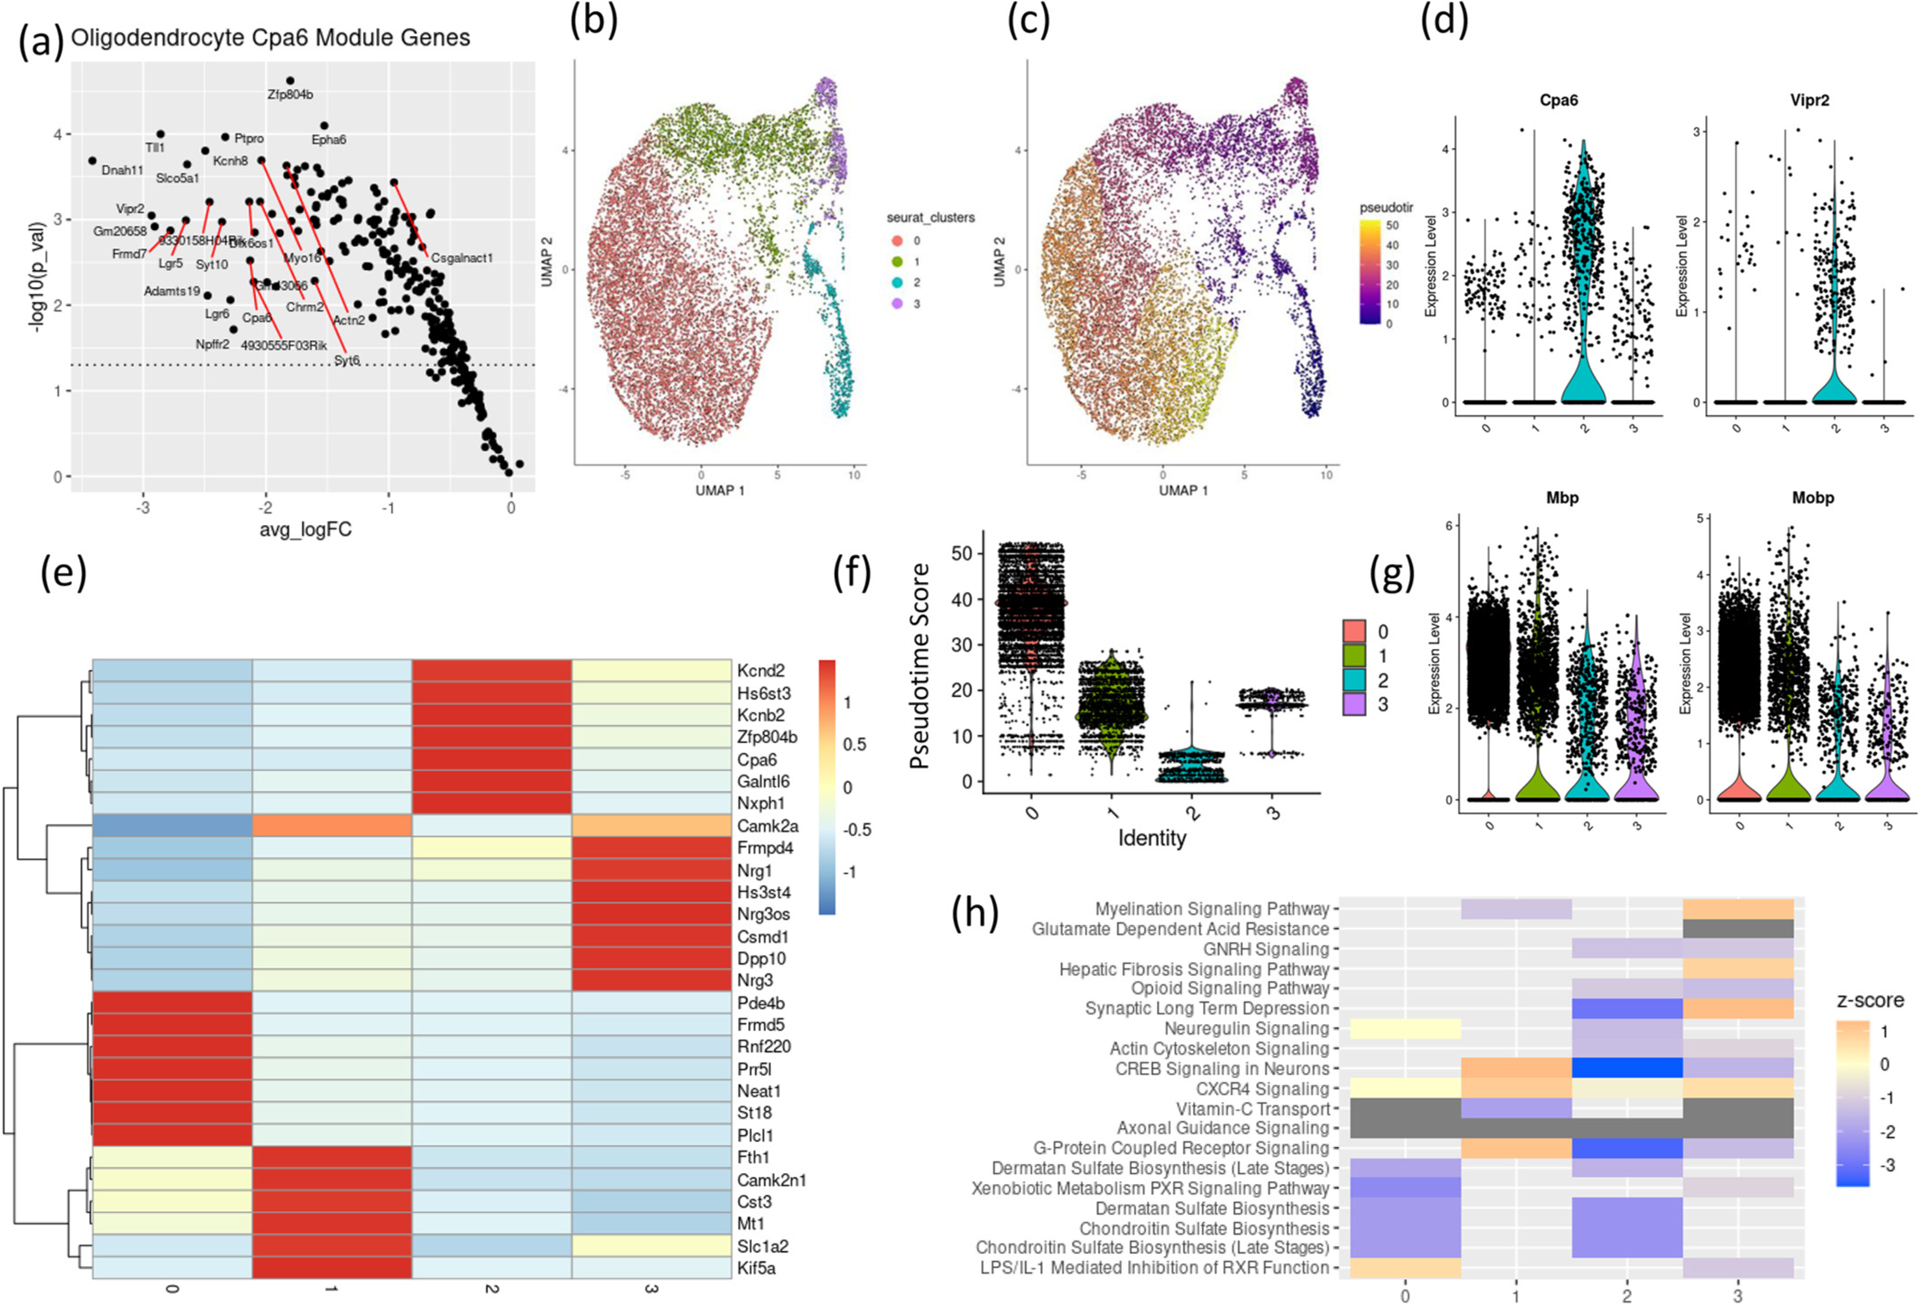
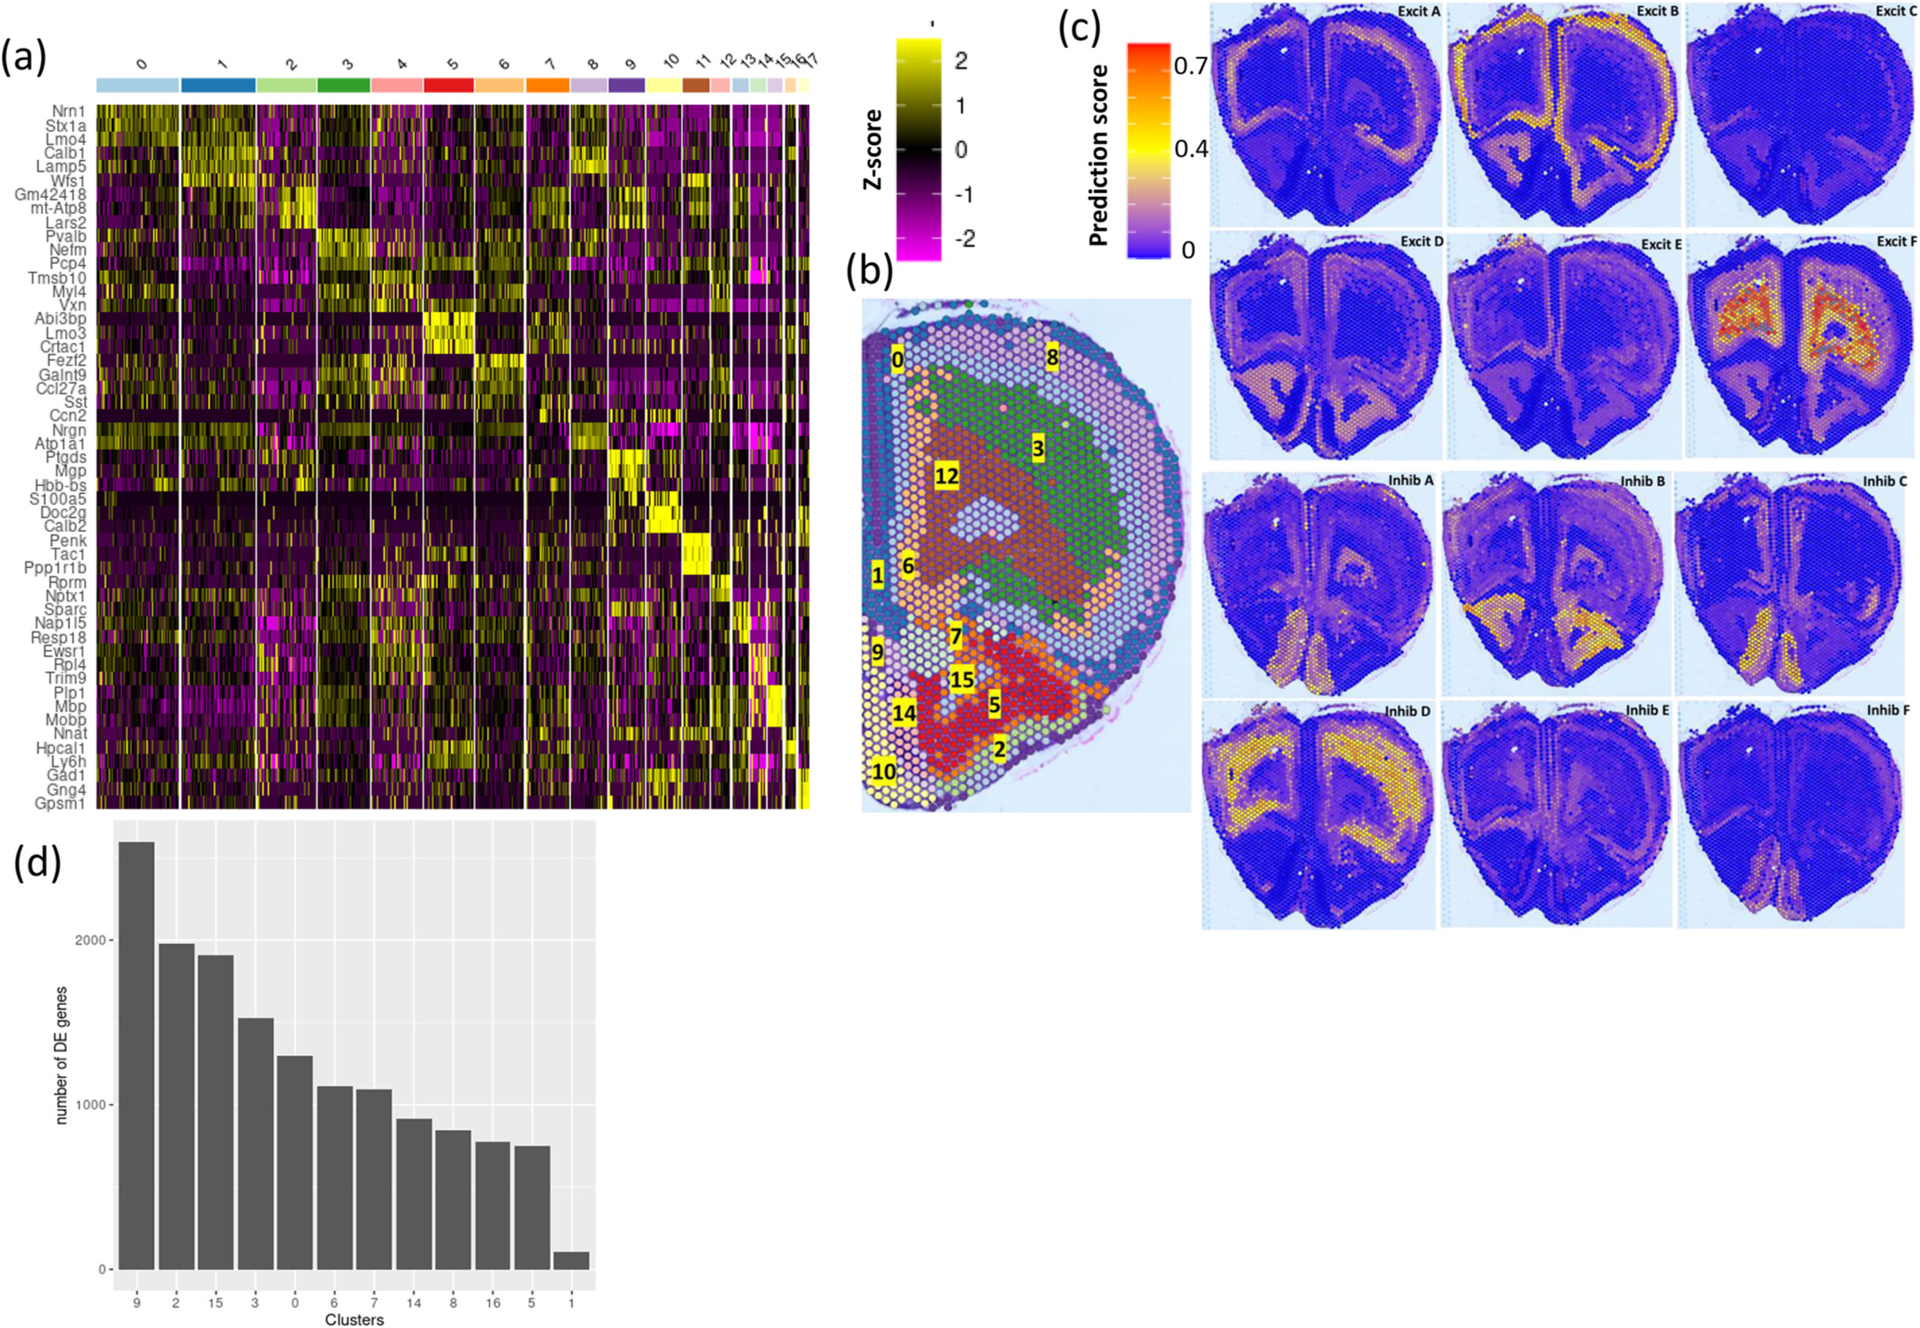
The prefrontal cortex is a crucial regulator of alcohol drinking, and dependence, and other behavioral phenotypes associated with AUD. Comprehensive identification of cell-type specific transcriptomic changes in alcohol dependence will improve our understanding of mechanisms underlying the excessive alcohol use associated with alcohol dependence and will refine targets for therapeutic development. We performed single nucleus RNA sequencing (snRNA-seq) and Visium spatial gene expression profiling on the medial prefrontal cortex (mPFC) obtained from C57BL/6 J mice exposed to the two-bottle choice-chronic intermittent ethanol (CIE) vapor exposure (2BC-CIE, defined as dependent group) paradigm which models phenotypes of alcohol dependence including escalation of alcohol drinking. Gene co-expression network analysis and differential expression analysis identified highly dysregulated co-expression networks in multiple cell types. Dysregulated modules and their hub genes suggest novel understudied targets for studying molecular mechanisms contributing to the alcohol dependence state. A subtype of inhibitory neurons was the most alcohol-sensitive cell type and contained a downregulated gene co-expression module; the hub gene for this module is Cpa6, a gene previously identified by GWAS to be associated with excessive alcohol consumption. We identified an astrocytic Gpc5 module significantly upregulated in the alcohol-dependent group. To our knowledge, there are no studies linking Cpa6 and Gpc5 to the alcohol-dependent phenotype. We also identified neuroinflammation related gene expression changes in multiple cell types, specifically enriched in microglia, further implicating neuroinflammation in the escalation of alcohol drinking. Here, we present a comprehensive atlas of cell-type specific alcohol dependence mediated gene expression changes in the mPFC and identify novel cell type-specific targets implicated in alcohol dependence.

Keywords: Alcohol dependence; Alcohol dependence cell-type specific responses; Chronic intermittent ethanol exposure; Gene co-expression networks; Multimodal data integration; Single nucleus RNA sequencing; Spatial transcriptomics.


Figures

Fig. 1.
Fig. 1.
Single nucleus RNA sequencing of mPFC from 2BC-CIE paradigm treated animals: (a) Schematic diagram showing the experimental design, animals were subjected to chronic intermittent ethanol or air (control) followed by 2 h 2 bottle choice (ethanol/water), after 5 CIE sessions, brains were collected, flash frozen, mounted in OCT, cryosectioned into 300 μm section to obtain PFC punches for single nucleus RNA sequencing, one 10 μm section followed by two more 300 μm section for snRNA-seq, was collected for Visium Spatial transcriptomics. (b) Amount of ethanol consumed (g/Kg) during the 2-h 2 bottle choice sessions after each alcohol vapor/air control exposure session. (c) tSNE plot showing single nuclei clustering from alcohol vapor and air control samples, color coded by cell types. (d) Percentage of nuclei assigned to each cell type. (*oligo: oligodendrocytes). (e) Heatmap showing average expression of the top enriched markers (rows) in each cell type (columns)
Fig. 2.
Fig. 2.
2BC-CIE results in cell-type specific transcriptomic changes and disruption of gene expression networks: (a) number of differentially expressed genes identified by at least 3 differential expression pipelines in each cell type. (b) schematic of the identification of 2BC-CIE exposure-dysregulated gene co-expression modules. (c) Average log2 fold change (x-axis) and – log 10 (p-value) of gene members of Inhibitory Cells Subtype C Cpa6 module. (d) Top connected genes in inhibitory cell subtype C Cpa6 module (e) Violin plot showing the expression of Cpa6 gene in inhibitory cells subtypes in air control and alcohol dependent samples.
Fig. 3.
Fig. 3.
Oligodendrocytes sub clustering into transcriptionally distinct subtypes. (a) Average log2 fold change (x-axis) and – log 10 (p-value) of gene members of oligodendrocytes Cpa6 module. UMAP plots of oligodendrocytes colored by (b) unsupervised clustering assignment and (c) pseudotime score. (d) expression of Cpa6 and Vipr2 in oligodendrocyte subclusters. (e) heatmap showing scaled expression values of seven top expressed genes in each oligodendrocyte subclusters. (f) violin plots showing pseudotime scores in each oligodendrocyte clusters (g) expression of myelin related genes, Mbp & Mobp, in oligodendrocyte subclusters. (h) z-score of select predicted pathways enriched in differentially expressed genes in oligodendrocytes subclusters, positive z-score = predicted activation, negative z-score = predicted inhibition.
Fig. 4.
Fig. 4.
Visium Spatial Transcriptomics Identify Gene Expression Signatures of Spatially Defined Regional Clusters. (a) heatmap showing the top enriched genes in each of the unsupervised clusters identified in the Visium sections. (b) the spatial location of each of the unsupervised clusters in the brain section. (c) prediction scores of each of excitatory and inhibitory cells subtypes. (d) number of alcohol-dependence differentially expressed genes in each spatial cluster.

References

    1. Abernathy Kenneth, Judson Chandler L, Woodward John J., 2010. Alcohol and the prefrontal cortex. Int. Rev. Neurobiol 91, 289–320. - PMC - PubMed
    1. Achicallende Svein, Río Itziar Bonilla-Del, Serrano Maitane, Mimenza Amaia, Lekunberri Leire, Anaut-Lusar Ilazki, Puente Nagore, Gerrikagoitia Inmaculada, Grandes Pedro, 2022. GLAST versus GFAP as Astroglial marker for the subcellular study of cannabinoid CB receptors in astrocytes. Histochem. Cell Biol 158 (6), 561–569. - PubMed
    1. Adewuyi Emmanuel O., O’Brien Eleanor K., Nyholt Dale R., Porter Tenielle, Laws Simon M., 2022. A large-scale genome-wide cross-trait analysis reveals shared genetic architecture between Alzheimer’s disease and gastrointestinal tract disorders. Communications Biology 5 (1), 691. - PMC - PubMed
    1. Avila Diana V., Myers Scott A., Zhang Jingwen, Kharebava Giorgi, McClain Craig J., Kim Hee-Yong, Whittemore Scott R., Gobejishvili Leila, Barve Shirish, 2017. Phosphodiesterase 4b expression plays a major role in alcohol-induced neuroinflammation. Neuropharmacology 125 (October), 376–385. - PMC - PubMed
    1. Ball Gareth, Stokes Paul R., Rhodes Rebecca A., Bose Subrata K., Rezek Iead, Wink Alle-Meije, Lord Louis-David, Mehta Mitul A., Grasby Paul M., Turkheimer Federico E., 2011. Executive functions and prefrontal cortex: A matter of persistence? Front. Syst. Neurosci 5 (January), 3. - PMC - PubMed

Publication types