. 2023 Nov 22;7(2):e202302211.
doi: 10.26508/lsa.202302211. Print 2024 Feb.

Megakaryocytes possess a STING pathway that is transferred to platelets to potentiate activation

Affiliations

Megakaryocytes possess a STING pathway that is transferred to platelets to potentiate activation

Firas El-Mortada et al. Life Sci Alliance. .

Abstract

Platelets display unexpected roles in immune and coagulation responses. Emerging evidence suggests that STING is implicated in hypercoagulation. STING is an adaptor protein downstream of the DNA sensor cyclic GMP-AMP synthase (cGAS) that is activated by cytosolic microbial and self-DNA during infections, and in the context of loss of cellular integrity, to instigate the production of type-I IFN and pro-inflammatory cytokines. To date, whether the cGAS-STING pathway is present in platelets and contributes to platelet functions is not defined. Using a combination of pharmacological and genetic approaches, we demonstrate here that megakaryocytes and platelets possess a functional cGAS-STING pathway. Our results suggest that in megakaryocytes, STING stimulation activates a type-I IFN response, and during thrombopoiesis, cGAS and STING are transferred to proplatelets. Finally, we show that both murine and human platelets contain cGAS and STING proteins, and the cGAS-STING pathway contributes to potentiation of platelet activation and aggregation. Taken together, these observations establish for the first time a novel role of the cGAS-STING DNA sensing axis in the megakaryocyte and platelet lineage.


Conflict of interest statement

M Lordkipanidzé has received speaker honoraria from Bayer and JAMP Pharma; has received research grants to the institution from Idorsia; has served on a national advisory board for Servier and JAMP Pharma; and has received in-kind support for investigator-initiated grants from Fujimori Kogyo. There are no other conflicts of interest to disclose.

Figures

Figure 1.
Figure 1.. STING stimulation of megakaryocytes induces a type-I interferon response.
(A) Brightfield images of megakaryocytes isolated using anti-CD41 magnetic beads at day 4 of in vitro differentiation. Enlargement shows the production of proplatelets (black arrows) by mature megakaryocytes. Scale bar: 30 µm. (B, C) Cytokine production analysis by ELISA of megakaryocytes stimulated with DMXAA for 5 h (B) and 24 h (C) showing a significant increase in IFNB and CCL5 cytokines, n = 4 independent experiments; each dot represents data from one independent experiment. The graph shows data ± STD, and data were analysed by unpaired two-tailed t tests, *P < 0.05. (D, E) Representative immunofluorescence images of megakaryocytes taken by confocal microscopy showing the localisation of cGAS or STING (red), ERp57 or lamin A/C (green), and chromatin (blue), representative of n = 3 independent experiments. Scale bars: 20 µm (D) and 15 µm (E). (F) Representative immunofluorescence images of CD41-positive (magenta for CD41+ and blue for DNA) and CD41-negative (only blue) cells taken by confocal microscopy. Representative images of more than n = 3 independent experiments. Scale bars: 30 µm.
Figure S1.
Figure S1.. Validation of cGAS presence in proplatelets.
Confocal images showing the presence of cGAS (red) in proplatelets of WT megakaryocytes and not in cGAS KO megakaryocytes. Megakaryocytes were stained with the cGAS antibody (rabbit anti-cGAS, D3080, Cat #531659S, dilution 1/500; Cell Signaling). Scale bars: 20 µm.
Figure S2.
Figure S2.. Validation of cGAS antibody.
Confocal images showing the specificity of cGAS antibody. Mouse embryonic fibroblasts (WT or cGAS KO) were stained with the cGAS antibody (rabbit anti-cGAS, D3080, Cat #31659S, dilution 1/500; Cell Signaling). DNA was stained using DAPI. Scale bars: 20 µm.
Figure S3.
Figure S3.. Validation of STING antibody.
Confocal images showing the specificity of STING antibody. Mouse embryonic fibroblasts (WT or STING KO) were stained with the STING antibody (rabbit anti-STING, D1V5L, Cat #50494S, dilution 1/500; Cell Signaling). Scale bars: 20 µm.
Figure 2.
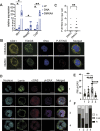
Figure 2.. STING stimulation induces the expression of interferon-stimulated genes.
(A) Gene expression analysis of sorted megakaryocytes (based on the expression of CD41 and CD42b) stimulated with DNA + Lipofectamine (DNA) or Lipofectamine only (LF) for 5 h or with DMXAA for 2 h showing the level of specific ISGs (Ifit1, Rsad2, Ccl5); each dot represents the data from one experiment. Data are shown as ± STD and were analysed by unpaired two-tailed t tests, *P ≤ 0.05 and **P ≤ 0.01. (B) Representative immunofluorescence images of WT megakaryocytes stimulated or not with DMXAA taken by confocal microscopy showing the localisation of CD41 (yellow), P-STING (red), TGN46 (green), and chromatin (blue). n = 3 independent experiments. Scale bars: 20 µm. (C) Quantification of P-STING intracellular foci between WT megakaryocytes stimulated or not with DMXAA. Each dot represents the number of foci in one megakaryocyte. Images were taken from n = 3 independent experiments. Data are shown as ± STD and were analysed by unpaired two-tailed t tests, **P ≤ 0.01. (D) Representative immunofluorescence image of megakaryocytes taken by confocal microscopy showing the localisation of cGAS (red), lamin A/C (green), and chromatin (blue) in relation to the amount of DNA damage (P-yH2AX) in the four stages of megakaryocyte’s maturation (one to four). Scale bars for lanes 1 and 2: 10 µm; and for lanes 3 and 4: 20 µm. (E) Quantification of the fluorescence mean intensity associated with the P-yH2AX DNA damage marker; each dot represents the measure for a single megakaryocyte; megakaryocytes were measured from at least n = 2 independent experiments. The graph shows data ± STD, and data were analysed by unpaired two-tailed t tests, **P ≤ 0.01 and ****P < 0.0001. (F) Schematic representation of the proportion of megakaryocytes from each stage in relation to cGAS localisation (nuclear, cytosolic, or both).
Figure S4.
Figure S4.. Validation of P-STING antibody.
Confocal images showing the specificity of P-STING antibody. Mouse embryonic fibroblasts (WT or STING KO) stimulated with DMXAA or DMSO as a control for 1 h were stained with the P-STING antibody (rabbit anti-P-STING, D1C4T, Cat #62912S, dilution 1/1,000; Cell Signaling). Scale bars: 20 µm.
Figure 3.
Figure 3.. STING drives a tonic type-I interferon response in megakaryocytes.
(A) Representative immunofluorescence images of WT and cGAS KO megakaryocytes taken by confocal microscopy showing the localisation of P-STING (red), tubulin (green), and chromatin (blue) showing an increase in P-STING fluorescence signal in WT megakaryocytes. (B, C) Quantification of P-STING intracellular foci (B) and of the fluorescence intensity (C) for P-STING in WT megakaryocytes compared with cGAS KO; each dot represents a single megakaryocyte image taken from n = 2 biological replicates. The graph shows data ± STD, and data were analysed by unpaired two-tailed t tests, ***P ≤ 0.001 and ****P < 0.00001. (D) Gene expression analysis of megakaryocytes treated with the STING inhibitor C176 for 48 h (500 nM for 24 h and 1 µM for 24 h) during differentiation showing a significant decrease in the expression levels of ISGs (Ifit1, Rsad2, Ifitm3, and Ccl5), n = 3 independent experiments in independent experiments. The graph shows data ± STD, and data were analysed by unpaired two-tailed t tests, *P < 0.05 and **P ≤ 0.01. (E) Gene expression analysis of WT or cGAS KO megakaryocytes after differentiation showing a decrease in the expression levels of selected ISGs (Ifit1 and Ccl5). Data shown are from n = 3 independent experiments. Data are shown as ± STD and were analysed by unpaired two-tailed t tests, *P < 0.05 and **P ≤ 0.01.
Figure 4.
Figure 4.. cGAS and STING stimulation potentiates the activation of platelets.
(A) Representative immunofluorescence image of a megakaryocyte taken by confocal microscopy showing the localisation of CD41 (yellow), cGAS or STING (red), tubulin (green), and chromatin (blue) in proplatelets. Images of megakaryocytes producing proplatelets were obtained from n = 3 independent experiments (average of 5 images per experiment). Scale bars: 25 µm. (B) Protein analysis by Western blotting of murine platelets isolated from cGAS WT or KO mice. Representative of n = 3 independent experiments. (C) cGAMP production was measured from washed platelets isolated from WT or cGAS KO mice stimulated with DNA + Lipofectamine (DNA) or Lipofectamine only (LF) for 30 min before analysing their lysates by specific cGAMP ELISA. Data shown (data ± STD) are from n = 3 biological replicates; each dot represents a single experiment, and data were analysed by unpaired two-tailed t tests, **P ≤ 0.01. (D) Representative immunofluorescence images of mouse platelets taken by confocal microscopy showing the localisation of STING (red) and CD41 (blue). Images of platelets were obtained from n = 2 independent experiments. Scale bars: 5 µm. (E, F) Flow cytometry analysis of CD62P surface expression on platelets isolated from WT and cGAS KO mice, stimulated with collagen alone or in combination with DNA. Collagen 1 µg/ml was used as a positive control. Platelets were first gated on FSC, SSC, and CD41 before the analysis of CD62P surface expression. Data are presented as % of platelets with CD62P above the unstimulated control. (F) Data shown are from n = 4 independent experiments; each dot represents a single experiment, and data were analysed by unpaired two-tailed t tests, *P ≤ 0.05. (E) Representative dot plot of CD62P expression levels for WT platelets.
Figure 5.
Figure 5.. cGAS and STING stimulation potentiates the aggregation of human platelets.
(A, B) Protein analysis by Western blotting of human platelets taken from five donors (lanes 1–5) for STING and four donors (lanes 6–7) for cGAS. (C, D) Human platelet aggregation after treatment with type-I collagen (1, 0.5, or 0.25 µg/ml), DNA, cGAMP, and vehicle alone (Lipofectamine); to test the capacity of DNA or cGAMP to potentiate aggregation, a sub-threshold dose of collagen was determined individually for each patient (col [i]) and used in combination with vehicle, DNA, or cGAMP. (C) Representative aggregation curves for one donor (C). Analysis of the maximum aggregation percentage for all donors. (D) Data shown are from n= 8 donors (the data from two donors were excluded based on our incapacity to obtain a sub-threshold dose of collagen to perform the potentiation experiment). The graph shows data ± STD, and data were analysed by unpaired two-tailed t tests, **P ≤ 0.01 and ****P < 0.0001.

References

    1. Ablasser A, Goldeck M, Cavlar T, Deimling T, Witte G, Röhl I, Hopfner KP, Ludwig J, Hornung V (2013) cGAS produces a 2′-5′-linked cyclic dinucleotide second messenger that activates STING. Nature 498: 380–384. 10.1038/nature12306 - DOI - PMC - PubMed
    1. Ahn J, Ruiz P, Barber GN (2014) Intrinsic self-DNA triggers inflammatory disease dependent on STING. J Immunol 193: 4634–4642. 10.4049/jimmunol.1401337 - DOI - PMC - PubMed
    1. Ahn J, Xia T, Rabasa Capote A, Betancourt D, Barber GN (2018) Extrinsic phagocyte-dependent STING signaling dictates the immunogenicity of dying cells. Cancer Cell 33: 862–873.e5. 10.1016/j.ccell.2018.03.027 - DOI - PMC - PubMed
    1. Anastasiou M, Newton GA, Kaur K, Carrillo-Salinas FJ, Smolgovsky SA, Bayer AL, Ilyukha V, Sharma S, Poltorak A, Luscinskas FW, et al. (2021) Endothelial STING controls T cell transmigration in an IFNI-dependent manner. JCI Insight 6: e149346. 10.1172/jci.insight.149346 - DOI - PMC - PubMed
    1. Barnett KC, Coronas-Serna JM, Zhou W, Ernandes MJ, Cao A, Kranzusch PJ, Kagan JC (2019) Phosphoinositide interactions position cGAS at the plasma membrane to ensure efficient distinction between self- and viral DNA. Cell 176: 1432–1446.e11. 10.1016/j.cell.2019.01.049 - DOI - PMC - PubMed

Publication types

LinkOut - more resources