. 2024 Jan 11;52(1):4-21.
doi: 10.1093/nar/gkad1081.

Reactivation of the G1 enhancer landscape underlies core circuitry addiction to SWI/SNF

Affiliations

Reactivation of the G1 enhancer landscape underlies core circuitry addiction to SWI/SNF

Katerina Cermakova et al. Nucleic Acids Res. .

Abstract

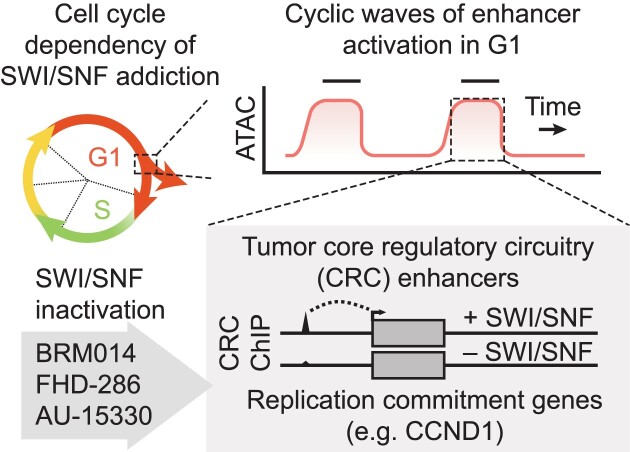
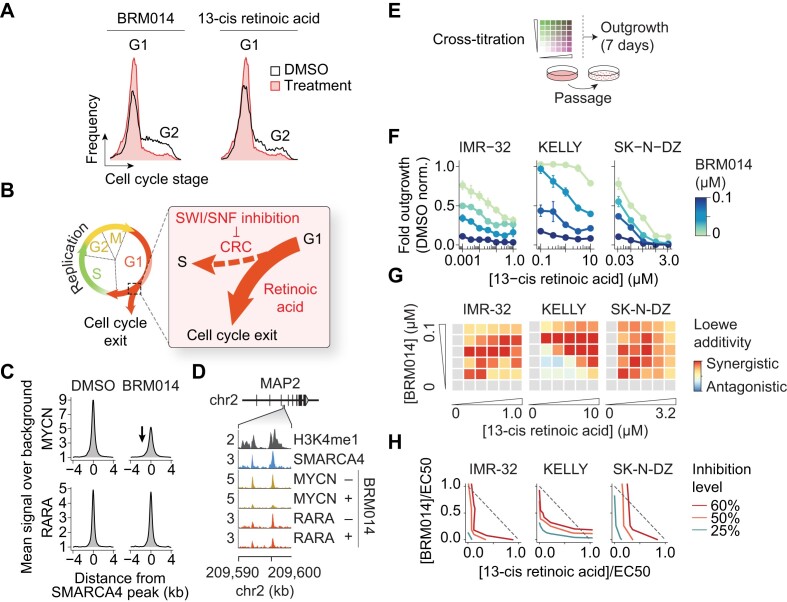
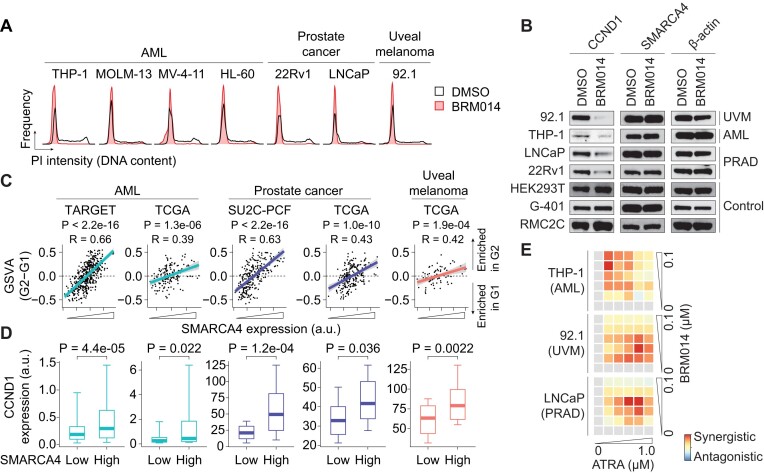
Several cancer core regulatory circuitries (CRCs) depend on the sustained generation of DNA accessibility by SWI/SNF chromatin remodelers. However, the window when SWI/SNF is acutely essential in these settings has not been identified. Here we used neuroblastoma (NB) cells to model and dissect the relationship between cell-cycle progression and SWI/SNF ATPase activity. We find that SWI/SNF inactivation impairs coordinated occupancy of non-pioneer CRC members at enhancers within 1 hour, rapidly breaking their autoregulation. By precisely timing inhibitor treatment following synchronization, we show that SWI/SNF is dispensable for survival in S and G2/M, but becomes acutely essential only during G1 phase. We furthermore developed a new approach to analyze the oscillating patterns of genome-wide DNA accessibility across the cell cycle, which revealed that SWI/SNF-dependent CRC binding sites are enriched at enhancers with peak accessibility during G1 phase, where they activate genes involved in cell-cycle progression. SWI/SNF inhibition strongly impairs G1-S transition and potentiates the ability of retinoids used clinically to induce cell-cycle exit. Similar cell-cycle effects in diverse SWI/SNF-addicted settings highlight G1-S transition as a common cause of SWI/SNF dependency. Our results illustrate that deeper knowledge of the temporal patterns of enhancer-related dependencies may aid the rational targeting of addicted cancers.

Plain language summary

Cancer cells driven by runaway transcription factor networks frequently depend on the cellular machinery that promotes DNA accessibility. For this reason, recently developed small molecules that impair SWI/SNF (or BAF) chromatin remodeling activity have been under active evaluation as anti-cancer agents. However, exactly when SWI/SNF activity is essential in dependent cancers has remained unknown. By combining live-cell imaging and genome-wide profiling in neuroblastoma cells, Cermakova et al. discover that SWI/SNF activity is needed for survival only during G1 phase of the cell cycle. The authors reveal that in several cancer settings, dependency on SWI/SNF arises from the need to reactivate factors involved in G1-S transition. Because of this role, authors find that SWI/SNF inhibition potentiates cell-cycle exit by retinoic acid.


Conflict of interest statement

None declared.

Figures

Graphical Abstract
Graphical Abstract
Figure 1.
Figure 1.
SMARCA4 is a targetable, tumor-specific vulnerability of adrenergic neuroblastoma (NB). (A) Crystal violet staining of adrenergic (ADRN) and mesenchymal (MES) NB or control cell lines treated with serial titration of SWI/SNF inhibitor BRM014. Orange squares indicate MYCN amplification or 1p36 deletion. Quantified in Supplementary Figure 3A. (B) Representative images of NB cells treated with lethal (1 μM) and sub-lethal (10–100 nM) BRM014 or vehicle control (DMSO). (C) Preparation of neural crest cells (NCCs) and NCC-derived peripheral neurons from human embryonic stem cells (hESCs). (D) Cell growth over time upon treatment with BRM014 or DMSO. Error bars: mean ± 95% confidence interval (N = 3 independent samples), abbreviations used as in (C). (E) Representative images of IMR-32 cells upon expression of shRNA mediating SMARCA4 or SMARCA2 knock-down, or non-targeting control (NTC). (F) Western blot analysis of SMARCA4 and SMARCA2 levels after SMARCA2 knock-down compared to NTC. (G) Western blot analysis of SMARCA4 and SMARCA2 levels in IMR-32 SMARCA4 degron-containing cell line (SMARCA4-EGFP-mAID) after 2 h of vehicle (EtOH) or auxin treatment. (H) Quantification of IMR-32 (WT) and SMARCA4-EGFP-mAID (mAID) cell line viability upon treatment with BRM014, auxin or vehicle controls for 96 h. Error bars: mean ± SE. (I) Experimental design of animal study. (J) Small animal MRI imaging and kidneys extracted from animals comparing BRM014- and vehicle-treated animals (N = 11 per group). (K) Tumor growth time course measured by small-animal MRI. Error bars: mean ± SE. (L) Comparison of tumor weights of BRM014 and vehicle control treated animals. Error bars: mean ± SE. (M) Representative H&E staining of tumor sections comparing BRM014- and vehicle-treated animals.
Figure 2.
Figure 2.
SMARCA4 sustains enhancer binding and expression of the adrenergic core regulatory circuitry (CRC). (A) DNA accessibility changes of CRC transcription factor (TF) binding motifs induced by BRM014 treatment plotted against sensitivity of NB cells to depletion of individual CRC TFs. (B) Histograms of CRC TFs occupancy changes upon 1 h or 4 h BRM014 treatment. N values for each factor's histogram correspond to the Venn diagram intersections in Supplementary Figure 6. (C) Similarity heatmap of CRC TFs occupancy changes upon 1 h of BRM014 treatment. (D) Enrichment of genomic features at SMARCA4-bound sites characterized by unchanged or decreased binding of individual CRC TFs. (E) Quantification of decreased CRC TFs at SMARCA4-targeted sites. (F) Browser tracks showing changes of MYCN and GATA3 binding at PHOX2B locus upon 1 h of BRM014 treatment. (G) Western blot time course of PHOX2B expression upon BRM014 treatment across MYCN-amplified NB cell lines. (H) Correlation between SMARCA4 and PHOX2B expression in human patient NB samples. (I) Model of SMARCA4 regulation of adrenergic NB CRC.
Figure 3.
Figure 3.
G1-S transition represents a unique window of sensitivity to SWI/SNF inhibition. (A) Decreased gene sets upon BRM014 treatment ranked by significance in NB cells. Cell cycle regulation-related gene sets are highlighted. (B) Depletion of S-phase genes upon SMARCA4 inactivation measured by gene set enrichment analysis. (C) Flow cytometry cell cycle analysis of cells upon time course treatment with BRM014 or DMSO (N = 4). (D) Quantification of cells in G1 phase from in vivo NB mouse model following BRM014 or vehicle control treatment. (E) FUCCI fluorescent cell cycle reporter system. (F) Representative images of FUCCI-labeled IMR-32 cells following treatment with BRM014 or DMSO. (G) Representative trajectory from real-time monitoring of FUCCI-labeled IMR-32 cells upon release from synchronization and treatment with drugs (N ≥ 4 independent replicates). Closed triangles indicate local signal maxima. Abbreviations: doxorubicin (Doxo); etoposide (Etop); nocodazole (Nocod). (H) Representative trajectory from real-time monitoring of cell cycle progression and cell death in synchronized and unsynchronized cells (N ≥ 4 independent replicates). Closed triangles indicate local signal maxima and open triangles indicate onset of cell death. (I) Timing of cell death onset following BRM014 treatment initiated at distinct phases of the cell cycle (N = 3 independent replicates). (J) Summary and interpretation: SWI/SNF activity is essential in G1 but dispensable for survival in other cell-cycle phases.
Figure 4.
Figure 4.
Temporal patterns of DNA accessibility reveal CRC losses are enriched at G1-specific enhancers regulated by SMARCA4. (A) FACS strategy and gating to analyze genome-wide accessibility of cells in individual cell cycle phases. (B) Example browser tracks of cell cycle-phase dependent site sensitive to SWI/SNF inactivation. (C) Classification of genome-wide SMARCA4 sites based on their cell cycle-phase dependent accessibility changes, and their response to SWI/SNF inactivation. (D) DNA accessibility changes upon BRM014 treatment at SMARCA4-bound clusters shown in panel (C). Box plot centers indicate median values. (E) Enrichment of sites with reduced CRC TF occupancy within clusters shown in panel (C). (F) Heatmap of cell cycle phase-specific accessibility changes of CCND1 enhancer, and browser tracks showing reduced accessibility in late G1 phase at CCND1 enhancer. Inset shows rapid loss of CRC TF binding at CCND1 enhancer within 1 h of BRM014 treatment. (G) Western blot analysis of CCND1 expression changes upon BRM014 treatment across NB cell lines. (H) Expression of CCND1 in NB patient tumors with low SMARCA4 expression compared to those with high SMARCA4 expression. Box plot centers indicate median values.
Figure 5.
Figure 5.
SWI/SNF inhibition synergizes with retinoic acid to promote cell-cycle exit in G1. (A) Flow cytometry cell cycle analysis of NB cells upon treatment with 13-cis retinoic acid (13-cis RA), BRM014, or vehicle control (DMSO). (B) Model by which SWI/SNF inhibitors sensitize cells to retinoic acid-mediated cell cycle exit. (C) Metagene plots of MYCN and retinoic acid receptor alpha (RARA) chromatin binding at SMARCA4 sites in the presence of BRM014 or DMSO. (D) Example ChIP-seq browser track demonstrating preserved RARA binding despite loss of MYCN binding. (E) Experimental design. (F) Outgrowth of NB cell lines following cross-titration of BRM014 and 13-cis RA. (G) Heatmap of synergy scores for BRM014 and 13-cis RA cross-titration across NB cell lines measured by Loewe additivity (N ≥ 3 independent replicates). (H) Isobolograms of BRM014 and 13-cis RA treatments demonstrating synergy (N ≥ 3 independent replicates).
Figure 6.
Figure 6.
SWI/SNF inhibition potentiates retinoic acid-induced growth arrest in diverse addicted cancers. (A) Cell cycle analysis of SWI/SNF-addicted cells using propidium iodide (PI) staining and flow cytometry following treatment with BRM014 or DMSO. (B) Western blot analysis of CCND1 upon BRM014 treatment in acute myeloid leukemia (AML), uveal melanoma (UVM), and prostate cancer (PRAD) cell lines compared to control cell lines. (C) Correlation between SMARCA4 expression and G1 or G2 cell cycle signatures in human patient samples determined by gene set variation analysis (GSVA). Linear regression of each dataset is presented. (D) Expression of CCND1 in SWI/SNF-addicted tumors with low SMARCA4 expression compared to those with high SMARCA4 expression. Error bars: median ± SE. (E) Heatmap of synergy scores for BRM014 and all-trans retinoic acid (ATRA) cross-titration measured by Loewe additivity.

References

    1. Chambers C., Cermakova K., Chan Y.S., Kurtz K., Wohlan K., Lewis A.H., Wang C., Pham A., Dejmek M., Sala M.et al.. SWI/SNF blockade disrupts PU.1-directed enhancer programs in normal hematopoietic cells and acute myeloid leukemia. Cancer Res. 2023; 83:983–996. - PMC - PubMed
    1. Shi J., Whyte W.A., Zepeda-Mendoza C.J., Milazzo J.P., Shen C., Roe J.S., Minder J.L., Mercan F., Wang E., Eckersley-Maslin M.A.et al.. Role of SWI/SNF in acute leukemia maintenance and enhancer-mediated Myc regulation. Genes Dev. 2013; 27:2648–2662. - PMC - PubMed
    1. Jubierre L., Soriano A., Planells-Ferrer L., París-Coderch L., Tenbaum S.P., Romero O.A., Moubarak R.S., Almazán-Moga A., Molist C., Roma J.et al.. BRG1/SMARCA4 is essential for neuroblastoma cell viability through modulation of cell death and survival pathways. Oncogene. 2016; 35:5179–5190. - PubMed
    1. Xiao L., Parolia A., Qiao Y., Bawa P., Eyunni S., Mannan R., Carson S.E., Chang Y., Wang X., Zhang Y.et al.. Targeting SWI/SNF ATPases in enhancer-addicted prostate cancer. Nature. 2022; 601:434–439. - PMC - PubMed
    1. Rago F., Elliott G.N., Li A., Sprouffske K., Kerr G., Desplat A., Abramowski D., Chen J.T., Farsidjani A., Xiang K.X.et al.. The discovery of SWI/SNF chromatin remodeling activity as a novel and targetable dependency in uveal melanoma. Mol. Cancer Ther. 2020; 19:2186–2195. - PubMed