. 2023 Nov 22;14(1):7617.
doi: 10.1038/s41467-023-41938-8.

A distinct topology of BTN3A IgV and B30.2 domains controlled by juxtamembrane regions favors optimal human γδ T cell phosphoantigen sensing

Affiliations

A distinct topology of BTN3A IgV and B30.2 domains controlled by juxtamembrane regions favors optimal human γδ T cell phosphoantigen sensing

Mohindar M Karunakaran et al. Nat Commun. .

Abstract

Butyrophilin (BTN)-3A and BTN2A1 molecules control the activation of human Vγ9Vδ2 T cells during T cell receptor (TCR)-mediated sensing of phosphoantigens (PAg) derived from microbes and tumors. However, the molecular rules governing PAg sensing remain largely unknown. Here, we establish three mechanistic principles of PAg-mediated γδ T cell activation. First, in humans, following PAg binding to the intracellular BTN3A1-B30.2 domain, Vγ9Vδ2 TCR triggering involves the extracellular V-domain of BTN3A2/BTN3A3. Moreover, the localization of both protein domains on different chains of the BTN3A homo-or heteromers is essential for efficient PAg-mediated activation. Second, the formation of BTN3A homo-or heteromers, which differ in intracellular trafficking and conformation, is controlled by molecular interactions between the juxtamembrane regions of the BTN3A chains. Finally, the ability of PAg not simply to bind BTN3A-B30.2, but to promote its subsequent interaction with the BTN2A1-B30.2 domain, is essential for T-cell activation. Defining these determinants of cooperation and the division of labor in BTN proteins improves our understanding of PAg sensing and elucidates a mode of action that may apply to other BTN family members.


Conflict of interest statement

B.E.W. provides consultancy regarding the development of γδ T cell immunotherapy approaches for Ferring Ventures SA, linked to Ferring Pharmaceuticals. T.H. is supported by Byondis B.V. for work not related to this study.

Figures
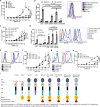
Fig. 1
Fig. 1. Loss of function of 3A1-V domain deleted molecules can be compensated in complexes with 3A2 or 3A3 molecules.
a 293T and BTN3 isoform-specific knockout cell lines were cocultured with titrated concentration of HMBPP and 53/4 human Vγ9Vδ2 TCR reporter cells. The activation of reporter cells was measured by mouse IL-2 ELISA (n-3). b The abovementioned presenting cells were pulsed with zoledronate and cocultured with HMBPP expanded primary Vγ9Vδ2T cells. The T cell activation was measured by immuno flow cytometry with CD107a expression as readout detected by anti-CD107a-PE and anti-Vδ2-FITC (n-3). Surface-expressed BTN3A of the abovementioned cells detected by mAb 103.2 followed by anti-mouse F(ab’)2-APC conjugate (right). c 293T, BTN3KO (3KO) cells and 3A-transductants (3A represents recombinant BTN3A molecules) of 3KO were cultured and tested as in (a) (n-3). Not shown are the results of 293T 3KO as they are consistently non-stimulatory. d Abovementioned presenting cells were tested as in (b) (n-4); their surface-expressed 3A-molecules were detected as in (b), and their corresponding total mCherry expression was presented as histograms (right). e Histograms representing the total and surface-expressed FLAG protein of fix-permeabilized and live 3KO cells transduced with FLAG-tagged IgVdeleted-BTN3A1 (V∆3A1) alone or cotransduced with other 3A-molecules detected by anti-FLAG and anti-mouse F(ab’)2-APC conjugate were analyzed by FACS. f 3KO cells transduced with FLAG-3A1 or V∆3A1, or V∆3A1+3A2 or + 3A3 were cocultured with 53/4 Vγ9Vδ2 TCR reporter cells, and T cell activation was measured as in (a) (n-3). g 3KO cells expressing FLAG-IgVdeleted-BTN3A2 (V∆3A2) alone or together with other BTN3As were analyzed as in (e). h 293T wt and 3KO cells transduced with 3A1 and/or V∆3A2 were analyzed as in (a) (n-3). i Schematic representations of different tagged constructs of 3A and 3A mutants. The number of independent experiments was represented as n. Graphical data are presented as mean with SD, and statistical analysis was performed using ordinary two-way ANOVA analysis.
Fig. 2
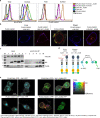
Fig. 2. The JM region regulates BTN3A protein and function.
a 293T 3KO cells transduced with FLAG-V∆3A1 alone and or cotransduced with N-terminus HA-tagged 3A-JM chimeras were analyzed in FACS for the total and surface expression of HA-3A molecules (Left) and FLAG-V∆3A1 (right). The measurements were presented as histograms. b A representative image of live (left) and fixed (right) 3KO cells transduced with FLAG V∆3A1, cotransduced with HA-3A1 or HA-3A1_A3JM chimera, that were stained with mouse anti-FLAG and rabbit anti-HA followed by anti-mouse-Alexa Fluor 647 (red) and anti-rabbit Alexa Fluor 555 (blue), respectively. 3KO-FLAG V∆3A1 cells additionally stained with BODIPY-FL-DHPE membrane dye (yellow). At least 6 images of 3KO cells expressing each construct were examined under live and fixed conditions. c 3KO cells transduced with FLAG-V∆3A1, HA-3A1, HA-3A1_A3JM, FLAG-V∆3A1+HA-3A1, and FLAG-V∆3A1+HA-3A1_A3JM were labeled as 1–5, were subjected to anti-FLAG immunoprecipitation (IP) and samples were blotted against human vinculin (input, top), FLAG (middle) and HA (bottom) for their input (left) and immunoprecipitated proteins (right) (n-2). d Schematic presentation of FLAG-V∆3A1-CFP, FLAG-3A1-CFP, 3A1-YFP and 3A1_A3JM-YFP constructs (left), scheme describing the FRET with 440 LED laser, D is the donor (CFP), A is the acceptor (YFP) and A will emit a signal when exited by D if it is close proximity showing FRET. e Two representative images for ratiometric FRET analysis of 3KO transduced with 3A1-YFP and FLAG-3A1-CFP (upper left) or FLAG-V∆3A1-CFP (lower left); 3KO transduced with 3A1_A3JM-YFP and FLAG-3A1-CFP (upper middle) or FLAG-V∆3A1-CFP (lower middle); FRET ratio (FR) calculated chart (right).
Fig. 3
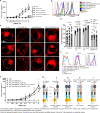
Fig. 3. Homologous 3A3_JM and heterologous 3A_JM promote optimal stimulation via inter-BTN3 PAg signaling.
a 293T and 3KO transductants of 3A-constructs were cultured with HMBPP and 53/4 human Vγ9Vδ2 TCR reporter cells. The activation of reporter cells was measured by mouse IL-2 ELISA (n-3). b Surface-expressed 3A-proteins of the abovementioned cells detected by mAb 103.2 followed by anti-mouse F(ab’)2-APC conjugate (left) and their corresponding total mCherry expression (right) were presented as histograms. c The cellular distribution of BTN3A-mC fusion constructs is presented as images captured by confocal microscopy. At least 10 images of 3KO cells expressing each construct were analyzed, and 3 representative images of 3KO cells expressing each construct are shown here. d mCherry fusion constructs of 3A or 3A-JM chimera transduced 3KO cells were subjected to FRAP in the presence of pamidronate (250 μM) and mAb 20.1 (10 μg/mL) as previously reported, and the percentage of the immobile fraction of BTN3A-mC was measured. The number of cells (n) subjected to FRAP for 3KO_3A1mC (n-15) and other cell types (n-10) for each condition. e 293T, 3KO transduced with mCherry fusion constructs of 3A3_R381H, 3A3_K136A_R381H, and cotransduced with eGFP reporter constructs of 3A1_H381R or 3A3 were analyzed by FACS for their total mCherry, total GFP, and surface-expressed BTN3As shown as histograms as in (b) (bottom right). f The abovementioned cells were tested as in (a) (n-3). The inferred intermolecular signaling within the BTN3A proteins viz 3A3_R381H, 3A3-K136A-R381H, and 3A3/3A1_H381R and the observed stimulation strength was presented as a scheme in (g) iii, iv and v, respectively. g Schematic presentation of inferred intermolecular signaling within the BTN3A proteins correlated to the observed outcomes in terms of 53/4 human Vγ9Vδ2 TCR reporter activation strength with antigen-presenting cells (3KO) expressing V∆3A2 and 3A1 (i, represents Fig. 1h), V∆3A1 and 3A2 (ii, represents Fig. 1f) including the 3A-constructs mentioned in (f); Graphical data are presented as mean with SD were analyzed by ordinary two-way ANOVA (a, f) or multiple t-tests analysis (d) with statistical significance determined using the Bonferroni-Dunn method and SD was shown as error bars.
Fig. 4
Fig. 4. JM regions modulate the conformation of BTN3A dimers.
a Amino acid sequences of juxtamembrane (JM) region of BTN3A1, BTN3A2, BTN3A3, and alpaca BTN3 (Vp) were aligned, and KKK and ETE residues of BTN3A1 and BTN3A3 were marked in red and blue, respectively. b Total and surface-expressed FLAG protein of permeabilized and live 3KO cells transduced with FLAG V∆3A1 alone or cotransduced with 3A3 or 3A3_KKK mutant detected by anti-FLAG and anti-mouse F(ab’)2-APC conjugate were shown as histograms. c 3KO cells transduced with 3A1mC, 3A3_R381H-mC, or 3A3_R381H_KKK-mC mutant were cocultured with 53/4 Vγ9Vδ2 TCR reporter cells and titrated concentration of HMBPP. The activation of reporter cells was measured by mouse IL-2 ELISA (n-3). d Models of the BTN3-JM coiled-coil dimers. Models of the predicted JM coiled-coil dimers Q273–L312 were generated using CCBuilder2 (see “Methods”). Dimer interface residues at positions 283–285 are shown as ball and stick. (I) BTN3A3 coiled-coil homodimer, (II) BTN3A2 coiled-coil homodimer, (III) Alpaca BTN3 (VpBTN3) coiled-coil homodimer, (IV) BTN3A1 coiled-coil homodimer, (V) BTN3A1-BTN3A2 coiled-coil heterodimer, (VI) BTN3A1-BTN3A3 coiled-coil heterodimer, (VII) BTN3A3-KKK (replacing ETE with KKK at positions 283–285) coiled-coil homodimer. Polar interactions are highlighted (red dashed lines). Each monomer within the homodimer has been labeled A or B. Graphical data are presented as mean with SD and analyzed by ordinary two-way ANOVA and SD was shown as error bars.
Fig. 5
Fig. 5. 4-M-HMBPP-bound BTN3A1 did not interact with the BTN2A1-B30.2 domain.
ITC titrations show that 4-M-HMBPP binds to BTN3A1 but does not support the binding of BTN3A1 to BTN2A1. a Structure of HMBPP and 4-M-HMBPP. b Titration of 960 μM 4-M-HMBPP into the buffer. c Titration of 960 μM 4-M-HMBPP into 60 μM BTN3A1 BFI. d Titration of 600 μM BTN2A1 ID271 into 60 μM BTN3A1 BFI. e Titration of 300 μM BTN2A1 ID271 into a mixture of 60 μM BTN3A1 BFI and 120 μM HMBPP. f Titration of 300 μM BTN2A1 ID271 into a mixture of 60 μM BTN3A1 BFI and 120 μM 4-M-HMBPP. Results are representative of n-3 independent experiments; 3A1 BFI—BTN3A1 intracellular domain (JM+B30.2 domain); 2A1 ID271—BTN2A1 intracellular domain (JM+B30.2 domain).
Fig. 6
Fig. 6. PAg induced Vγ9Vδ2 T cell activation by BTN3A-BTN2A1 composite ligand.
In a resting state of the target cell, the heteromeric BTN3A (BTN3A1-BTN3A2/BTN3A3) interacts with BTN2A1 via their V-domains, and the BTN2A1-V domain interacts with germline-encoded HV4 and CDR2 regions of Vγ9 chain of Vγ9Vδ2 TCR. Such interaction may act like a tonic TCR signal for maintaining homeostasis or even could be involved in the thymic selection of T cells. However, in case of stress in the target cell, the accumulated PAg (red) binds to the B30.2 domain of BTN3A1, which further interacts with the B30.2 domains of BTN2A1. Consequently, the heteromeric JM region in the BTN3A complex permits the formation of appropriate topology of the V-domain of partnering BTN3A (BTN3A2/BTN3A3) distal to the PAg-B30.2 domain of BTN3A1. This complex, on its own or in combination with an unknown hypothetical ligand, combines molecular interactions mediated by both BTN2A1 and BTN3A2/A3 with the TCR, surpassing the threshold for TCR triggering to permit γδ T cell activation.

Update of

References

    1. Kabelitz D, Serrano R, Kouakanou L, Peters C, Kalyan S. Cancer immunotherapy with γδ T cells: many paths ahead of us. Cell Mol. Immunol. 2020;17:925–939. doi: 10.1038/s41423-020-0504-x. - DOI - PMC - PubMed
    1. Kunkele, K. P. et al. Vγ9Vδ2 T cells: can we re-purpose a potent anti-infection mechanism for cancer therapy? Cells9, 829 (2020). - PMC - PubMed
    1. Mensurado S, Blanco-Dominguez R, Silva-Santos B. The emerging roles of γδ T cells in cancer immunotherapy. Nat. Rev. Clin. Oncol. 2023;20:178–191. doi: 10.1038/s41571-022-00722-1. - DOI - PubMed
    1. Casorati G, De Libero G, Lanzavecchia A, Migone N. Molecular analysis of human gamma/delta+ clones from thymus and peripheral blood. J. Exp. Med. 1989;170:1521–1535. doi: 10.1084/jem.170.5.1521. - DOI - PMC - PubMed
    1. Gober HJ, et al. Human T cell receptor γδ cells recognize endogenous mevalonate metabolites in tumor cells. J. Exp. Med. 2003;197:163–168. doi: 10.1084/jem.20021500. - DOI - PMC - PubMed

Publication types