. 2023 Nov 22;14(1):7630.
doi: 10.1038/s41467-023-42763-9.

Distinct transcriptomic profiles in children prior to the appearance of type 1 diabetes-linked islet autoantibodies and following enterovirus infection

Affiliations

Distinct transcriptomic profiles in children prior to the appearance of type 1 diabetes-linked islet autoantibodies and following enterovirus infection

Jake Lin et al. Nat Commun. .

Abstract

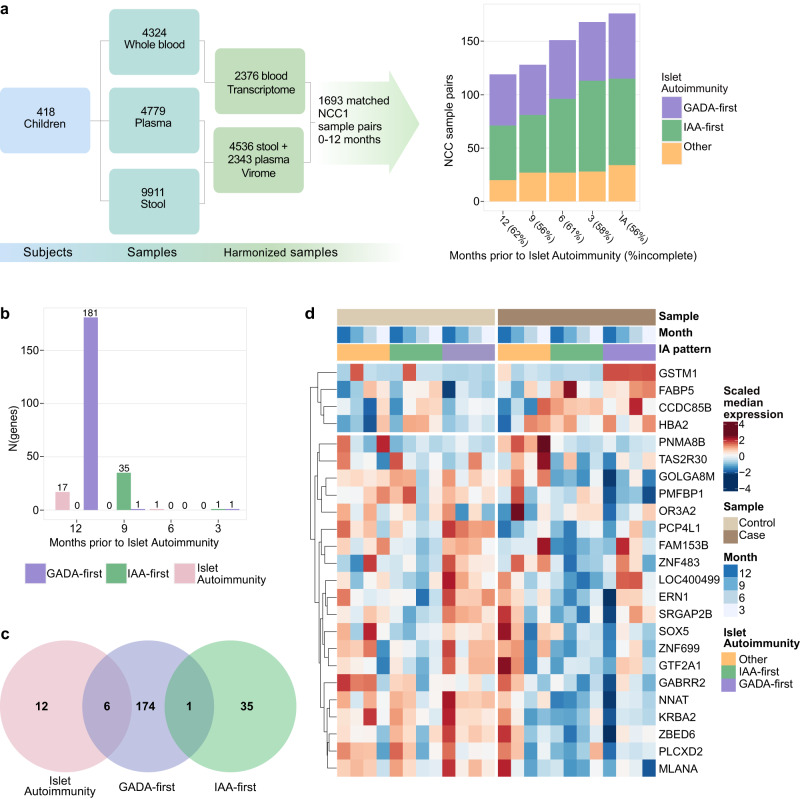
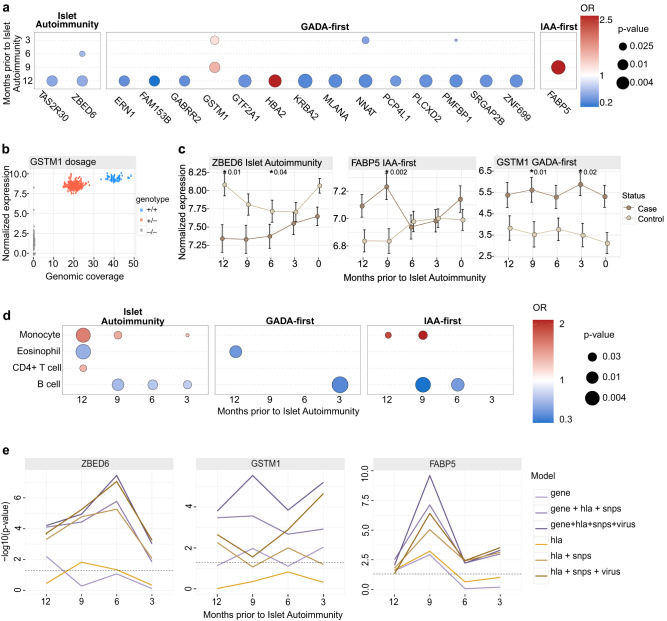
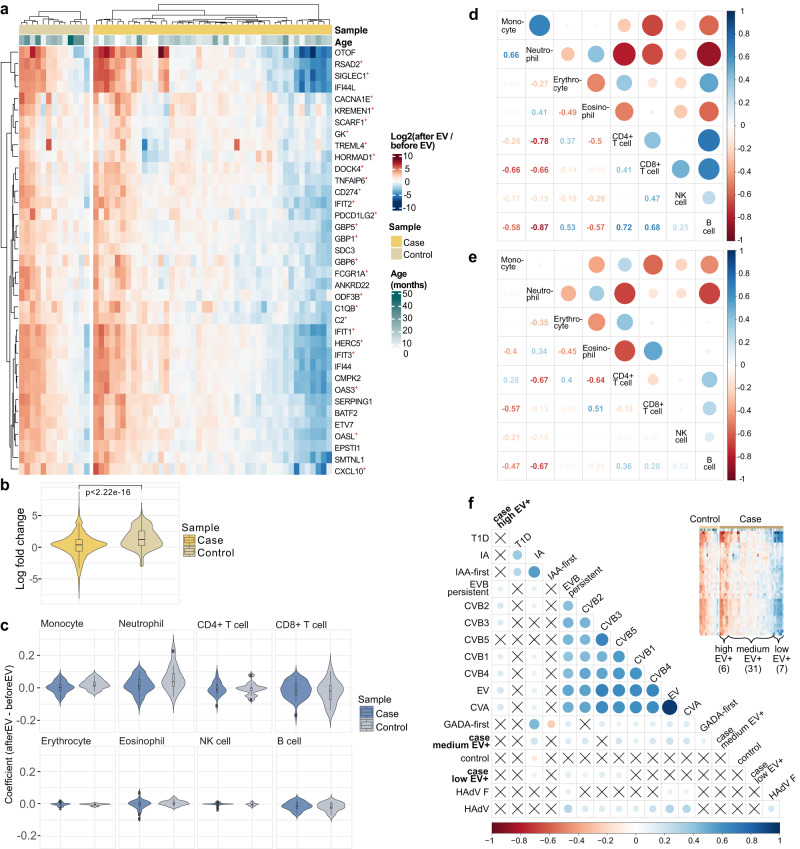
Although the genetic basis and pathogenesis of type 1 diabetes have been studied extensively, how host responses to environmental factors might contribute to autoantibody development remains largely unknown. Here, we use longitudinal blood transcriptome sequencing data to characterize host responses in children within 12 months prior to the appearance of type 1 diabetes-linked islet autoantibodies, as well as matched control children. We report that children who present with insulin-specific autoantibodies first have distinct transcriptional profiles from those who develop GADA autoantibodies first. In particular, gene dosage-driven expression of GSTM1 is associated with GADA autoantibody positivity. Moreover, compared with controls, we observe increased monocyte and decreased B cell proportions 9-12 months prior to autoantibody positivity, especially in children who developed antibodies against insulin first. Lastly, we show that control children present transcriptional signatures consistent with robust immune responses to enterovirus infection, whereas children who later developed islet autoimmunity do not. These findings highlight distinct immune-related transcriptomic differences between case and control children prior to case progression to islet autoimmunity and uncover deficient antiviral response in children who later develop islet autoimmunity.


Conflict of interest statement

H.H. is a shareholder and chairman of the board of Vactech, and a member of the Scientific Advisory Board of Provention Bio, which develops vaccines against picornaviruses and CVB. The remaining authors declare no competing interests.

Figures

Fig. 1
Fig. 1. Temporal gene expression patterns differ in IAA-first and GADA-first islet autoimmunity seroconversion types.
a TEDDY Nested Case-Control (NCC1) islet autoimmunity cohort and subsequent virome and sample harmonization yielding 1693 matched samples in 312 case-control pairs. These samples are further mapped as GADA-first (105 pairs in which the case child developed GADA as the first appearing IAb), IAA-first (140 pairs with IAA as the first appearing IAb) and Other (67 pairs with GADA and IAA seroconverted at the same time or IA2A detected first). b On each time point prior to seroconversion, statistical testing using DESeq2 is applied to compare the gene expression in case and matched control. The bar chart indicates the selected number of genes passing the threshold of adjusted p-value <0.05 and |LFC|>0.5. The statistics for the genes significant at each time point are listed in Supplementary Data 2. c The Venn diagram shows distinct gene sets for full islet autoimmunity, IAA-first, and GADA-first cohorts. d Differentially expressed genes with consistent temporal pattern selected from the full islet autoimmunity, GADA-first and IAA-first cohorts. For visualization expression of each gene is scaled to have zero mean and unit variance.
Fig. 2
Fig. 2. Distinct temporal patterns across selected islet autoimmunity associated genes and immune cell types.
a Conditional logistic regression analysis for differentially expressed genes between case and control children in different time points prior to IAb seroconversion. Associated p-values are indicated by the dot size and odds ratios (OR) by shades of red (>1, positively associated to islet autoimmunity NCC1, implying a higher risk for higher gene expression) and blue (<1, negatively associated to islet autoimmunity NCC1, which can be inferred as the higher gene expression being protective). P-values are unadjusted due to the nested case-control setting. b GSTM1 gene dosage effect in the full islet autoimmunity NCC1 cohort. Genotype is indicated with color: +/+ is for diploid, +/− for hemizygous deletion, and −/− for homozygous deletion. c Line plots covering 0-12 months prior to seroconversion showing the mean temporal differences in islet autoimmunity NCC1 cases and controls as illustrated by representative genes, selected based on known biological function, ZBED6 (full islet autoimmunity NCC1), GSTM1 (GADA-first) and FABP5 (IAA-first), with error bar showing the standard error of the mean (±sem) and highlighting the significant p-values derived from conditional logistic regression analysis (Supplementary Data 4). Temporal expression patterns for other genes are shown in Supplementary Figs. 5–7 and their detailed statistics, including log fold change and adjusted p-value are listed in the Supplementary Data 4. d Conditional logistic regression analysis identifies distinct immune cell type profiles for the full islet autoimmunity NCC1, GADA-first, and IAA-first seroconversion sets. IAA-first is shown to have more aberrant cell type profiles. The dot size and color have the same meaning as in a. e Using likelihood ratio test and as shown with ZBED6 (full islet autoimmunity NCC1), GSTM1 (GADA-first) and FABP5 (IAA-first) models, discrimination performances were consistently improved with the inclusion of gene, hla, SNPs and virus. Other putative temporal markers are shown in Supplementary Data 8 and Supplementary Fig. 12.
Fig. 3
Fig. 3. Multi-omics analysis reveals differences in antiviral response between case and control children prior to islet autoimmunity.
a 37 differentially expressed (DESeq2 adjusted p < 0.05, |LFC|>1) genes (DEGs) were detected in control children when comparing between samples prior and after enterovirus infection (EV+). All detected genes were upregulated after infection. Among islet autoimmunity NCC1 cases no DEGs were detected. 26 of the genes detected from control, indicated with +, are linked to the innate immunity (Welsh paired T-test, p-value 7.01e−06), suggesting a clear innate immune response in controls. Heatmap visualizes the individual LFCs of gene expression. b Distribution of LFCs for the genes in Fig. 3a (two-sided Wilcoxon rank sum test). c The EV infections related differences in estimated cell type proportions for cases and controls. Neutrophil proportions increase upon EV infection. In controls, monocyte proportions tend to increase while CD8+ T cell proportions decrease upon EV infection. Conditional logistic regression results in Supplementary Data 14. Correlation map between different immune cell types in controls (d, Supplementary Data 13a) and cases (e, Supplementary Data 13b) based on the samples taken before and after EV infection. The rows and columns correspond to the cell types. In the upper triangle, circle color and size indicate the Pearson correlation coefficient and the lower triangle shows the exact values. f Correlation map of seroconverted cases partitioned by strength of immune response (high, medium, low) upon EV infections and host inflammation episodes. The low responders, partitioned on the right, are found to be correlated with coxsackievirus B (CVB) but not coxsackievirus A (CVA) and human adenovirus F (HAdV F). Circle color and size indicate the associated Pearson correlation coefficient and coefficients with p-value > 0.05 are crossed over. For boxes in b&c: center lines, median; box limits, upper and lower quartiles; whiskers, values within 1.5 × IQR of the top and bottom quartiles.

References

    1. Bottazzo GF, Florin-Christensen A, Doniach D. Islet-cell antibodies in diabetes mellitus with autoimmune polyendocrine deficiencies. Lancet. 1974;2:1279–1283. doi: 10.1016/S0140-6736(74)90140-8. - DOI - PubMed
    1. MacCuish AC, Irvine WJ, Barnes EW, Duncan LJ. Antibodies to pancreatic islet cells in insulin-dependent diabetics with coexistent autoimmune disease. Lancet. 1974;2:1529–1531. doi: 10.1016/S0140-6736(74)90281-5. - DOI - PubMed
    1. Knip M. Type 1 diabetes mellitus is a heterogeneous disease. Nat. Rev. Endocrinol. 2017;13:1. doi: 10.1038/nrendo.2017.84. - DOI - PubMed
    1. Battaglia M, et al. Introducing the endotype concept to address the challenge of disease heterogeneity in type 1 diabetes. Diabetes Care. 2020;43:5–12. doi: 10.2337/dc19-0880. - DOI - PMC - PubMed
    1. Maitra, K. & Abbas, A. K. The endocrine system. In Robbins and Cotran Pathologic basis of disease 7th edn, (eds Gruliow, R. & Schmitt, W.) 1155–1226 (Elsevier, Philadelphia, 2005).

Publication types