. 2023 Nov 22;14(1):7619.
doi: 10.1038/s41467-023-43491-w.

Mid-old cells are a potential target for anti-aging interventions in the elderly

Affiliations

Mid-old cells are a potential target for anti-aging interventions in the elderly

Young Hwa Kim et al. Nat Commun. .

Abstract

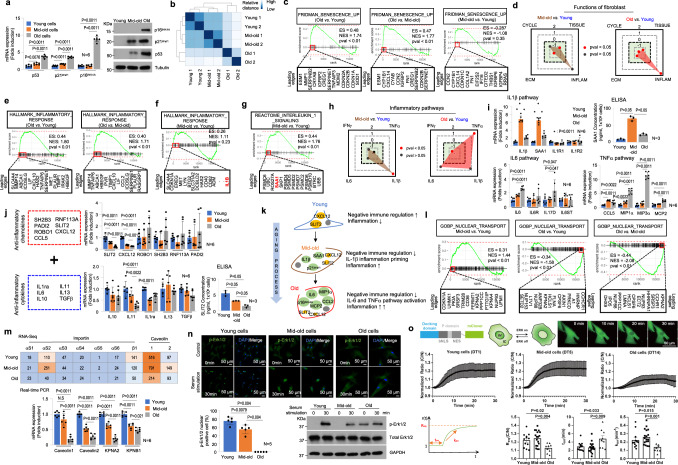
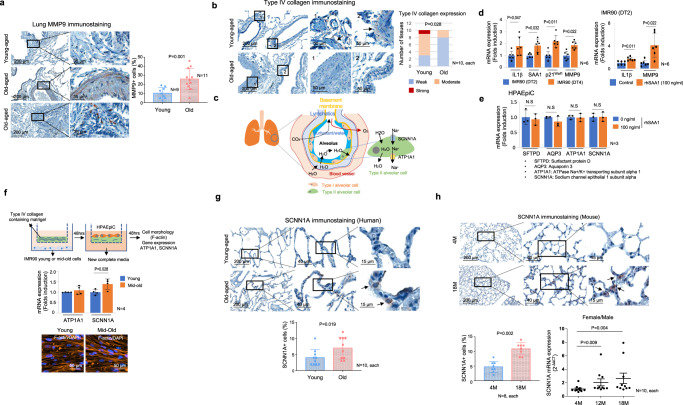
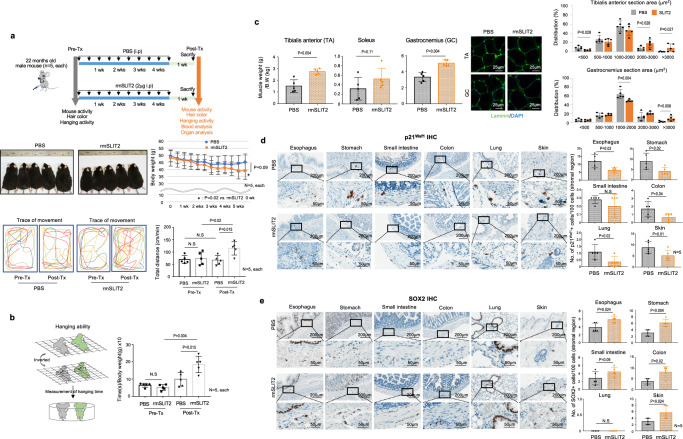
The biological process of aging is thought to result in part from accumulation of senescent cells in organs. However, the present study identified a subset of fibroblasts and smooth muscle cells which are the major constituents of organ stroma neither proliferative nor senescent in tissues of the elderly, which we termed "mid-old status" cells. Upregulation of pro-inflammatory genes (IL1B and SAA1) and downregulation of anti-inflammatory genes (SLIT2 and CXCL12) were detected in mid-old cells. In the stroma, SAA1 promotes development of the inflammatory microenvironment via upregulation of MMP9, which decreases the stability of epithelial cells present on the basement membrane, decreasing epithelial cell function. Remarkably, the microenvironmental change and the functional decline of mid-old cells could be reversed by a young cell-originated protein, SLIT2. Our data identify functional reversion of mid-old cells as a potential method to prevent or ameliorate aspects of aging-related tissue dysfunction.


Conflict of interest statement

The authors declare no competing interests.

Figures

Fig. 1
Fig. 1. Characteristics of young, mid-old, and old cells in vitro.
a mRNA (left panel) and protein (right panel) levels of representative senescence markers (p53, p21Waf1, and p16INK4A) in young, mid-old, and old cells are shown. b Relative distances represented as VST using count data from young, mid-old, and old samples are shown (n = 2, each). c GSEA using the “FRIDMAN: senescence up” gene set in old vs. young (left panel), old vs. mid-old (middle panel), and mid-old vs. young cells (right panel) (adjp = 0.0029, 0.016, and 0.53, respectively). d NES calculated from GSEA using gene sets representing fibroblast functions are presented. The gene sets include “CYCLE” representing self-replicative ability, “ECM” representing ECM productive ability, “TISSUE” representing tissue regeneration ability, and “INFLAM” representing inflammation-regulating ability. Used gene sets and related statistics for this analysis can be found in Supplementary Data 2. e, f GSEA of old vs. young, old vs. mid-old, and mid-old vs. young using the “HALLMARK: inflammatory response” gene set is shown (adjp = 0.0075, 0.0087 for (e), and 0.31 for (f), respectively). g GSEA of mid-old vs. young using the “REACTOME: interleukin 1 signaling pathway” gene set is shown (adjp = 0.018). h NES calculated from GSEA using gene sets representing the inflammatory pathway are shown. Used gene sets and related statistics in this analysis can be found in Supplementary Data 2. i The mRNA levels of multiple inflammatory pathways related genes and SAA1 protein level were analyzed by real time PCR and ELISA analysis. j A list of analyzed genes that act as anti-inflammatory chemokines and cytokines used in this study is shown (left panel). The mRNA levels of the listed genes are shown (middle panel). ELISA analysis of SLIT2 in young, mid-old, and old cells (right lower panel). k A schematic image illustrating the characteristics of young, mid-old, and old cells with representative gene expression. l GSEA using the “GOBP: nuclear transport” gene set in mid-old vs. young (left panel), old vs. young (middle panel) and old vs. mid-old (right panel) cells is shown (adjp =  0.085, 0.046, and 0.042, respectively). m The mRNA expression of nuclear transport-related genes in RNA-seq (upper panel). The figures in the box represent FPKM counts. S1-6 represents the subunits of the importin α. Real-time PCR results of nuclear transport-related genes are shown (lower panel). n Erk1/2 phosphorylation and nuclear translocation were analyzed after serum stimulation for 30 min (upper panel). Quantification of the number of cells with p-Erk1/2 nuclear translocation (lower left panel). p-Erk1/2 level was analyzed by western blot (lower right panel). o Investigation of p-Erk1/2 translocation dynamics. Schematic illustration of Erk1/2-KTR-mClover system and kinetic parameters (left upper and left lower). Young (n = 4), mid-old (n = 6), and old (n = 3) cells were assessed with the system, respectively. Three independent experiments were repeated. Representative images of Erk1/2-KTR-mClover translocation (right upper). Erk1/2-KTR-mClover translocation C/N curves for each cell type (middle). Cells were starved for 24 h with serum free media prior to experiments. Fluorescent images were acquired every 15 sec for 30 min after serum stimulation. Comparison of translocation kinetic parameters between cell types (lower panel). The p value in (a), (i), (j), and (mo) was calculated using the one-tailed Mann–Whitney U-test. The p values in (ch), and (i) are obtained using GSEA statistics in ‘fgsea’ package. ES enrichment score, NES normalized enrichment score, adjp = adjusted p value. The graph in (a), (i), (j), and (mo) was represented as mean ± SD. A thousand times of permutations were performed for adjustment in (ch) and (l).
Fig. 2
Fig. 2. Mid-old specific gene expression in old-aged tissues.
ad Representative images of p21Waf1, SAA1, IL1β and SLIT2 IHC analysis in young and old-aged human colon and lung tissues are shown. “1” and “2” indicate high-magnification views of the original figure. Image “1” primarily depicts the epithelium and smooth muscle region, while image “2” depicts a stromal-rich region. Black arrows indicate stained cells in the stromal region. Yellow arrow in (d) indicate SLIT2-positive cells in epithelial region. Corresponding quantification dot plots are shown in the right panel of each figure. IHC results were presented as the percentage of positive cells in the stromal or epithelial region. The p value was calculated using the one-tailed Mann–Whitney U-test. The graphs in (b) (right tables) and (d) (lower right table) were represented as mean + SD. The graphs in (a), (b) (left tables), (c), and (d) (left tables) were represented as mean ± SD.
Fig. 3
Fig. 3. The Effect of SAA1 on old-aged tissues.
a Schematic drawing of the effect of SAA1 on tissue. b Young fibroblasts or c smooth muscle cells (PASMCs) were treated with rhSAA1 for 24 h and SASP expression was analyzed using real-time PCR (left panel). MMP9 protein expression was analyzed by ELISA (right panel). d Serially dissected human colon tissues were subjected to IHC analysis for SAA1 and MMP9. Corresponding quantification data is shown in the right panel. IHC results were presented as the percentage of positive cells in the stromal region. e PASMCs were treated with rhSAA1 at the indicated concentration for 24 h and real-time PCR was performed using primers for atrophy-related genes. f IHC analysis for SAA1 in colon tissue from young and elderly subjects, and muscular mucosa thickness was measured. g IHC analysis for type IV collagen of colon tissues from young and elderly subjects is shown. “1” and “2” indicate high-magnification views of the original figure (left panel). Each protein expression was presented as weak, moderate, and strong (right upper panel). mRNA expression level of COL4A1 and COL4A2 in fibroblasts/smooth muscle cells was analyzed between young and old subjects in scRNA-seq data set (GSE178341) (right lower panel). h COL4A1, COL4A2 and COL4A3 gene-expression were analyzed by real-time PCR in young, mid-old, and old fibroblasts (upper panel). Young fibroblasts were treated rhSAA1 for 24 h, and mRNA expression level of type IV collagen was analyzed (lower panel). i In vitro Matrigel degradation assay results are shown. Matrigel-coated membrane was co-cultured with young or mid-old fibroblasts for 2 days. Degradation of type IV collagen was analyzed using western blotting. Three independent experiments were performed to get similar results. j Cell morphology was analyzed using F-actin staining (left panel) and functional marker expression was measured using real-time PCR analysis (right panel) in HCoEpiC. k NHE3 immunostaining in human (upper panel) and mouse (lower panel) colon tissue. NHE3 was stained in the apical region of the colon epithelium. Each protein expression status indicates weak, moderate, and strong. The p values of figure (bf), (g) (lower graph), (h), and (j) are obtained from the one-tailed Mann–Whitney U test. The p values of figure (g) (upper graph) and (k) are obtained from Chi-square test. The graph in (bh), and (j) was represented as mean ± SD.
Fig. 4
Fig. 4. The Functional role of BM degradation in the lung tissue of the elderly.
a IHC analysis of human lung tissues were subjected for MMP9. Quantification data of IHC results is shown in the right panel. b IHC analysis of Type IV collagen was performed on lung tissue obtained from elderly and young subjects. High-magnification views of the original figure are represented as “1” and “2”. c The schematic image illustrates the process of water exchange in the lung. Alveolar water absorption is regulated by the uptake of Na+ ions through the apical SCNN1A channel and the basolateral ATP1A pump in type II alveolar cells. d IMR90 lung fibroblasts were sub-cultured to generate mid-old cells (DT 4 days). The mRNA expression of mid-old cell markers in young and mid-old IMR90 cells is shown in the left panel. Young IMR90 cells were treated with rhSAA1 for 24 h, and the mRNA expression of IL1β and MMP9 was analyzed in the right panel. e HPAEpiC were treated with rhSAA1 (100 ng/ml) for 24 h, and the expression of SFTPD, AQP3, ATP1A1, and SCNN1A was analyzed using real-time PCR. f HPAEpiC were cultured on the Matrigel-coated membrane for 2 days, and the expression levels of ATP1A1 and SCNN1A were analyzed using real-time PCR. g IHC analysis of SCNN1A in human lung tissue is shown. Arrows indicate SCNN1A-expressing cells. Quantification data of IHC results is shown in the lower panel. h IHC analysis of SCNN1A in mouse lung tissue is shown. Arrows indicate SCNN1A-positive cells. Quantification data of IHC results is shown in the left lower panel. The mRNA expression level of SCNN1A was analyzed in the mouse lung tissue is shown (right lower panel). IHC results were presented as the percentage of positive cells in the stromal or epithelial region. The p values of (a), (dg), and (h) are obtained from the one-tailed Mann–Whitney U test. The p value of (b) is obtained using Chi-square test. The graphs in (a) and dh) were represented as mean ± SD.
Fig. 5
Fig. 5. Young cell-driven factors reverse the phenotype of mid-old cells.
a A schematic drawing of the stromal cell population according to the aging process is shown. b Mid-old cells are co-cultured with young or mid-old cells for 30 days, respectively. IF staining for Ki67 was performed (left upper panel). Quantification data for Ki67 is shown in the right upper panel. The cell size was compared and quantified (left lower panel). After 30 days of co-culture, cell growth rates were measured over a period of 10 days (right lower panel). c EdU incorporation assay. Mid-old cells co-cultured with young or mid-old cells for 30 days and then analyzed EdU incorporation. Quantification data is shown in the lower panel. d GSEA was performed in mid-old cells co-cultured with young and mid-old cells, respectively (n = 2, each). Functional gene sets of fibroblasts including “CYCLE” representing self-replicative ability, “ECM” representing ECM productive ability, “TISSUE” representing tissue regeneration ability, and “INFLAM” representing inflammation-regulating ability were analyzed. Used gene sets and related statistics for this analysis can be found in Supplementary Data 2. e GSEA was performed for “GOBP: mitotic cell cycle”, “GOBP: DNA replication”, “GOMF: extracellular matrix structural constituent”, “GOBP: tissue migration”, and “Hallmark: inflammatory response” (adjp = 0.038, 0.038, 0.038, 0.038, and 0.11). The p value and adjp are obtained using GSEA statistics in ‘fgsea’ package. ES: enrichment score; NES: normalized enrichment score; adjp: adjusted p value. f The mRNA expression of inflammatory, anti-inflammatory genes, and ECM-related molecules in mid-old cells co-cultured with young or mid-old cells (upper panel). ELISA analysis of IL1β and SAA1 in mid-old cells co-cultured with young or mid-old cells (lower panel). g The expression level of Lnc-RNAs was measured using real-time PCR in young, mid-old, and old cells (upper panel). Lnc-RNAs were isolated from multiple cellular compartments and shown using conventional real time-PCR (lower panel). h Mid-old cells were infected with lentivirus harboring Lnc-SBLC for 4 days. Cell morphology (upper panel) was observed and p53 and p21Waf1 expression were analyzed using real-time PCR (left lower panel) and western blot analysis (right lower panel). i The upper panel shows the cell growth rate, which was measured by counting the cells every 4 days. The lower panel displays the expression levels of inflammatory genes, which were measured using real-time PCR. j Mid-old cells were infected with lentiviruses carrying sh-p21Waf1 for 4 days. Cell morphology was examined and depicted in the left panel, while the cell growth rate was monitored by counting the cells every 4 days (right upper panel). The expression of various inflammatory genes was assessed using real-time PCR (right lower panel). The p values of (b) (right upper and lower), (c), and (f), (j) are obtained from the one-tailed Mann–Whitney U test. The p value of (b) (left lower) is obtained from two-tailed Student’s t test. The p values of (e) (left lower) are obtained using GSEA statistics in ‘fgsea’ package in R. The graphs in (b), (c), and (fj) were represented as mean ± SD. A thousand times of permutations were performed for GSEA adjustment.
Fig. 6
Fig. 6. SLIT2 has an impact on mid-old cells.
a Mid-old cells were treated for 24 h with rhSLIT2, and inflammatory gene expression was analyzed using real-time PCR (upper panel). IL1β and SAA1 protein level was analyzed by ELISA in rhSLIT2-treated mid-old cells (lower panel). b Mid-old cells were treated with rhSLIT2 for the indicated times and analyzed for Pyk2-NFκB signaling by western blot analysis (left panel). The number of nuclear p-NFκB-positive cells was quantified in mid-old cells using IF staining (right panel). c SLIT2-expressing lentivirus infected into mid-old fibroblasts, and inflammation related genes expression including SAA1 and IL1β were analyzed using real-time PCR (right lower panel). IL1β and SAA1 protein level was analyzed by ELISA in SLIT2-overexpressing mid-old cells (left lower panel). d The morphology and cell size of mid-old cells were analyzed after treating rhSLIT2 for 20 days. Cell growth rate was analyzed every 4 days for 20 days by counting the number of cells. e The expression of p53 and p21Waf1 were measured in mid-old cells after administration of rhSLIT2 at the indicated concentration for 2 days using real-time PCR (upper panel) and western blot analysis (lower panel). f The changes in gene expression of p53 and p21Waf1-regulating genes were evaluated after treating cells with rhSLIT2 using RNA-seq FPKM count (left panel). The mRNA expression of SOX2 and OCT4 were analyzed using real-time PCR (right upper panel) and western blot analysis (right lower panel) in rhSLIT2-treated mid-old cells. g Young cells were infected with shSLIT2 lentivirus and stabilized for 2 days, and subsequently cultured for 8 days. The mRNA expression level of SAA1 and IL1β was analyzed using real-time PCR (upper right panel), while the protein expression level was assessed using ELISA (lower right panel). h The cell growth rate was evaluated by counting the number of cells every 2 days over a period of 8 days (right upper panel). EdU incorporation assay. Same experiment scheme as (g) was applied for EdU incorporation study (left panel). i SLIT2 was knocked down in young cells infecting shSLIT2 lentivirus. The knockdown was then rescued by treating the cells with rhSLIT2 protein at a concentration of 100 ng/ml for 2 days. SAA1 and IL1β mRNA expression levels were analyzed with real-time PCR. j Mid-old cells were co-cultured with sh-control or sh-SLIT2 lentivirus infected young cells for 30 days. At the experimental endpoint, the morphology of mid-old fibroblasts was observed (left panel), and EdU incorporation assay (middle panel) and cell proliferation (right upper panel) was measured. The p values of (a–c), (d) (lower panel), and (ej) are obtained from one-tailed Mann–Whitney U test. The p value of (d) (right upper panel) is obtained from two-tailed Student’s t test. The graphs in (aj) were represented as mean ± SD.
Fig. 7
Fig. 7. Administration of rmSLIT2 increased activity in aged mice.
a PBS (control) or rmSLIT2 (2 μg/injection) was intraperitoneally injected twice weekly for 5 weeks in 23-month-old male mice (n = 5; PBS, n = 5; rmSLIT2, respectively) (upper panel). The body weight (middle panel) and activity in the cage (lower panel) were evaluated at the experimental beginning and endpoint. b The hanging ability of the rmSLIT2 or PBS-treated mouse was compared (left panel). The quantification data is shown in the right panel. c The muscle weight of the rmSLIT2 or PBS-treated mouse was compared (left panel). Laminin IF staining (middle panel). The tibialis anterior and gastrocnemius muscle were transversely sectioned to measure the area of muscle fibers (right panel). Representative images of laminin (green) and DAPI (blue) staining (middle panel). p21Waf1 (d) and SOX2 (e) expression were analyzed by IHC in stromal region of esophagus, stomach, small intestine, colon, lung, and skin, respectively (n = 5; PBS, n = 5; rmSLIT2). Each protein expression status was indicated positive cells number/100 stromal cells. The p values of (ae) are obtained from the one-tailed Mann–Whitney U test. The graphs in (ae) were represented as mean ± SD.

References

    1. Omori S, et al. Generation of a p16 reporter mouse and its use to characterize and target p16(high) cells in vivo. Cell Metab. 2020;32:814–828.e816. doi: 10.1016/j.cmet.2020.09.006. - DOI - PubMed
    1. Liu JY, et al. Cells exhibiting strong p16(INK4a) promoter activation in vivo display features of senescence. Proc. Natl Acad. Sci. USA. 2019;116:2603–2611. doi: 10.1073/pnas.1818313116. - DOI - PMC - PubMed
    1. Patil P, et al. Systemic clearance of p16(INK4a) -positive senescent cells mitigates age-associated intervertebral disc degeneration. Aging Cell. 2019;18:e12927. doi: 10.1111/acel.12927. - DOI - PMC - PubMed
    1. Martinez-Zamudio RI, et al. Senescence-associated beta-galactosidase reveals the abundance of senescent CD8+ T cells in aging humans. Aging Cell. 2021;20:e13344. doi: 10.1111/acel.13344. - DOI - PMC - PubMed
    1. Grosse L, et al. Defined p16(high) senescent cell types are indispensable for mouse healthspan. Cell Metab. 2020;32:87–99. doi: 10.1016/j.cmet.2020.05.002. - DOI - PubMed

Publication types

Associated data