. 2023 Nov 22;14(1):7610.
doi: 10.1038/s41467-023-43350-8.

Mirabegron displays anticancer effects by globally browning adipose tissues

Affiliations

Mirabegron displays anticancer effects by globally browning adipose tissues

Xiaoting Sun et al. Nat Commun. .

Abstract

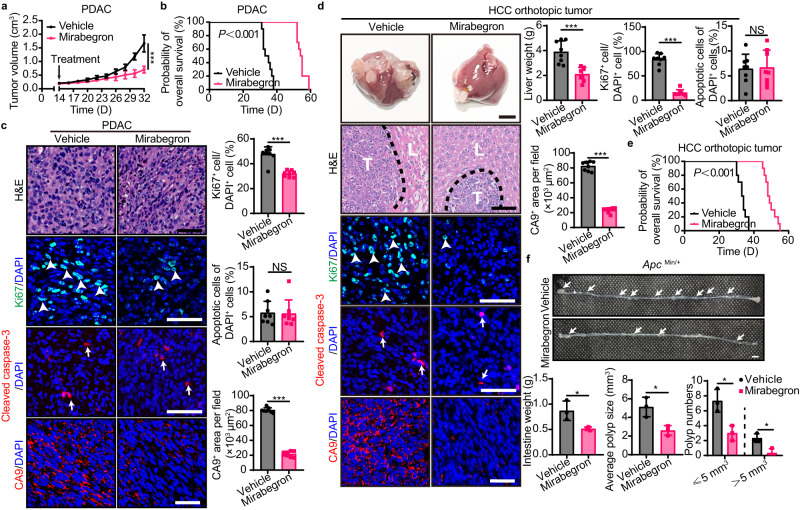
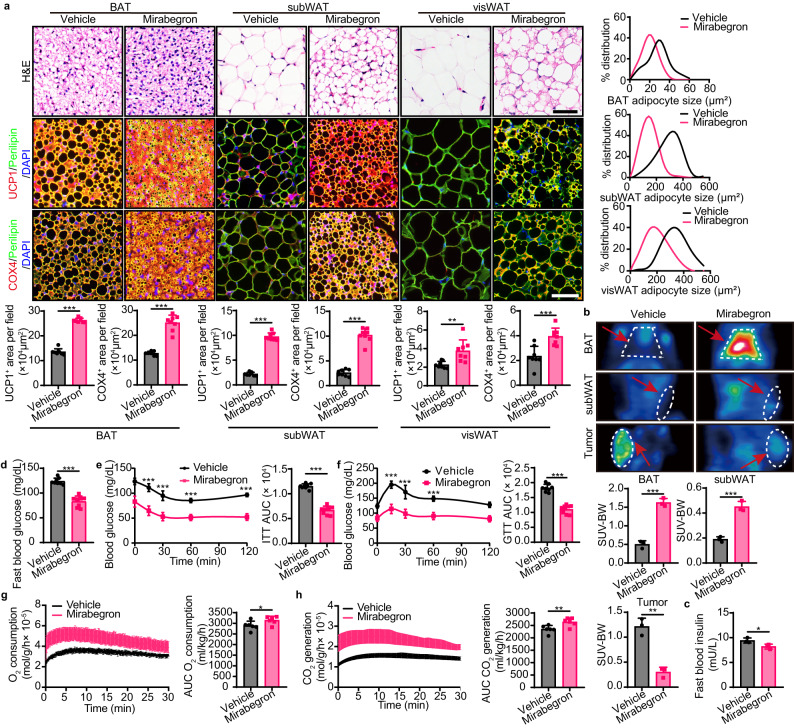
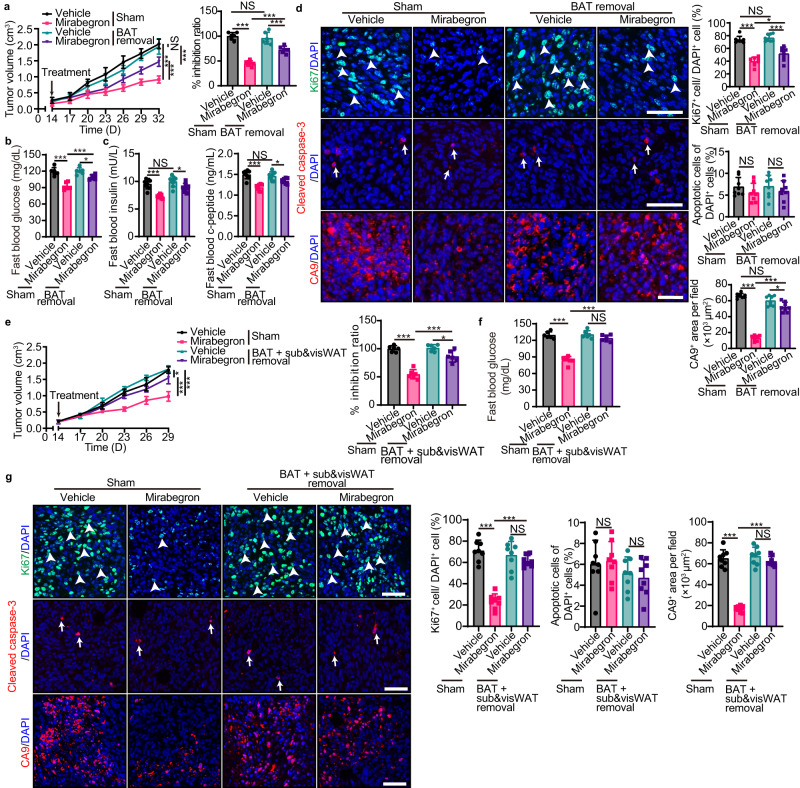
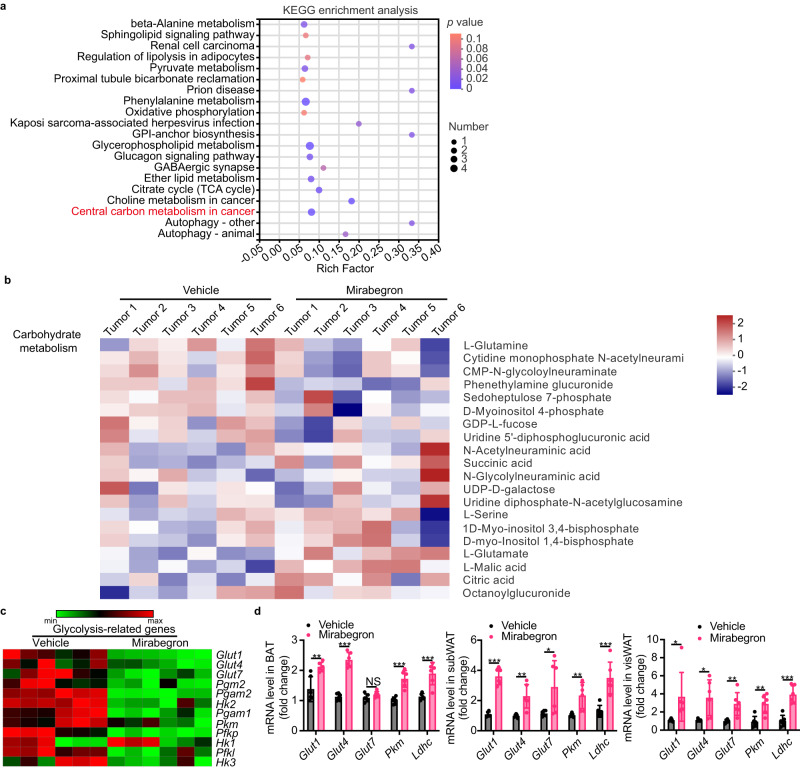
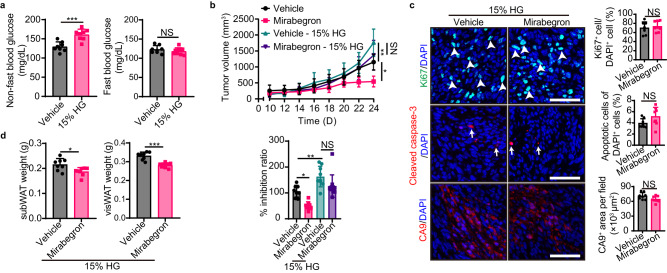
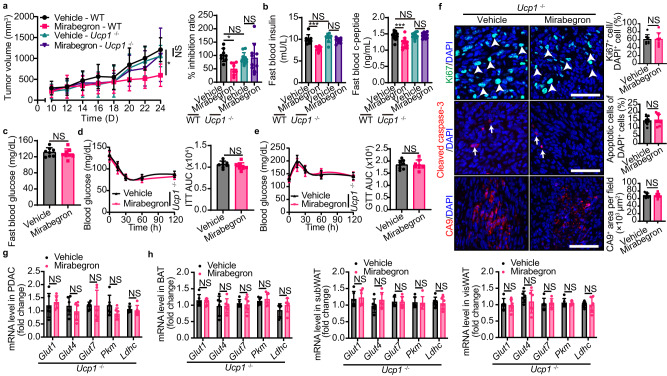
Metabolic reprogramming in malignant cells is a hallmark of cancer that relies on augmented glycolytic metabolism to support their growth, invasion, and metastasis. However, the impact of global adipose metabolism on tumor growth and the drug development by targeting adipose metabolism remain largely unexplored. Here we show that a therapeutic paradigm of drugs is effective for treating various cancer types by browning adipose tissues. Mirabegron, a clinically available drug for overactive bladders, displays potent anticancer effects in various animal cancer models, including untreatable cancers such as pancreatic ductal adenocarcinoma and hepatocellular carcinoma, via the browning of adipose tissues. Genetic deletion of the uncoupling protein 1, a key thermogenic protein in adipose tissues, ablates the anticancer effect. Similarly, the removal of brown adipose tissue, which is responsible for non-shivering thermogenesis, attenuates the anticancer activity of mirabegron. These findings demonstrate that mirabegron represents a paradigm of anticancer drugs with a distinct mechanism for the effective treatment of multiple cancers.


Conflict of interest statement

All authors claim no conflict of interest related to this work.

Figures

Fig. 1
Fig. 1. Mirabegron inhibits tumor growth and prolongs survival in tumor-bearing mice.
a Tumor growth of vehicle- and mirabegron-treated PDAC tumor-bearing mice (n = 8 mice per group). b Overall survival of vehicle- and mirabegron-treated PDAC tumor-bearing mice (n = 10 mice per group). c H&E histological staining and immunofluorescence staining of Ki67+ proliferating cells (green), cleaved-caspase 3+ apoptotic cells (red), and CA9+ hypoxic area (red) of PDAC tumors. Tissues were counterstained with 4′,6-diamidino-2-phenylindole (DAPI, blue). Arrows and arrowheads point to their respective positive signals. Scale bar, 50 μm. Quantifications of Ki67+ signal, cleaved-caspase 3+ signal, and CA9+ signal (n = 8 random fields per group). d Liver photographs and liver weights of vehicle- and mirabegron-treated orthotopic HCC tumor-bearing mice (n = 8 mice per group). H&E histological staining and immunofluorescence staining of Ki67+ proliferating cells (green), cleaved-caspase 3+ apoptotic cells (red), and CA9+ hypoxic area (red) of HCC tumors. Tissues were counterstained with DAPI (blue). Arrows and arrowheads point to their respective positive signals. T, tumor. L, liver. Scale bar in upper panel, 5 mm. Scale bar in lower four panels, 50 μm. Quantifications of Ki67+ signal, cleaved-caspase 3+ signal, and CA9+ signal (n = 8 random fields per group). e Overall survival of vehicle- and mirabegron-treated orthotopic HCC tumor-bearing mice (n = 10 mice per group). f Photographs and weights of intestine in vehicle- and mirabegron-treated ApcMin/+ mice (n = 3 mice per group). Quantifications of polyp distribution and average sizes in vehicle- and mirabegron-treated ApcMin/+ mice (n = 3 mice per group). Scale bar, 5 mm. Statistical analysis was performed using two-sided unpaired t-test (a, c, d, f) and log-rank test (b, e). NS, not significant; *P < 0.05; **P < 0.01; ***P < 0.001. Data presented as mean ± SD. Each experiment was repeated at least three times and the representative experiment was shown (ae). ApcMin/+ mice experiment was performed once. Source data are provided as a Source Data file.
Fig. 2
Fig. 2. Adipose activation and glucose uptake in adipose tissues and tumors.
a H&E histological staining and immunofluorescence staining of UCP1 (red), COX4 (red), and Perilipin (green) of adipose depots in vehicle- and mirabegron-treated PDAC tumor-bearing mice. Tissues were counterstained with DAPI (blue). Scale bar, 50 μm. Quantifications of adipocyte size distribution, UCP1+ signal, and COX4+ signal (n = 8 random fields per group). b Representative PET-CT images of BAT, subWAT, and tumors in vehicle- and mirabegron-treated PDAC tumor-bearing mice. Quantification of standardized uptake values (SUV) justified by body weight (SUV-BW) of BAT, subWAT, and tumors (n = 3 mice per group). c, d Fast blood insulin levels and glucose levels of vehicle- and mirabegron-treated PDAC tumor-bearing mice (n = 3 mice per group/ 8 mice per group). e, f Insulin tolerance test (ITT) and glucose tolerance test (GTT) of vehicle- and mirabegron-treated PDAC tumor-bearing mice (n = 8 mice per group). g, h Whole-body metabolism measured by O2 consumption and CO2 generation in vehicle- and mirabegron-treated PDAC tumor-bearing mice (n = 6 mice per group). Statistical analysis was performed using two-sided unpaired t-test (a-h). NS, not significant; *P < 0.05; **P < 0.01; ***P < 0.001. Data presented as mean ± SD. Each experiment was repeated at least three times and the representative experiment was shown (a, cf). PET-CT test (b) and whole-body metabolism (g, h) were performed once. Source data are provided as a Source Data file.
Fig. 3
Fig. 3. Removal of adipose tissues ablates mirabegron-triggered tumor suppression.
a PDAC tumor growth and inhibition ratios of sham and BAT removal tumor-bearing mice with or without mirabegron treatment (n = 6 mice per group). b Fast blood glucose levels of sham and BAT removal tumor-bearing mice with or without mirabegron treatment (n = 6 mice per group). c Fast blood insulin and c-peptide levels of sham and BAT removal tumor-bearing mice with or without mirabegron treatment (n = 8 mice per group). d Immunofluorescence staining of Ki67+ proliferating cells (green), cleaved-caspase 3+ apoptotic cells (red), and CA9+ hypoxic area (red) of PDAC tumors. Tissues were counterstained with DAPI (blue). Arrows and arrowheads point to their respective positive signals. Scale bar, 50 μm. Quantifications of Ki67+ signal, cleaved-caspase 3+ signal, and CA9+ signal (n = 8 random fields per group). e PDAC tumor growth and inhibition ratios of sham and fat depots (BAT, subWAT, and visWAT) removal tumor-bearing mice with or without mirabegron treatment (n = 6 mice per group). f Fast blood glucose levels of sham and fat depots removal tumor-bearing mice with or without mirabegron treatment (n = 6 mice per group). g Immunofluorescence staining of Ki67+ proliferating cells (green), cleaved-caspase 3+ apoptotic cells (red), and CA9+ hypoxic area (red) of PDAC tumors. Tissues were counterstained with DAPI (blue). Arrows and arrowheads point to their respective positive signals. Scale bar, 50 μm. Quantifications of Ki67+ signal, cleaved-caspase 3+ signal, and CA9+ signal (n = 8 random fields per group). Statistical analysis was performed using one-way ANOVA test (ag). NS, not significant; *P < 0.05; **P < 0.01; ***P < 0.001. Data presented as mean ± SD. Each experiment was repeated at least three times and the representative experiment was shown (ag). Source data are provided as a Source Data file.
Fig. 4
Fig. 4. Mirabegron inhibits glucose metabolism in tumor tissues.
a Metabolic pathway enrichment analysis of differentially expressed metabolites between vehicle- and mirabegron-treated PDAC tumors (n = 6 samples per group). Overview of enriched metabolic pathways in the mirabegron-treated tumors compared to the vehicle-treated tumors. Pathway impact was analyzed using MetaboAnalyst 3.0. b Heatmaps of the differential carbohydrate metabolism-related metabolites (n = 6 samples per group). c. Heatmaps of GLUTs and glycolysis-related genes in vehicle- and mirabegron-treated PDAC tumors (n = 6 samples per group). d qPCR analysis of GLUTs and glycolysis-related genes in BAT, subWAT, and visWAT in vehicle- and mirabegron-treated PDAC tumor-bearing mice (n = 6 samples per group). Statistical analysis was performed using two-sided unpaired t-test (d). P value < 0.05 was considered significant enrichment (a). NS, not significant; *P < 0.05; **P < 0.01; ***P < 0.001. Data presented as mean ± SD. Each experiment was repeated at least three times and the representative experiment was shown (d). Metabolomic-related analysis (ac) were performed once. Source data are provided as a Source Data file.
Fig. 5
Fig. 5. High glucose feeding abrogates mirabegron-induced tumor suppression.
a Fast blood insulin and non-fast blood insulin levels of vehicle- and 15% glucose-treated PDAC tumor-bearing mice (n = 8 mice per group). b PDAC tumor growth and inhibition ratios of vehicle and mirabegron-treated tumor-bearing mice receiving vehicle or 15% glucose feeding (n = 8-11 mice per group). c Immunofluorescence staining of Ki67+ proliferating cells (green), cleaved-caspase 3+ apoptotic cells (red), and CA9+ hypoxic area (red) of PDAC tumors. Tissues were counterstained with DAPI (blue). Arrows and arrowheads point to their respective positive signals. Scale bar, 50 μm. Quantifications of Ki67+ signal, cleaved-caspase 3+ signal, and CA9+ signal (n = 8 random fields per group). d White adipose tissue weight of vehicle- and mirabegron-treated tumor-bearing mice receiving 15% glucose feeding (n = 8 mice per group). Statistical analysis was performed using two-sided unpaired t-test (a, c, d), one-way ANOVA test (b). NS, not significant; *P < 0.05; **P < 0.01; ***P < 0.001. Data presented as mean ± SD. Each experiment was repeated at least three times and the representative experiment was shown (ad). Source data are provided as a Source Data file.
Fig. 6
Fig. 6. Mirabegron-instigated tumor suppression is UCP1-dependent.
a Tumor growth, tumor inhibition ratio, and tumor weight of vehicle- and mirabegron-treated PDAC tumor-bearing WT and Ucp1-/- mice (n = 8 mice per group). b Fast blood insulin and c-peptide levels of vehicle- and mirabegron-treated PDAC tumor-bearing WT and Ucp1-/- mice (n = 8-11 mice per group). c Fast blood glucose levels of vehicle- and mirabegron-treated PDAC tumor-bearing Ucp1-/- mice (n = 8 mice per group). d, e Insulin tolerance test (ITT) and glucose tolerance test (GTT) of vehicle- and mirabegron-treated PDAC tumor-bearing Ucp1-/- mice (n = 8 mice per group). f Immunofluorescence staining of Ki67+ proliferating cells (green), cleaved-caspase 3+ apoptotic cells (red), and CA9+ hypoxic area (red) of PDAC tumors. Tissues were counterstained with 4′,6-diamidino-2-phenylindole (DAPI, blue). Arrows and arrowheads point to their respective positive signals. Scale bar, 50 μm. Quantifications of Ki67+ signal, cleaved-caspase 3+ signal, and CA9+ signal (n = 8 random fields per group). g qPCR analysis of GLUTs and glycolysis-related genes in vehicle- and mirabegron-treated PDAC tumors in Ucp1-/- mice (n = 6 samples per group). h qPCR analysis of GLUTs and glycolysis-related genes in BAT, subWAT, and visWAT in vehicle- and mirabegron-treated PDAC tumor-bearing Ucp1-/- mice (n = 6 samples per group). Statistical analysis was performed using one-way ANOVA test (a, b) and two-sided unpaired t-test (c, h). NS, not significant; *P < 0.05; **P < 0.01; ***P < 0.001. Data presented as mean ± SD. Each experiment was repeated at least three times and the representative experiment was shown (ah). Source data are provided as a Source Data file.

References

    1. Hanahan D, Weinberg RA. Hallmarks of cancer: the next generation. Cell. 2011;144:646–674. doi: 10.1016/j.cell.2011.02.013. - DOI - PubMed
    1. Bergers G, Fendt SM. The metabolism of cancer cells during metastasis. Nat Rev Cancer. 2021;21:162–180. doi: 10.1038/s41568-020-00320-2. - DOI - PMC - PubMed
    1. Gatenby RA, Gillies RJ. Why do cancers have high aerobic glycolysis? Nat Rev Cancer. 2004;4:891–899. doi: 10.1038/nrc1478. - DOI - PubMed
    1. Ganapathy-Kanniappan S, Geschwind JF. Tumor glycolysis as a target for cancer therapy: progress and prospects. Mol Cancer. 2013;12:152. doi: 10.1186/1476-4598-12-152. - DOI - PMC - PubMed
    1. Rosen ED, Spiegelman BM. What we talk about when we talk about fat. Cell. 2014;156:20–44. doi: 10.1016/j.cell.2013.12.012. - DOI - PMC - PubMed

Publication types