. 2023 Nov 22;14(1):7629.
doi: 10.1038/s41467-023-43295-y.

Loss-of-function of an α-SNAP gene confers resistance to soybean cyst nematode

Affiliations

Loss-of-function of an α-SNAP gene confers resistance to soybean cyst nematode

Mariola Usovsky et al. Nat Commun. .

Abstract

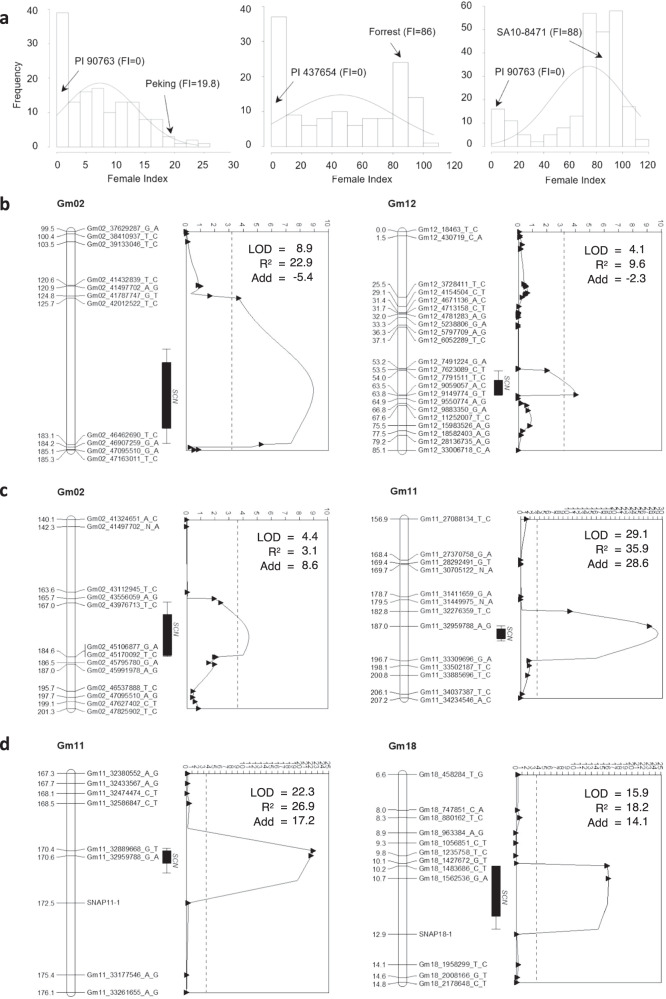
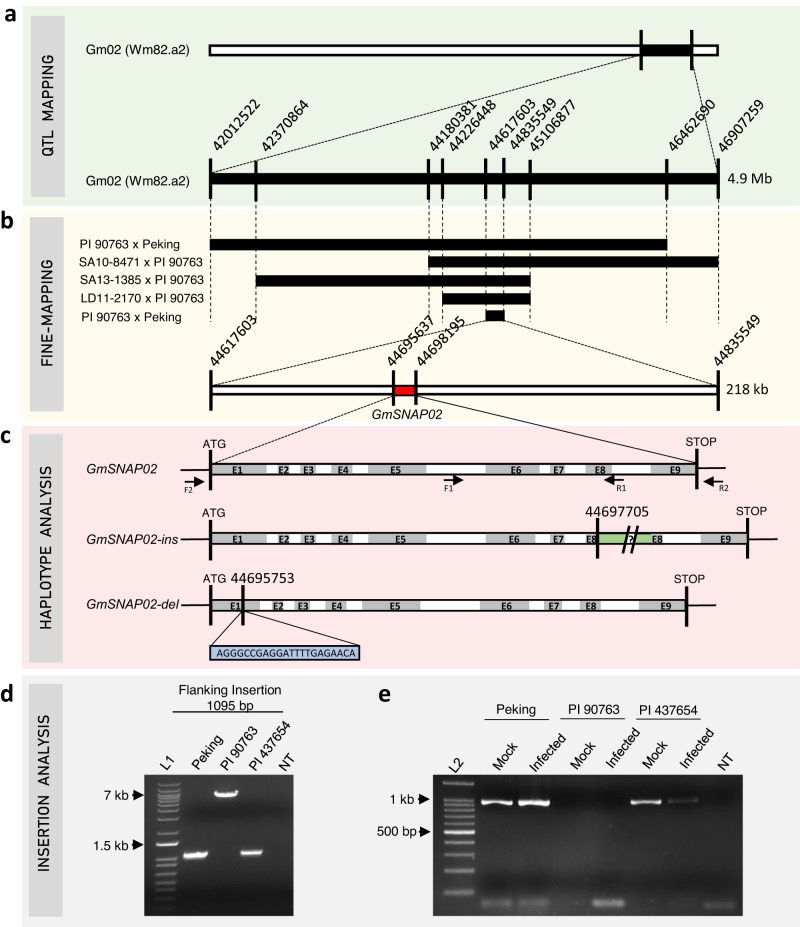
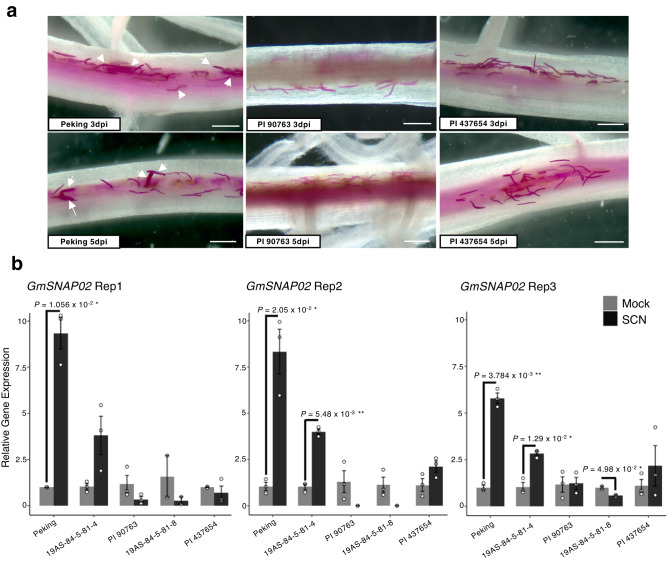
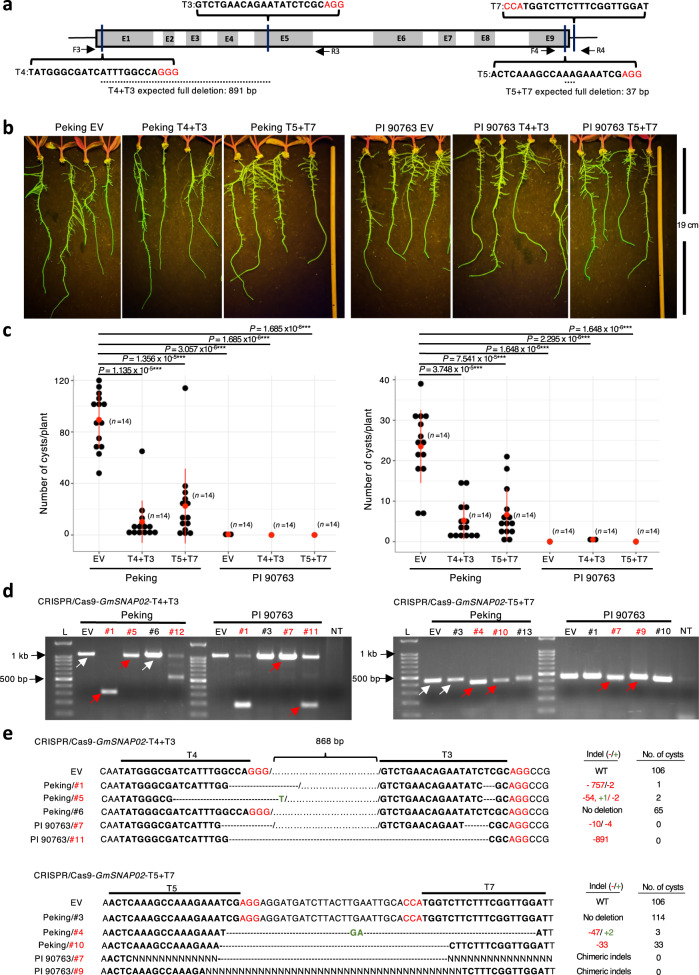
Plant-parasitic nematodes are one of the most economically impactful pests in agriculture resulting in billions of dollars in realized annual losses worldwide. Soybean cyst nematode (SCN) is the number one biotic constraint on soybean production making it a priority for the discovery, validation and functional characterization of native plant resistance genes and genetic modes of action that can be deployed to improve soybean yield across the globe. Here, we present the discovery and functional characterization of a soybean resistance gene, GmSNAP02. We use unique bi-parental populations to fine-map the precise genomic location, and a combination of whole genome resequencing and gene fragment PCR amplifications to identify and confirm causal haplotypes. Lastly, we validate our candidate gene using CRISPR-Cas9 genome editing and observe a gain of resistance in edited plants. This demonstrates that the GmSNAP02 gene confers a unique mode of resistance to SCN through loss-of-function mutations that implicate GmSNAP02 as a nematode virulence target. We highlight the immediate impact of utilizing GmSNAP02 as a genome-editing-amenable target to diversify nematode resistance in commercially available cultivars.


Conflict of interest statement

The authors have filed the following US provisional patent applications—No. 63/387,635 filed on 12/15/2022 and No. 63/503,811 filed on 05/23/2023.

Figures

Fig. 1
Fig. 1. Mapping of quantitative trait loci (QTL) controlling soybean cyst nematode (SCN) HG type 1.2.5.7 resistance.
a Frequency distribution of female indices (FI) in 144 F3:4 lines from PI 90763 × Peking, 131 F3:4 lines from Forrest × PI 437654, and 244 F3:4 lines of SA10-8471 × PI 90763. b QTL02 and QTL12 detected in PI 90763 × Peking population. c QTL02 and QTL11 detected in Forrest × PI 437654 population. d QTL11 and QTL18 detected in SA10-8471 × PI 90763 population. Scales on the top of the graph represent the value of the logarithm of the odds (LOD). The black dotted line indicates the threshold of significance (LOD = 3.2, 3.6, and 3.5) for each population, respectively. Add = additive effect.
Fig. 2
Fig. 2. GmSNAP02 positional cloning.
a The QTL02 confidence interval Gm02: 42,012,522–46,907,259 (Wm82.a2) was identified from a cross between PI 90763 × Peking. b An initial fine-mapped region of ~880 kb containing 112 genes was determined using recombinant inbred F3:4 lines derived from four populations. F4:5 lines derived from the cross between PI 90763 x Peking were used to further narrow the region to ~218 kb containing 34 genes. Within this region GmSNAP02 (Glyma.02G260400) became a candidate gene (red). c Haplotypes identified at GmSNAP02 included the susceptible GmSNAP02 haplotype of the Williams 82 reference genome, GmSNAP02-ins, a resistant haplotype caused by an ~6 kb insertion (green) in exon 8 in PI 90763, and GmSNAP02-del haplotype caused by a 22 nt deletion (blue) in exon 1 resulting in a frameshift mutation leading to a premature stop. GmSNAP02 gene-specific primers designed to flank the insertion in exon 8 (d, F1/R2) amplified products of the predicted size in Peking and PI 437654, but a larger product in PI 90763, confirming the presence of an insertion. This experiment was repeated four times with similar results. e GmSNAP02 gene-specific primers designed immediately upstream of the start and downstream of the stop codons (c, F2/R2) amplified a full-length GmSNAP02 cDNA sequence from mock-inoculated and SCN-infected (3 days post inoculation) roots of Peking and PI 437654, but not from PI 90763. Sequencing of the product amplified from PI 437654 confirmed the presence of a 22 nt deletion in exon 1 of GmSNAP02. This experiment was repeated twice with similar results. L1 = 1 kb Plus ladder (Invitrogen), L2 = 100 bp ladder (NEB), NT = no template control.
Fig. 3
Fig. 3. GmSNAP02 gene expression in response to SCN infection.
a Nematode development on Peking, PI 90763, and PI 437654 soybean lines. Roots of 3-day-old seedlings were inoculated with infective second-stage juveniles (J2) and stained with acid fuchsin at 3 and 5 days post inoculation (dpi). Representative images of 3–5 independent roots/genotype are shown. White arrowheads denote swollen parasitic juvenile nematodes in Peking indicative of successful feeding site establishment and development. Scale bar = 500 μm. b Relative gene expression analysis of GmSNAP02 in mock-inoculated and SCN-infected roots using qRT-PCR. Two residual heterozygote-derived lines near-isogenic for GmSNAP02, 19AS-84-5-81-4 and 19AS-84-5-81-8, were also included. Statistical analysis was performed by a two-tailed Student’s t test. Data are means ± s.e.m. of three technical replicates for each biological replicate. Data from three independent biological replicates showed a significant (*P < 0.05, **P < 0.01) increase in GmSNAP02 gene in expression in susceptible Peking and 81-4, but not PI 90763, 81-8, and PI 437654 upon SCN HG type 1.2.5.7 (Race 2) infection.
Fig. 4
Fig. 4. Functional validation of GmSNAP02 in resistance to SCN using CRISPR/Cas9.
a Diagram showing the positions of the guide RNA (gRNA) sequences designed to edit the GmSNAP02 gene. PAM sequences are in red. gRNA sequences are bolded. b Composite soybean plants with transgenic GFP-positive hairy roots were selected under fluorescent light. Representative images are shown. No gross phenotypic differences were observed in GmSNAP02-edited roots of either Peking or PI 90763 (n = 14 plants/construct examined in two independent experiments). Pictures taken just before transplanting and nematode inoculation. c Cyst counts on transgenic roots of Peking and PI 90763 composite plants transformed with K599 carrying empty vector (EV; control), CRISPR/Cas9-GmSNAP02-T4 + T3, and CRISPR/Cas9-GmSNAP02-T5 + T7 constructs, respectively. Data are shown for two biological replicates for each construct and genotype. Means ± s.d. are denoted with a red dot and line (n = 14). ***P < 0.001 and **P < 0.01, Wilcoxon rank-sum statistical test. d Amplified fragments from genomic DNA extracted from roots transformed with CRISPR/Cas9-GmSNAP02-T4 + T3, and CRISPR/Cas9-GmSNAP02-T5 + T7, respectively. Fragments flanking T4 and T3 gRNA cleavage sites were amplified using F5 and R5 primers (shown in (a)). Fragments flanking T5 and T7 gRNA cleavage sites were amplified using F6 and R6 primers (shown in (a)). A subset of roots from both genotypes for each construct was selected for genotyping. Fragments indicated by the arrows were gel extracted, subcloned, and sequenced to confirm deletions. White arrows no deletion, Red arrows/#’s deletion confirmed, L   100 bp ladder (NEB), NT no template control. e Sequences of selected fragments from d. The number of nucleotides deleted (red font) and/or inserted (green font) and the corresponding cyst counts for each plant are indicated in the columns on the right.
Fig. 5
Fig. 5. Female index values of pooled F3:5 lines with different allelic combinations for four SCN populations.
Lines were pooled from four populations: PI 90763 × Peking, SA10-8471 × PI 90763, SA13-1385 × PI 90763, and LD11-2170 × PI 90763. The numbers in parenthesis above each violin plot correspond to the number of independent lines phenotyped in the pooled genotypic class (n). Female indices derived from lines infected from each SCN population were analyzed by one-way analysis of variance (ANOVA), and Tukey’s HSD test was used for multiple comparisons. The ANOVA P values were significant for all four individual SCN population tests (P ≤ 0.05). The letters above each violin plot correspond to significance/non significance between allelic combination groups based on the Tukey’s HSD test (P ≤ 0.05). Exact P values are provided in the source data file for both ANOVA and Tukey’s HSD tests.

References

    1. Rincker K, Cary T, Diers BW. Impact of soybean cyst nematode resistance on soybean yield. Crop Sci. 2017;57:1373–1382. doi: 10.2135/cropsci2016.07.0628. - DOI
    1. Allen TW, et al. Soybean yield loss estimates due to diseases in the United States and Ontario, Canada, from 2010 to 2014. Plant Health Prog. 2017;18:19–27. doi: 10.1094/PHP-RS-16-0066. - DOI
    1. Tylka GL, Marett CC. Known distribution of the soybean cyst nematode, Heterodera glycines, in the United States and Canada, 1954 to 2017. Plant Health Prog. 2017;18:167–168. doi: 10.1094/PHP-05-17-0031-BR. - DOI
    1. Bandara AY, Weerasooriya DK, Bradley CA, Allen TW, Esker PD. Dissecting the economic impact of soybean diseases in the United States over two decades. PLoS ONE. 2020;15:e0231141. doi: 10.1371/journal.pone.0231141. - DOI - PMC - PubMed
    1. Medina R, Taylor CG. Improving crop rotation efficiency for soybean cyst nematode management. Phytopathology. 2015;105:94–94.

Publication types

MeSH terms

Substances