. 2023 Nov 22;14(1):7616.
doi: 10.1038/s41467-023-43535-1.

Fear extinction is regulated by the activity of long noncoding RNAs at the synapse

Affiliations

Fear extinction is regulated by the activity of long noncoding RNAs at the synapse

Wei-Siang Liau et al. Nat Commun. .

Abstract

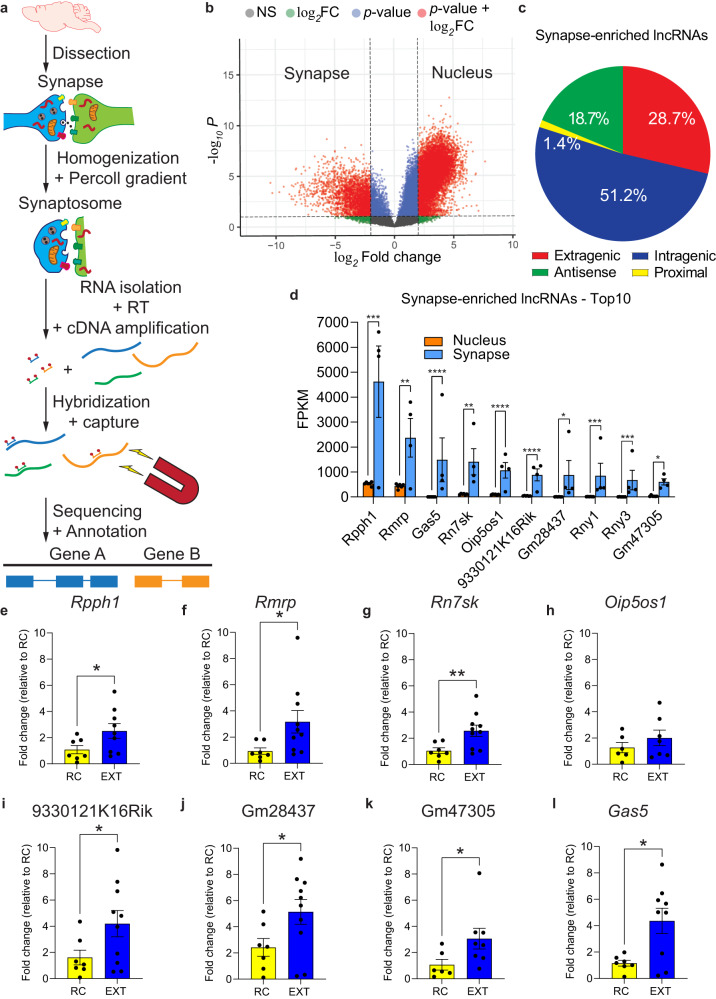
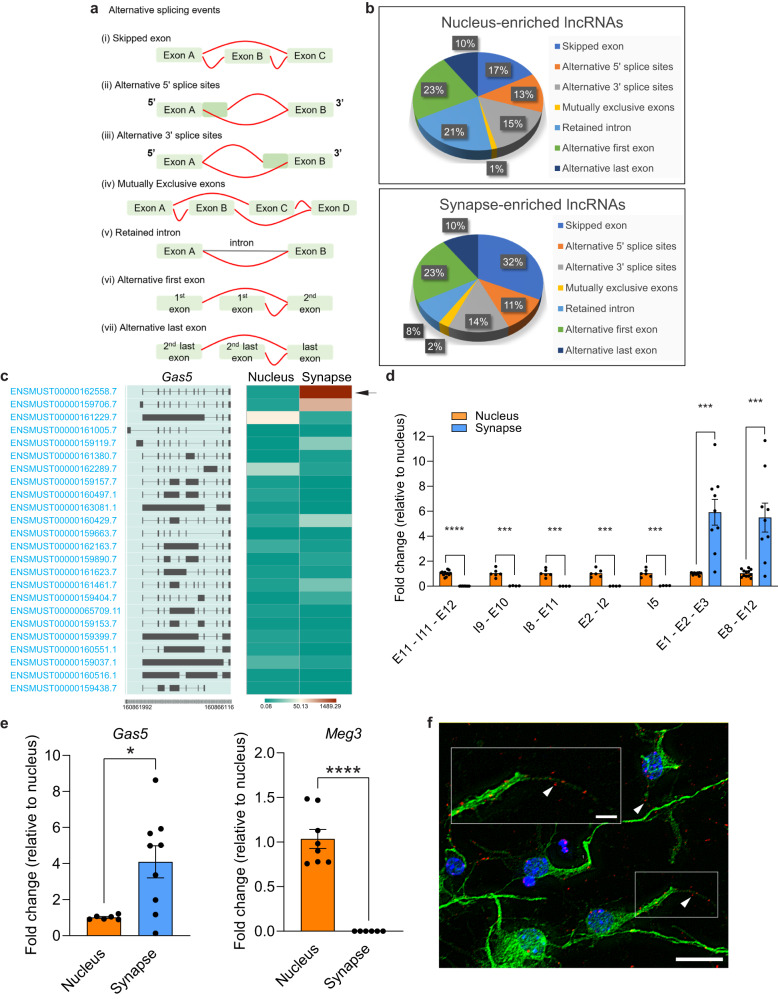
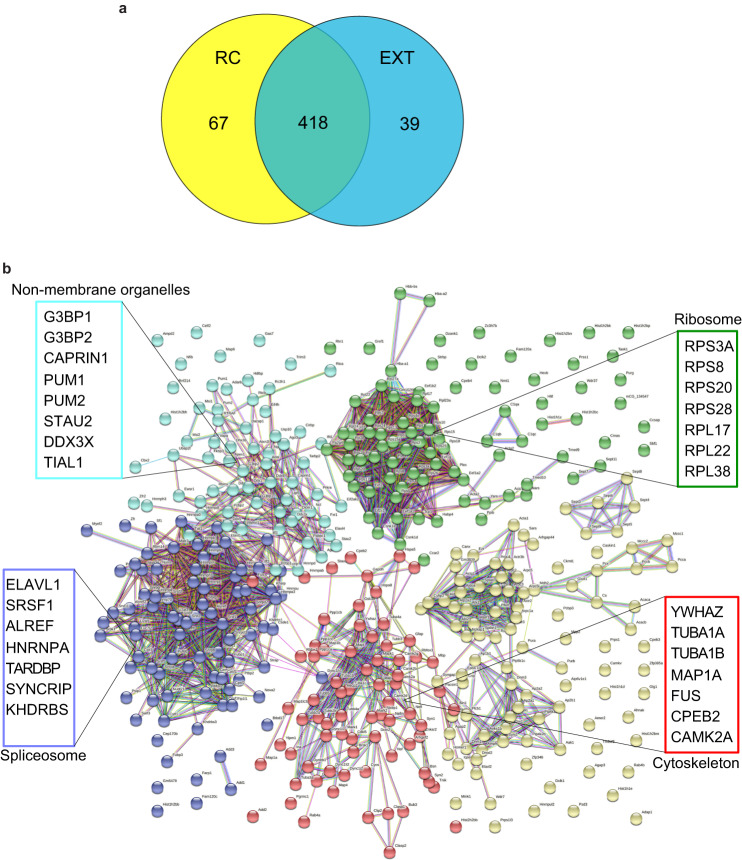
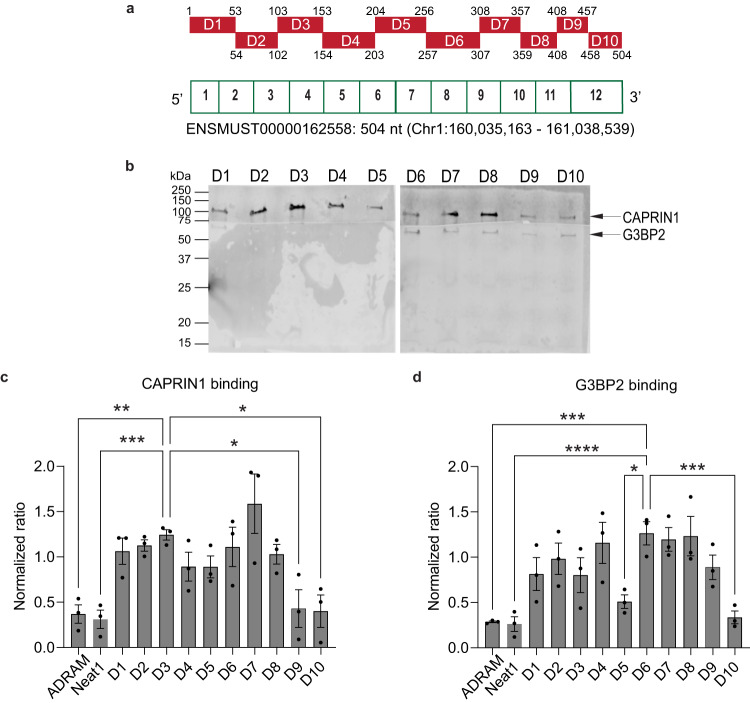
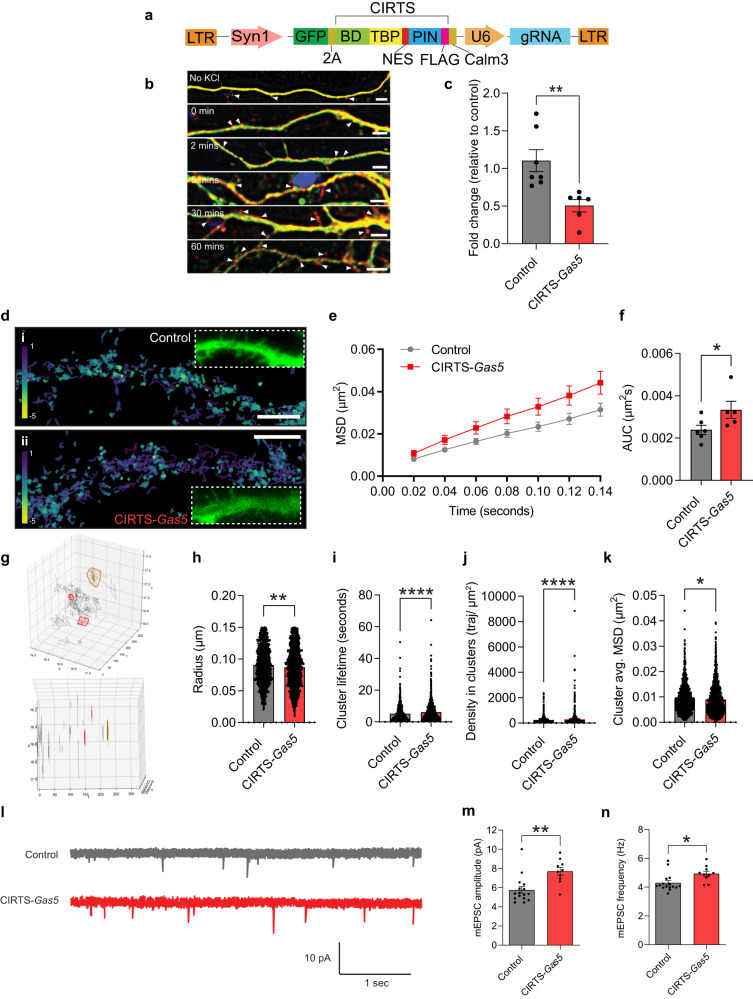
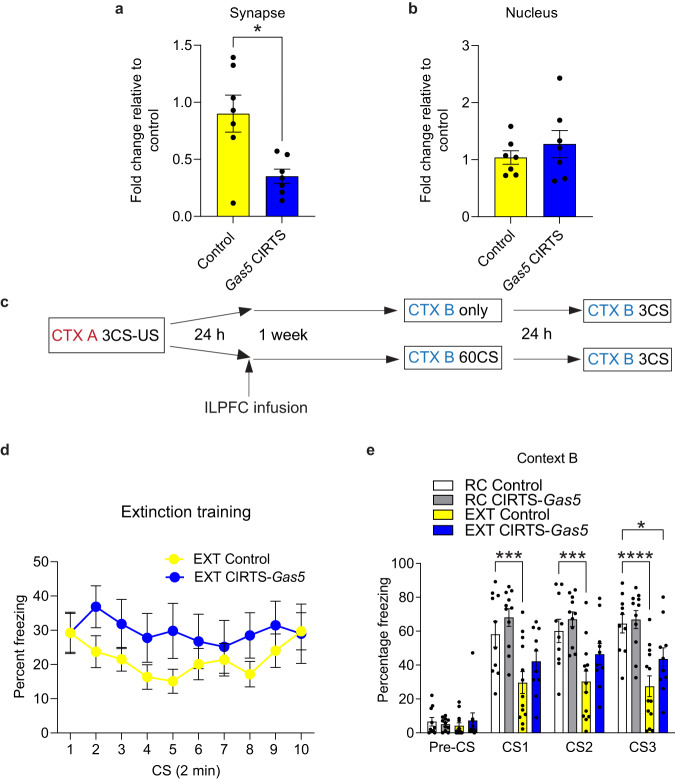
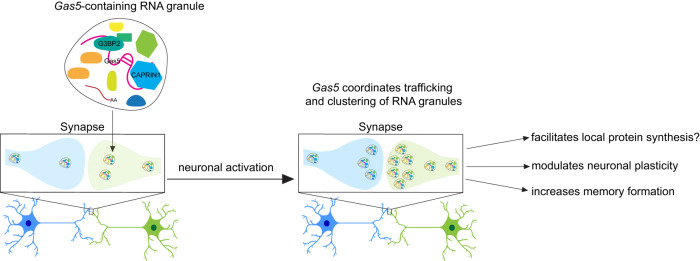
Long noncoding RNAs (lncRNAs) represent a multidimensional class of regulatory molecules that are involved in many aspects of brain function. Emerging evidence indicates that lncRNAs are localized to the synapse; however, a direct role for their activity in this subcellular compartment in memory formation has yet to be demonstrated. Using lncRNA capture-seq, we identified a specific set of lncRNAs that accumulate in the synaptic compartment within the infralimbic prefrontal cortex of adult male C57/Bl6 mice. Among these was a splice variant related to the stress-associated lncRNA, Gas5. RNA immunoprecipitation followed by mass spectrometry and single-molecule imaging revealed that this Gas5 isoform, in association with the RNA binding proteins G3BP2 and CAPRIN1, regulates the activity-dependent trafficking and clustering of RNA granules. In addition, we found that cell-type-specific, activity-dependent, and synapse-specific knockdown of the Gas5 variant led to impaired fear extinction memory. These findings identify a new mechanism of fear extinction that involves the dynamic interaction between local lncRNA activity and RNA condensates in the synaptic compartment.


Conflict of interest statement

C.H. is a scientific founder and a member of the scientific advisory board of Accent Therapeutics Inc. and Inferna Green Inc. BCD is a founder and holds equity in Tornado Bio, Inc. The remaining authors declare no competing interests.

Figures

Fig. 1
Fig. 1. Targeted RNA capture-seq reveals a myriad of synapse-enriched lncRNAs.
a Schematic overview of the lncRNA capture-seq. b Volcano plot showing all nuclear and synaptic lncRNAs expressed (FPKM > 0.5) in the ILPFC (Ballgown parametric F-test). Significantly enriched transcripts are those with a fold change of ≥4 and a p-value of ≤0.05. Significant hits are highlighted in red. c Classification of captured synaptic lncRNAs based on their genomic location with respect to protein coding genes and according to GENCODE V25 annotation. d Bar plots showing the top 10 lncRNAs that are significantly enriched at the synapse and expressed as Fragments Per Kilobase of transcript per Million mapped reads (FPKM) (Supplementary Data 2) (nucleus and synapse, n = 6 and 4 independent biological replicates per group, respectively, Ballgown parametric F-test. Rpph1, q = 0.001544; Rmrp, q = 0.006962; Gas5, q = 0.000628; Rn7sk, q = 0.008848; Oip5os1, q = 0.000161; 9330121K16Rik, q = 0.00001; Gm28437, q = 0.010893; Rny1, q = 0.004098; Rny3, q = 0.003025; Gm47305, q = 0.013784. *q < 0.05, **q < 0.01, ***q < 0.005, ****q < 0.001. Error bars represent S.E.M. el RT-qPCR of 8 of the 10 synapse-enriched candidates in the ILPFC following fear extinction training. 18S rRNA was used as the housekeeping gene for normalization (Supplemental Fig. 2a). Statistical significance was determined using two-tailed unpaired Student’s t test on independent biological replicates (Rpph1, RC, n = 7, EXT, n = 9, t(12.24) = 2.227, p = 0.0454; Rmrp, RC, n = 7, EXT, n = 10, t(10.41) = 2.5, p = 0.0306; Rn7sk, RC, n = 7, EXT, n = 10, t(13) = 3.159, p = 0.0075; Oip5os1, RC, n = 6, EXT, n = 7, t(11) = 1.001, p = 0.3385; 9330121K16Rik, RC, n = 7, EXT, n = 10, t(13.55) = 2.25, p = 0.0416; Gm28437, RC, n = 7, EXT, n = 10, t(14.75) = 2.328, p = 0.0346; Gm47305, RC, n = 6, EXT, n = 8, t(10.23) = 2.233, p = 0.049; Gas5, RC, n = 7, EXT, n = 9, t(8.814) = 3.263, p = 0.0101). *p < 0.05, **p < 0.01. Error bars represent S.E.M.
Fig. 2
Fig. 2. Gas5 is highly enriched in the synapse following fear extinction training.
a Illustration of alternative splicing (AS) events. b Splicing patterns of AS events in synapse- and nucleus- enriched lncRNAs. Skipped exons (synapse = 32%; nucleus = 17%; two-proportions Z-test, p = 2.41e−45), intron retention (synapse = 8%; nucleus = 21%; two-proportions Z-test, p = 2.13e−52). c Heatmap showing Gas5 isoforms expression generated using IsoVis. Red and green indicating high and low expression, respectively. Arrow indicates Gas5 variant ENSMUST00000162558.7. d RT-qPCR of Gas5 variant expression in the nuclear and synaptic fractions of the ILPFC. The amplified Gas5 exonic (E) and intronic (I) regions are indicated. Gas5 transcripts with and without introns are also indicated. Statistical significance was determined using two-tailed unpaired Student’s t test on independent biological replicates (E11-I11-E12, nucleus, n = 12, synapse, n = 10, t(11.02) = 16.91, p < 0.0001; I9-E10, nucleus, n = 6, synapse, n = 4, t(5.031) = 7.704, p = 0.0006; I8-E11, nucleus, n = 6, synapse, n = 4, t(5) = 8.452, p = 0.0004; E2-I2, nucleus, n = 6, synapse, n = 4, t(5.004) = 8.159, p = 0.0004; I5, nucleus, n = 6, synapse, n = 4, t(5.022) = 7.948, p = 0.0005; E1-E2-E3, nucleus, n = 12, synapse, n = 9, t(8.01) = 4.774, p = 0.0014; E8-E12, nucleus, n = 12, synapse, n = 9, t(8,083) = 3.834, p = 0.0049). ***p < 0.005, ****p < 0.0001. Error bars represent S.E.M. e RT-qPCR of Gas5 variant ENSMUST00000162558.7 in the nucleus and synapse fractions of ILPFC samples. Statistical significance was determined using two-tailed unpaired Student’s t test on independent biological replicates (Gas5, nucleus, n = 6, synapse, n = 9, t(8.05) = 3.453, p = 0.0086; Meg3, nucleus, n = 8, synapse, n = 6, t(7) = 9.763, p < 0.0001). **p < 0.01, ****p < 0.0001. Error bars represent S.E.M. f Representative image showing the localized expression of the Gas5 variant in primary cortical neurons (n = 8 fields of views). Arrowheads show synaptic localization. Scale bar, 20 µm. Red, Gas5; blue, DAPI; green, MAP2 protein. The boxed region is enlarged in the inserts. Scale bar, 5 µm.
Fig. 3
Fig. 3. Gas5 interacts with proteins involved in translation, and RNA localization, as well as RNA granules.
a Venn diagram showing the number of unique and common proteins that bind to Gas5 in both the RC and EXT groups. b STRING network analysis of the proteins bound to Gas5 in both the RC and EXT groups. Only interactions with a STRING score ≥0.7 are shown. Evidence of interaction is represented by the distance between the nodes, with more tightly packed nodes having a higher STRING score. In both groups, membraneless organelles, ribosomes, cytoskeleton, and spliceosome clusters that contain tightly packed nodes are depicted. n = 3 independent biological replicates per group.
Fig. 4
Fig. 4. Gas5 interacts with CAPRIN1 and G3BP2 using distinct structural modules.
a Schematic showing deleted regions (D1–D10) of Gas5 RNA fragments used for the in vitro biotinylated RNA pull-down assay to identify the CAPRIN1- and G3BP2-binding regions along the Gas5 variant. The start and end position of the deleted regions are indicated either above or bottom of each red bars. b Western Blots displaying CAPRIN1 and G3BP2 protein expression after incubating different fragments of in-vitro transcribed Gas5 with ILPFC protein extracts based on n = 3 experimental replicates. Band intensity values of c CAPRIN1 and d G3BP2 are normalized to their undeleted full-length control and lncRNAs, ADRAM and Neat1, was used as negative controls, one-way ANOVA for CAPRIN1 (F (11,24) = 5.99, p = 0.0001; Dunnett’s post hoc tests: D3 versus D9, p = 0.0163; D3 versus D10, p = 0.0123; D3 versus ADRAM, p = 0.009; D3 versus Neat1, p = 0.0049) and G3BP2 (F (11,24) = 6.438, p < 0.0001; Dunnett’s post hoc tests: D6 versus D5, p = 0.0128; D6 versus D10, p = 0.0017; D6 versus ADRAM, p = 0.001; D6 versus Neat1, p = 0.0007). *p < 0.05, **p < 0.01, ***p < 0.005, ****p < 0.001. Error bars represent S.E.M.
Fig. 5
Fig. 5. Gas5 knockdown impairs the mobility and clustering of RNA granules and regulates intrinsic excitability.
a Schematic representation of the viral CIRTS knockdown construct. b expression of CIRTS along dendrites in primary cortical neurons. Time chased after 10 min of KCl induction is indicated. Arrowheads show CIRTS puncta (red) (n = 8 field of views). Scale bar = 5 µm. green, MAP2. c qRT-PCR performed on primary cortical neurons transduced with either control (n = 7 independent replicates) or CIRTS-Gas5 (n = 6 independent replicates) (two-tailed unpaired Student’s t test, t(9.329) = 3.584, p = 0.0056). **p < 0.01. Error bars represent S.E.M. d Representative primary cortical neurons dendritic region of interest illustrated from i) control and ii) a CIRTS-Gas5 knockdown neuron. Calibration bar shows the log10 diffusion coefficient, yellow colors represent areas of lower diffusion. Scale bar, 2.5 μm. Graph displaying (e) the mean squared displacement (μm2) and (f) the area under the MSD curve (μm2 s) for control (n = 6 independent replicates) and CIRTS-Gas5 knockdown neurons (n = 5 independent replicates) (two-tailed unpaired Student’s t test, p = 0.0303). *p < 0.05. Mean ±S.E.M. are plotted. g 3D representation of a region of interest highlights individual clusters (top), and their appearance in time (bottom). Spatiotemporal clusters were analyzed for their (h) radius (μm), (i) cluster lifetime (s), (j) density in clusters (traj/μm2) and (k) cluster average MSD (μm2) (Control, n = 1244 clusters; CIRTS-Gas5, n = 1811 clusters) (two-tailed unpaired Student’s t test, radius, t(2760) = 3.042, p = 0.0024; cluster lifetime, t(2921) = 5.354, p < 0.0001; density in clusters, t(2950) = 5.596, p < 0.0001; cluster average, t(2724) = 1.967, p = 0.0493). *p < 0.05, **p < 0.01, ****p < 0.0001. Mean ± S.E.M. are plotted. l Traces of mEPSCs recorded in primary cortical neurons in the presence of control or CIRTS-Gas5 knockdown. Plot showing (m) mEPSC amplitude and (n) mEPSC frequency of primary cortical neurons in the presence of control (n = 16 independent replicates) or CIRTS-Gas5 knockdown (n = 10 independent replicates) (two-tailed unpaired Student’s t test, amplitude, t(20.89) = 3.667, p = 0.0014; frequency, t(20.82) = 2.74, p = 0.0123). *p < 0.05, **p < 0.01. Error bars represent S.E.M.
Fig. 6
Fig. 6. Targeted Gas5 knockdown impairs fear extinction memory.
a Subcompartment-specific CIRTS-Gas5-mediated Gas5 knockdown leads to a reduction in endogenous Gas5 expression at the synapse (n = 7 independent biological replicates per group, two-tailed unpaired Student’s t test, t(7.681) = 3.158, p = 0.0142) *p < 0.05, with (b) no effect on Gas5 expression in the nucleus (n = 7 independent biological replicates per group, two-tailed unpaired Student’s t test, t(8.77) = 0.8795, p = 0.4026). c Schematic of the behavioral protocol used to test the effect of Gas5 knockdown in the ILPFC on fear extinction memory. CTX context, CS conditioned stimulus, US unconditioned stimulus. d There was no effect of Gas5 knockdown on within-session performance during fear extinction training (EXT Control, n = 13 independent biological replicates per group, EXT CIRTS-Gas5, n = 8 independent biological replicates per group, two-way repeated measures ANOVA, F (1,19) = 1.447, p = 0.2438). e There was no effect of Gas5 knockdown on the ability to express fear memory (RC Control vs RC CIRTS-Gas5); however, mice treated with CIRTS-Gas5 exhibit impaired fear extinction memory (RC Control, n = 10 independent biological replicates per group, RC CIRTS-Gas5, n = 11 independent biological replicates per group, EXT Control, n = 13 independent biological replicates per group, EXT CIRTS-Gas5, n = 8 independent biological replicates per group, two-way ANOVA, F3,38 = 8.995, p = 0.0001; Dunnett’s post hoc tests: RC Control versus EXT Control, CS1 ***p = 0.0007, CS2 ***p = 0.0004, CS3 ****p < 0.0001; RC Control versus EXT CIRTS-Gas5, CS1 p = 0.0994, CS2 p = 0.084, CS3 *p = 0.0158; RC Control versus RC CIRTS-Gas5, CS1 p = 0.4485, CS2 p = 0.7067, CS3 p = 0.9808). Error bars represent S.E.M.
Fig. 7
Fig. 7. Model of the proposed mechanism by which Gas5 influences synaptic activity and the formation of fear extinction memory.
Extinction learning leads to the accumulation of the Gas5 variant in the synaptic compartment, which then sequesters CAPRIN1 and G3BP2 containing RNA granules away from clustering, leading to an increase in local protein synthesis and tighter control over synaptic plasticity.

References

    1. Martin SJ, Grimwood PD, Morris RG. Synaptic plasticity and memory: an evaluation of the hypothesis. Annu. Rev. Neurosci. 2000;23:649–711. doi: 10.1146/annurev.neuro.23.1.649. - DOI - PubMed
    1. Alberini CM. Transcription factors in long-term memory and synaptic plasticity. Physiol. Rev. 2009;89:121–145. doi: 10.1152/physrev.00017.2008. - DOI - PMC - PubMed
    1. Bruel-Jungerman E, Rampon C, Laroche S. Adult hippocampal neurogenesis, synaptic plasticity and memory: facts and hypotheses. Rev. Neurosci. 2007;18:93–114. doi: 10.1515/REVNEURO.2007.18.2.93. - DOI - PubMed
    1. Andergassen, D., et al. In vivo Firre and Dxz4 deletion elucidates roles for autosomal gene regulation. Elife8, e47214 (2019). - PMC - PubMed
    1. Rinn JL, et al. Functional demarcation of active and silent chromatin domains in human HOX loci by noncoding RNAs. Cell. 2007;129:1311–1323. doi: 10.1016/j.cell.2007.05.022. - DOI - PMC - PubMed

Publication types

Substances