. 2023 Nov 22;14(1):7608.
doi: 10.1038/s41467-023-43435-4.

Taxonomic and environmental distribution of bacterial amino acid auxotrophies

Affiliations

Taxonomic and environmental distribution of bacterial amino acid auxotrophies

Josep Ramoneda et al. Nat Commun. .

Abstract

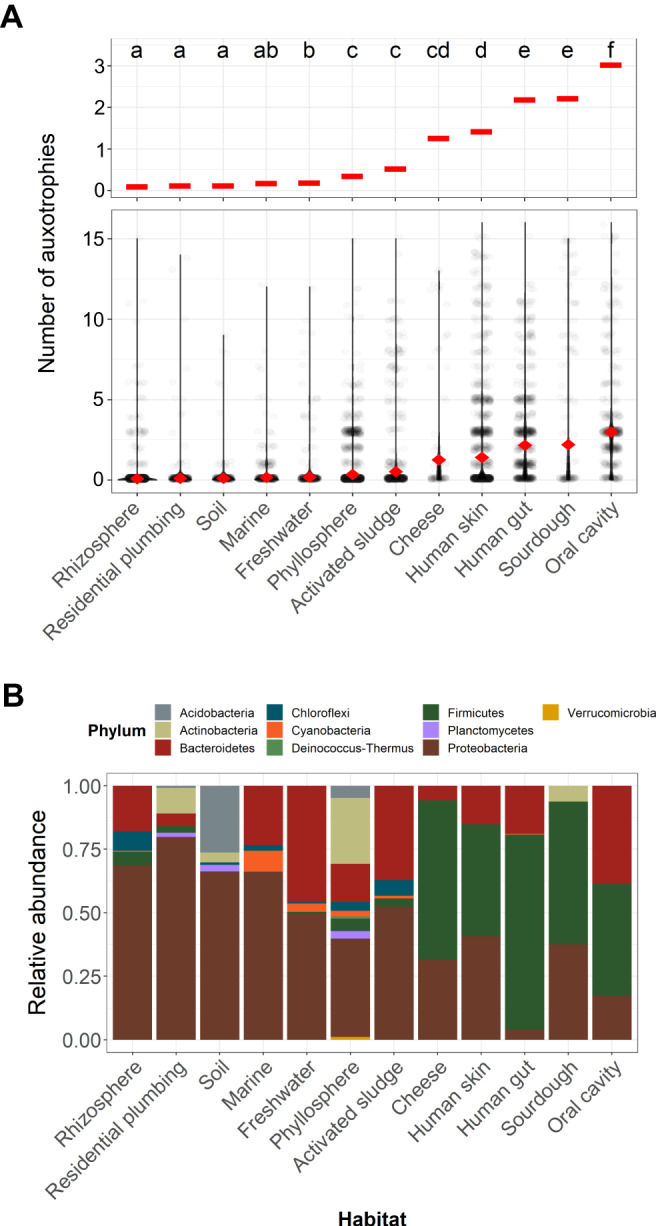
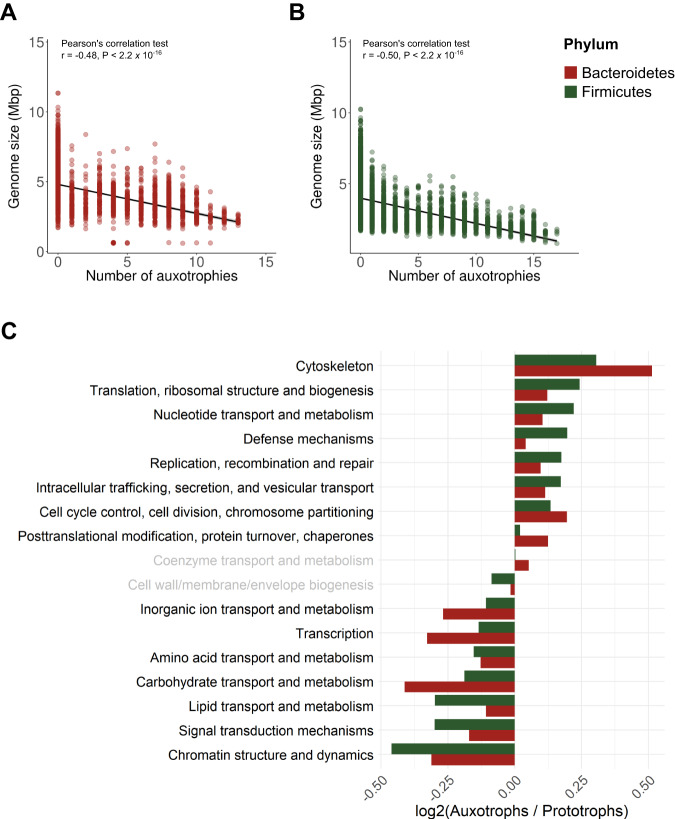
Many microorganisms are auxotrophic-unable to synthesize the compounds they require for growth. With this work, we quantify the prevalence of amino acid auxotrophies across a broad diversity of bacteria and habitats. We predicted the amino acid biosynthetic capabilities of 26,277 unique bacterial genomes spanning 12 phyla using a metabolic pathway model validated with empirical data. Amino acid auxotrophy is widespread across bacterial phyla, but we conservatively estimate that the majority of taxa (78.4%) are able to synthesize all amino acids. Our estimates indicate that amino acid auxotrophies are more prevalent among obligate intracellular parasites and in free-living taxa with genomic attributes characteristic of 'streamlined' life history strategies. We predicted the amino acid biosynthetic capabilities of bacterial communities found in 12 unique habitats to investigate environmental associations with auxotrophy, using data compiled from 3813 samples spanning major aquatic, terrestrial, and engineered environments. Auxotrophic taxa were more abundant in host-associated environments (including the human oral cavity and gut) and in fermented food products, with auxotrophic taxa being relatively rare in soil and aquatic systems. Overall, this work contributes to a more complete understanding of amino acid auxotrophy across the bacterial tree of life and the ecological contexts in which auxotrophy can be a successful strategy.


Conflict of interest statement

The authors declare no conflicts of interest.

Figures

Fig. 1
Fig. 1. Amino acid auxotrophy across the predominant bacterial phyla.
A Prevalence of amino acid auxotrophy in bacterial taxa from the most common phyla (N = 26,277 genomes). B Prevalence of amino acid auxotrophy in genomes derived from environmental metagenomes (MAGs) or single cells (SAGs) (Assembled), and in genomes obtained from bacterial isolates (Isolate). The mean number of amino acid auxotrophies in A, B is indicated with white diamonds. C Proportion of taxa that are auxotrophic for each of the 17 amino acids and chorismate out of the total number of auxotrophic taxa (N = 3613 genomes). Numbers in brackets in panel A indicate the number of genomes for which we predicted amino acid auxotrophy, numbers in brackets in panel B indicate the number of assembled and isolate genomes included, and numbers in brackets in C indicate the subset of taxa within each phylum that were predicted to be auxotrophs for at least one amino acid. Letters in panel A indicate statistical differences (P < 0.05) between phyla based on Mann–Whitney U tests with P-values Bonferroni-corrected for multiple comparisons.
Fig. 2
Fig. 2. Amino acid auxotrophy in bacteria across habitats.
A Prevalence of amino acid auxotrophy in representative bacterial taxa from 12 different habitats (N = 13,523 genomes). The mean number of amino acid auxotrophies of representative bacterial taxa in each habitat is shown as red diamonds in the main panel, and as horizontal bars in the top subpanel. B Relative abundance of the most dominant phyla across habitats. The x-axis is sorted by increasing numbers of auxotrophic taxa in each habitat. Letters at the top of A indicate statistical differences (P < 0.05) between habitats based on Mann-Whitney U tests with Bonferroni-corrected p-values.
Fig. 3
Fig. 3. Evidence for genome streamlining and related functional features in bacterial taxa that are auxotrophic for amino acids.
A, B Relationship between genome size and the number of amino acid auxotrophies in bacterial taxa from the phylum Bacteroidetes A and Firmicutes B, respectively. C Functional categories that are consistently overrepresented in auxotrophic and prototrophic genomes from the phyla Bacteroidetes and Firmicutes. Functional categories were defined as Clusters of Orthologous Genes (COGs). We displayed those categories where the Bacteroidetes and Firmicutes had non-statistically significant trends in grey font based on Mann-Whitney U tests (P < 0.01). Pearson’s correlation coefficients (r) are displayed on A, B. NBacteroidetes = 3232 genomes, NFirmicutes = 4674 genomes.

References

    1. Tripp HJ, et al. SAR11 marine bacteria require exogenous reduced sulphur for growth. Nature. 2008;452:741–744. doi: 10.1038/nature06776. - DOI - PubMed
    1. Yu XJ, Walker DH, Liu Y, Zhang L. Amino acid biosynthesis deficiency in bacteria associated with human and animal hosts. Infect. Genet. Evol. 2009;9:514–517. doi: 10.1016/j.meegid.2009.02.002. - DOI - PMC - PubMed
    1. Ryback B, Bortfeld-Miller M, Vorholt JA. Metabolic adaptation to vitamin auxotrophy by leaf-associated bacteria. ISME J. 2022;16:2712–2724. doi: 10.1038/s41396-022-01303-x. - DOI - PMC - PubMed
    1. Bertrand EM, Allen AE. Influence of vitamin B auxotrophy on nitrogen metabolism in eukaryotic phytoplankton. Front. Microbiol. 2012;3:375. doi: 10.3389/fmicb.2012.00375. - DOI - PMC - PubMed
    1. Thakur K, Tomar SK, De S. Lactic acid bacteria as a cell factory for riboflavin production. Microb. Biotechnol. 2016;9:441–451. doi: 10.1111/1751-7915.12335. - DOI - PMC - PubMed

Publication types