. 2023 Nov 22;6(1):1188.
doi: 10.1038/s42003-023-05553-z.

Phylogenetic comparative analysis of the cerebello-cerebral system in 34 species highlights primate-general expansion of cerebellar crura I-II

Affiliations

Phylogenetic comparative analysis of the cerebello-cerebral system in 34 species highlights primate-general expansion of cerebellar crura I-II

Neville Magielse et al. Commun Biol. .

Abstract

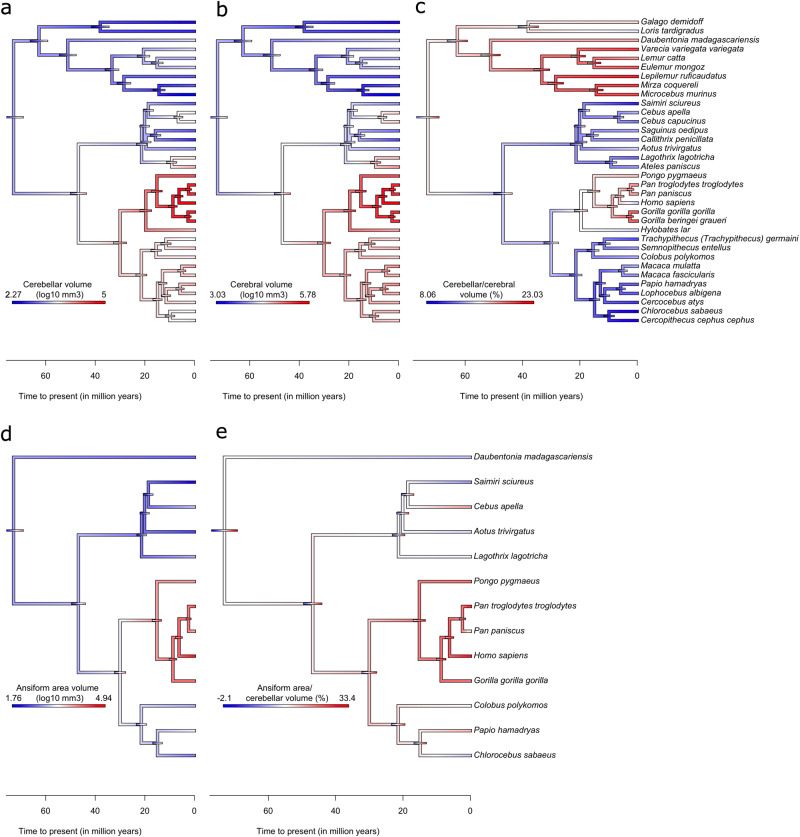
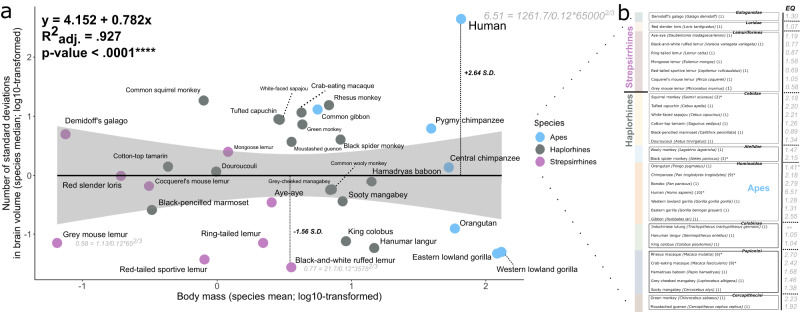
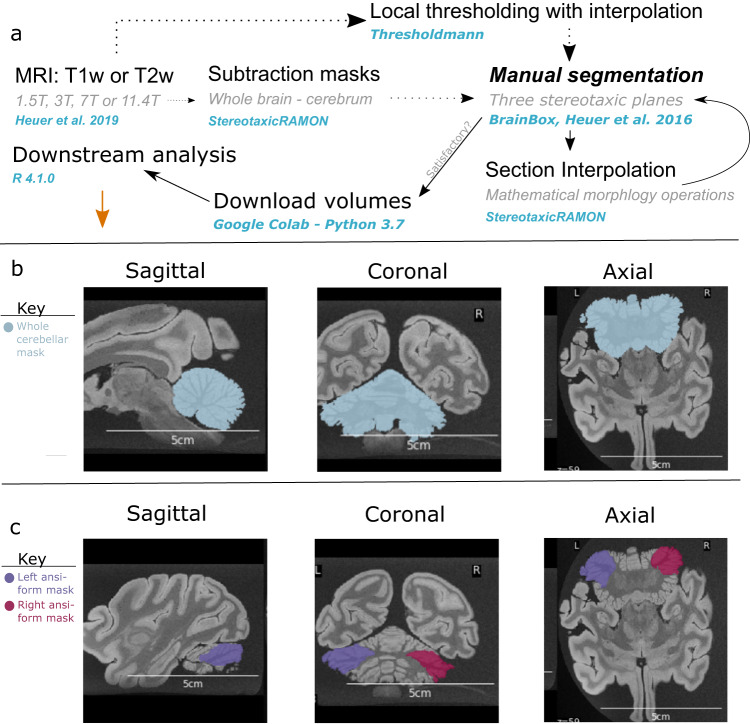
The reciprocal connections between the cerebellum and the cerebrum have been suggested to simultaneously play a role in brain size increase and to support a broad array of brain functions in primates. The cerebello-cerebral system has undergone marked functionally relevant reorganization. In particular, the lateral cerebellar lobules crura I-II (the ansiform) have been suggested to be expanded in hominoids. Here, we manually segmented 63 cerebella (34 primate species; 9 infraorders) and 30 ansiforms (13 species; 8 infraorders) to understand how their volumes have evolved over the primate lineage. Together, our analyses support proportional cerebellar-cerebral scaling, whereas ansiforms have expanded faster than the cerebellum and cerebrum. We did not find different scaling between strepsirrhines and haplorhines, nor between apes and non-apes. In sum, our study shows primate-general structural reorganization of the ansiform, relative to the cerebello-cerebral system, which is relevant for specialized brain functions in an evolutionary context.


Conflict of interest statement

The authors declare no competing interests

Figures

Fig. 1
Fig. 1. Consensus phylogenetic tree for the 34 primate species in this study.
We obtained the consensus tree for the 34 species in our dataset from 10kTrees Arnold et al.. It represents the best-supported evolutionary relationships between the primates in our sample. Archeological epochs are superimposed on the tree to provide a temporal perspective of predicted species bifurcations. Internal node numbers are plotted and can be used to identify ancestral characters (Supplementary Table 1). Extant species included in the current study are provided on the right and are colored by clade membership. Additionally, the sample size per species is given in parentheses. Species with multiple specimens are marked with asterisks.
Fig. 2
Fig. 2. Ancestral character estimations for neuroanatomical traits.
Ancestral character estimations (ACEs) based on the Brownian Motion (BM) model of trait evolution are provided for absolute (a, b, d) and relative (c, e) volumes, alongside node-wise 95% confidence intervals (colored bars on tree nodes). ACEs for cerebellar (a), cerebral (b), and relative cerebellar-to-cerebral (c) volumes were calculated from, and mapped to, the full 34-species tree, whereas ansiform (d) and relative ansiform-to-cerebellar volumes (e) were calculated from, and mapped to, the 13-species tree. Note that the ratios in (c, e) serve merely to illustrate how ratios may result from the allometries described in Fig. 3a, c. Gradient colors on the tree represent log10-transformed brain area volumes (in mm3) (a, b, d), and volumetric fractions (in percentages) (c, e), respectively. The ancestral node was estimated at 73 million years to present. N = 34 species in (ac) and N = 13 in (d, e).
Fig. 3
Fig. 3. Allometric and phylogenetic regressions highlight ansiform hyperscaling relative to the cerebello-cerebral system.
Phylogenetic generalized least squares (PGLS) regressions for cerebellar volume regressed on cerebral volume (a, b), and ansiform regressed on rest of cerebellar (c) and cerebral (d) volumes. Median volumetric data were taken from 34-species (a) and 13-species (bd). Log10-transformed neuroanatomical measures were plotted and overlaid with regression lines obtained in the respective PGLS models. 95% (black dotted line) and 99% (red dotted line) confidence intervals are provided alongside a fictive isometric scaling relationship with the same intercept (blue line). Exclusion of the isometric scaling relationship from the confidence intervals was taken to indicate significant allometry, as indicated by the asterisks. a, b Cerebellar volumes regressed on cerebral volumes for full data (a) and for the 13 species with complete data (b) both illustrate isometric scaling trending towards hypo-allometry. Lemuriformes and Hominidea were the two clades with the most impressive cerebellar-to-cerebral volume ratios (Fig. 2c) and were thus specifically colored here (Lemuriformes colored in a bold gray; (ad) to show how ratios were confounded by the primate-general allometry between areas of the cerebello-cerebral system. Although species belonging to these infraorders displayed slightly higher cerebellum-to-cerebrum scaling than the primate sample as a whole (a), most of the differences in ratio resulted directly from allometry. Zooming in, (a) illustrates that while most Hominoidea, including Homo sapiens, Pongo pygmaeus, and Hylobates lar fall on the regression line of the sample, all but one of the Lemuriformes (Lemur catta; on the line) exceed the general trend. Additionally, in both clades, several species approach isometry, with one member of each falling on the isometric line (Gorilla gorilla gorilla and Mirza coquereli). (b) Illustrates reducing of the PGLS slope, connected to the smaller sample of species. c, d Ansiform volume regressed on the rest of cerebellar volume (c) and cerebral volume (d) both illustrate hyper-allometric scaling relationships. Because of strong positive allometry, species with larger cerebella and cerebra are expected to have larger relative ansiforms, directly accounting for the high ratios reported in (Fig. 2e). c, d Both illustrate that Hominoidea do not have uniquely large ansiforms. Although some Hominoidea lie above this steep regression line, so do several other—smaller—species (as colored in green; Mirza coquereli, Aotus trivirgatus, Cebus apella, and Papio hamadryas). NS = non-significant. N = 34 in (a), and N = 13 in (bd).
Fig. 4
Fig. 4. Cerebello-cerebral scaling may be primate-general.
Data were split into strepsirrhine and haplorhine (ae) and ape and non-ape (fi) subsets. Separate PGLS regressions were performed in these groups. Importantly, none of the grade shifts were significant as assessed by phylogenetic ANCOVA (Pr > F are given for the varying slopes, intercept, or both). For strepsirrhines, a slightly higher intercept was observed for cerebellar scaling relative to the cerebrum (a; main analysis). When regressed against body mass, cerebella scaled similarly between groups (b), whereas the cerebral PGLS had a slightly lower intercept in strepsirrhines relative to haplorhines (c). This showed the opposite pattern relative to the main PGLS (a). Within the brain however, cerebellar volumes appeared to be more influential on the regression in (a). The jump in intercept for strepsirrhines in cerebellar PGLS mirrored the main PGLS (d), while cerebra scaled virtually identically between groups (e). For apes/non-apes, it appeared that ape cerebella were relatively large (f; main analysis). This (merely visual) shift was slightly accentuated by restricting the analyses to haplorhines as in Barton and Venditti. (g). Ansiform regressions on the rest of cerebellar (h) and cerebral (i) volumes revealed no differences. Together, the lack of significant differences in any pANCOVA argue for primate-general scaling. Nstrepsirrhine = 9; Nhaplorhine = 25 (ae); Nape = 7; and Nnon-ape = 27 (f); Nape = 7; and Nnon-ape = 18 (g); and Nape = 5 and Nnon-ape = 8 (h, i).
Fig. 5
Fig. 5. Brain-body scaling in the primate sample.
Here, we plotted the number of standard deviations from the brain volume–body mass regression versus body mass to visualize how they covary among clades and major primate bifurcations (a). Gray shading indicates the 95% confidence interval for the linear regression. We also replicated Jerison’s encephalization quotient (EQ) in our data, describing brain-to-body scaling relative to expectation based on allometric scaling (b). We used the allometry described by Jerison for mammals: EQ=0.12P2/3, with P = body mass. EQ varied greatly between clades, and somewhat less within them. Deviations from our primate brain-body regression show little within-clade consistency or relation to grouping. *Indicates suspected outliers; **indicates missing values. N = 34 species (63 observations).
Fig. 6
Fig. 6. Replication of allometric relationship between the cerebellum and cerebrum in the Stephan collection.
The Stephan et al. collection reported cerebellar and cerebral volumes for 34 species available in 10kTrees Arnold et al.. Ancestral character estimations (ACEs) (a) and phylogenetic generalized squares regression (PGLS) (b) were repeated in this complementary dataset. Despite only partial overlap in species, ACEs for cerebellar-to-cerebral volume ratios (a) largely mirrored the main analysis (Fig. 2c). PGLS regression between cerebellar and cerebral volumes in the Stephan collection (b) illustrated generally similar scaling as the primary analysis (Fig. 3a), albeit reduced at approximately 0.92 (black line), and with its 95% confidence intervals (black dotted line), but not 99% confidence intervals (red dotted line), excluding isometry (blue line). All apes and lemurs fell on or above the regression line, approaching isometry and mirroring the main analysis (Fig. 3a). Altogether, the analyses again show how allometry causes diverse ratios between brain areas to arise across species. Legend: apes are colored as in Fig. 3a, with legend again shown here in (b). Lemuriformes are colored here as well, with solid grays representing species overlapping with the main analysis, and solid blacks indicating lemur species unique to the Stephan dataset (a, b). Lastly, other species overlapping between both datasets, that were not specifically considered, are colored a shaded gray (a, b). N = 34 species.
Fig. 7
Fig. 7. Manual segmentation method for primate brains.
a A schematic representation of the manual segmentation pipeline. T1- and T2-weighed (T1w and T2w) MRI scans previously described in Heuer et al. were used to make initial cerebellar masks by subtracting cerebral masks from whole brain masks with StereotaxicRAMON. Some initial cerebellar masks were made through local thresholding and interpolation with Thresholdmann. Cerebellar masks were then uploaded to BrainBox for manual segmentation. Manual segmentation was performed iteratively with interpolation between slices through mathematical morphology operations, until segmentations reached satisfactory quality. Volumes were then downloaded with a custom python script for subsequent analysis in R. bc Example segmentations in stereotaxic planes for the cerebellum and ansiform in the hamadryas baboon. b Cerebellar segmentations primarily involved removal of the brain stem, removing erroneously marked tissue and fissures, and reconstructing damaged tissue. c Ansiform segmentations additionally involved identification of superior posterior and ansoparamedian fissures, and segmentation between these. Segmentations were made so they did not enter vermal portions of lobule VII. Example masks are color-coded (see legend), but the meaning of the colors themselves is arbitrary. Scale bars are provided for each image.
Fig. 8
Fig. 8. Correlations for neuroanatomical measurements.
Volumes recorded in the current study were correlated with the measurements from Heuer et al.. The lower diagonal displays the correlations of log10-transformed variables, which were not corrected for phylogeny and included all specimens. These correlations serve to illustrate the strong collinearity between the traits, which are an expected outcome of allometric scaling. Corresponding R2 coefficients for the correlations can be found on the upper diagonal. Cerebellar, cerebral, and ansiform volumes correlated strongly and positively with all other variables, except fold wavelength, for which a negative correlation was observed. N = 34 species.

References

    1. Van Overwalle F, et al. Consensus paper: cerebellum and social cognition. Cerebellum. 2020;19:833–868. doi: 10.1007/s12311-020-01155-1. - DOI - PMC - PubMed
    1. Koziol LF, et al. Consensus paper: the cerebellum’s role in movement and cognition. Cerebellum. 2014;13:151–177. doi: 10.1007/s12311-013-0511-x. - DOI - PMC - PubMed
    1. Mariën P, et al. Consensus paper: language and the cerebellum: an ongoing enigma. Cerebellum. 2014;13:386–410. - PMC - PubMed
    1. Adamaszek M, et al. Consensus paper: cerebellum and emotion. Cerebellum. 2017;16:552–576. doi: 10.1007/s12311-016-0815-8. - DOI - PubMed
    1. Botez MI, Gravel J, Attig E, Vézina JL. Reversible chronic cerebellar ataxia after phenytoin intoxication: possible role of cerebellum in cognitive thought. Neurology. 1985;35:1152–1157. doi: 10.1212/WNL.35.8.1152. - DOI - PubMed

Publication types