. 2023 Nov 22;13(1):20513.
doi: 10.1038/s41598-023-47997-7.

Reduced LHFPL3-AS2 lncRNA expression is linked to altered epithelial polarity and proliferation, and to ileal ulceration in Crohn disease

Affiliations

Reduced LHFPL3-AS2 lncRNA expression is linked to altered epithelial polarity and proliferation, and to ileal ulceration in Crohn disease

Katya E Sosnovski et al. Sci Rep. .

Abstract

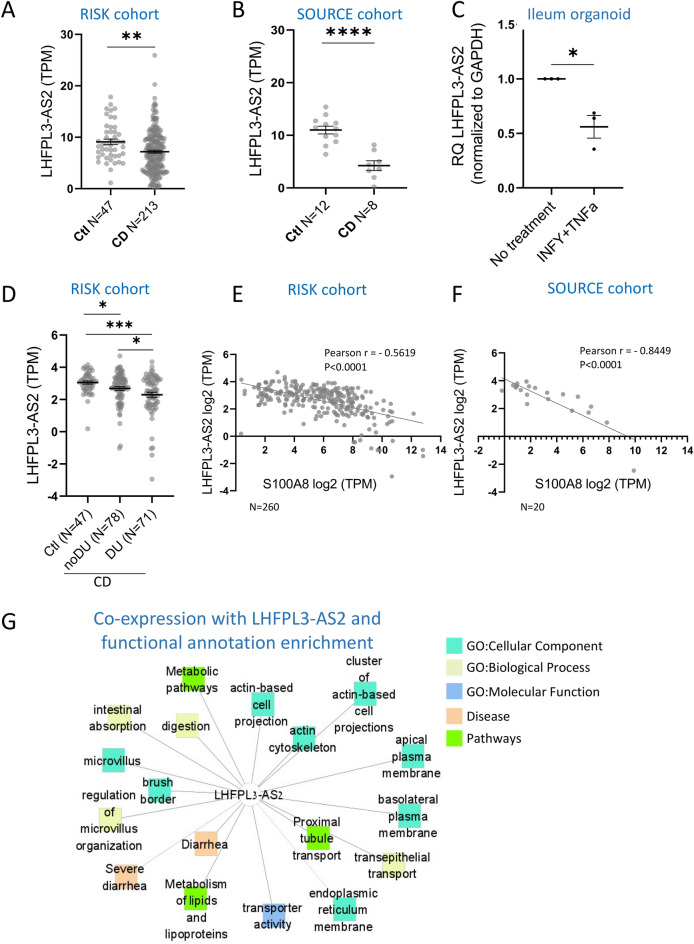
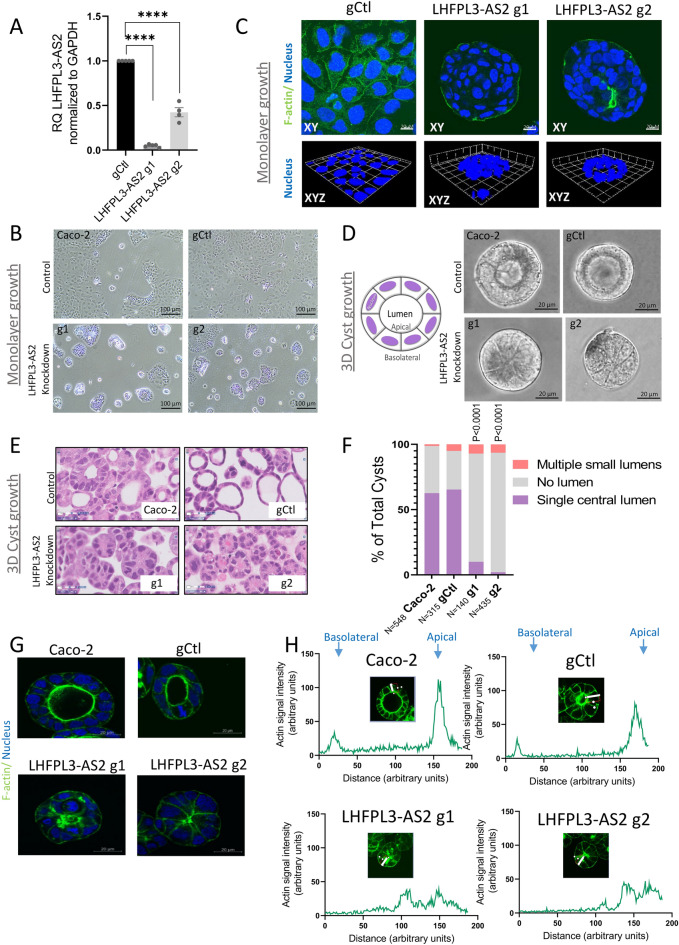
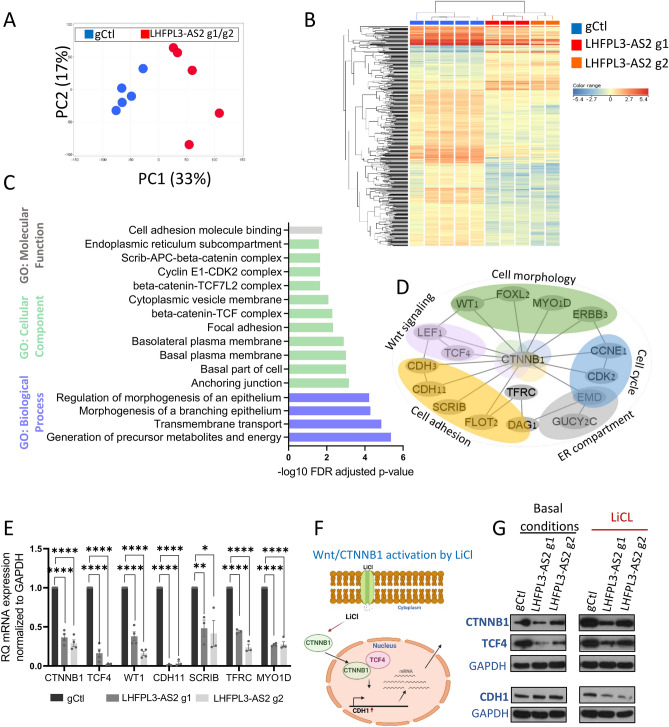
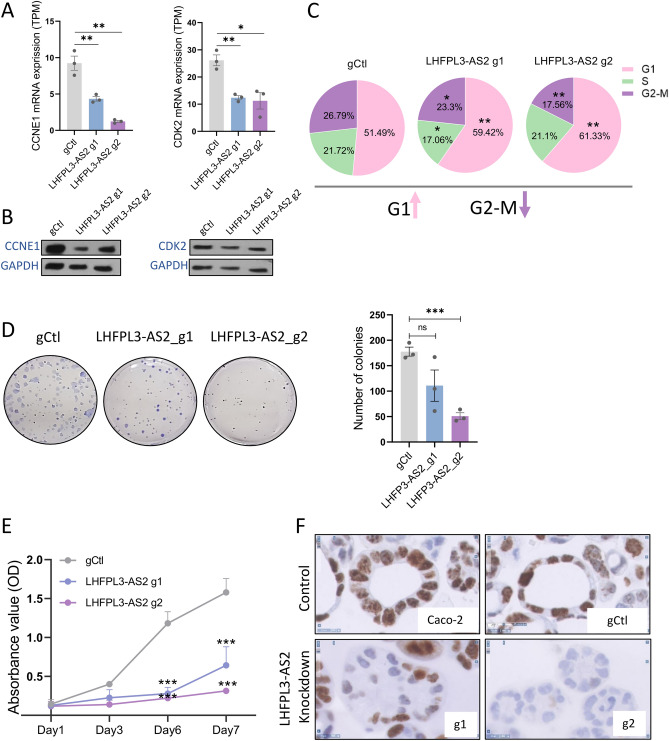
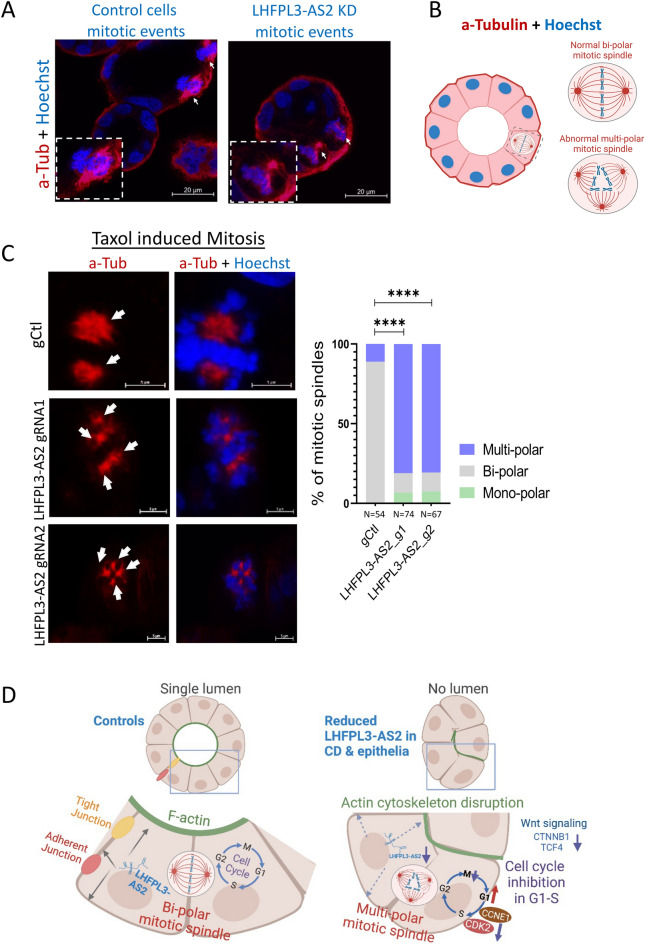
Disruption of intestinal epithelial functions is linked to Crohn disease (CD) pathogenesis. We identified a widespread reduction in the expression of long non-coding RNAs (lncRNAs) including LHFPL3-AS2 in the treatment-naïve CD ileum of the RISK pediatric cohort. We validated the reduction of LHFPL3-AS2 in adult CD and noted a further reduction in patients with more severe CD from the RISK cohort. LHFPL3-AS2 knockdown in Caco-2 cells robustly affected epithelial monolayer morphogenesis with markedly reduced confluency and spreading, showing atypical rounding, and clumping. mRNA-seq analysis of LHFPL3-AS2 knockdown cells highlighted the reduction of genes and pathways linked with apical polarity, actin bundles, morphogenesis, and the b-catenin-TCF4 complex. LHFPL3-AS2 knockdown significantly reduced the ability of cells to form an internal lumen within the 3-dimensional (3D) cyst model, with mislocalization of actin and adherent and tight junction proteins, affecting epithelial polarity. LHFPL3-AS2 knockdown also resulted in defective mitotic spindle formation and consequent reduction in epithelial proliferation. Altogether, we show that LHFPL3-AS2 reduction affects epithelial morphogenesis, polarity, mitotic spindle formation, and proliferation, which are key processes in maintaining epithelial homeostasis in CD. Reduced expression of LHFPL3-AS2 in CD patients and its further reduction with ileal ulceration outcome, emphasizes its significance in this context.


Conflict of interest statement

The authors declare no competing interests.

Figures

Figure 1
Figure 1
LHFPL3-AS2 lncRNA is reduced in CD patients and its expression is negatively correlated with CD severity. (A,B) LHFPL3-AS2 mRNA is significantly reduced in bulk mucosal biopsies of CD cases vs. controls in two independent cohorts: the pediatric RISK (A) 213 CD, and 47 controls) and the adult SOURCE (B) 8 CD, and 12 controls) cohorts. (C) LHFPL3-AS2 is expressed in human ileum-derived organoid culture and is reduced upon treatment with 40 ng/ml IFNγ and 20 ng/ml TNFa. (D) LHFPL3-AS2 levels are further reduced in CD patients with deep ulcers (CD-DU, n = 71) in comparison to those without (CD-noDU, n = 78). LHFPL3-AS2 (TPM) values are shown. (E,F) LHFPL3-AS2 log2(TPM) significantly correlates with the calprotectin S100A8 gene as a continuous value in RISK ((E), n = 260) and SOURCE (F, n = 20). (G) Functional annotation enrichment analyses of 470 genes that were co-expressed with LHFPL3-AS2 in RISK using ToppGene/ToppCluster, and Cytoscape. GO: Biological Process (orange), GO: Cellular component (green), GO: Molecular function (blue). The full list of functional enrichment results and P values are in Supplementary Dataset S1. A two-sided t-test was calculated between groups and Pearson correlation was used for correlations. *P < 0.05, **P < 0.01, ***P < 0.001.
Figure 2
Figure 2
LHFPL3-AS2 knockdown results in robust loss of Caco-2 luminal cyst formation. (A) LHFPL3-AS2 knockdown was achieved using CRISPRi and 2 gRNAs, and those cells were compared with gCtl. qPCR confirmed a reduction in LHFPL3-AS2, after normalization to GAPDH. The two-sided t-test is shown. ****P < 0.0001. (B) Light microscopy imaging (× 10) of LHFPL3-AS2 knockdown or Caco-2 and gCtl cells after seeding them as a monolayer on a culture plate for 3 days, showing spontaneous rounding and clumping in the knockdown cells. Scalebar—100uM, magnification – × 10. (C) F-actin Phalloidin staining (green) and nuclear staining (blue) of LHFPL3-AS2 knockdown or gCtl cells after seeding them as a monolayer on a culture plate. The upper panel shows the xy-axis views and the lower panel shows a 3D reconstruction of z-stack images. LHFPL3-AS2 knockdown cells show a rounding appearance as demonstrated on the z-axis when grown as a monolayer, with less confluency and more clumping. Magnification x63oil, scalebar-20 µM. (D) Schematic representation and bright field imaging of LHFPL3-AS2 knockdown or Caco-2 and gCtl 3-dimensional (3D) cyst grown in Matrigel for 5 days, with lumen/apical part inside. Scalebar—20uM, magnification – × 40. (E) Haematoxylin and eosin (H&E) staining of Caco-2 cysts shows that most LHFPL3-AS2 knockdown cysts have no lumen. Scalebar—20uM, magnification – × 40. (F) Quantification of (D) indicating the percentage of cysts with a single central lumen, no lumen, or multiple lumens were quantified. Fisher exact test was performed comparing the number of cysts with a single lumen to those with no lumen or with multiple small lumens. (G) Phalloidin staining for F-actin (green) and nuclear Hoechst (blue) staining of Matrigel-grown cysts. Magnification x63oil, scalebar-20uM. (H) Line plots denoting the intensity of actin staining along the apical/basal axis of indicated cyst along the white line, from the apical to basolateral side. The image shows a representative experiment out of 6 replications (shown in Supplementary Fig. S3).
Figure 3
Figure 3
LHFPL3-AS2 knockdown reduced expression of genes, known to regulate epithelial morphology, including CTNNB1. (A) PCA using 11,489 protein-coding genes that passed expression filtering and colored by LHFPL3-AS2 knockdown (g1 and g2 in red) and gCtl (blue). (B) Heatmap of 584 genes that were differentially expressed between LHFPL3-AS2 knockdown cells (g1 and g2) compared to controls (gCtl, fold change >  = 1.5 and FDR corrected p <  = 0.05). (C) ToppGene functional annotation enrichment of 462/584 downregulated gene protein-coding genes with the associated − log10(FDR P value). (D) STRING predicted interaction network with visualization using Cytoscape of the downregulated genes. (E) qPCR validation of genes that were reduced in the mRNAseq dataset, normalized to GAPDH. The two-sided t-test is shown. *P ≤ 0.05, **P ≤ 0.01, ***P ≤ 0.001, ****P ≤ 0.0001. (F) Schematic representation of Wnt signaling activation by LiCl. (G) Western blots (representative experiment out of 3 replications) of LHFPL3-AS2 knockdown cells (g1 and g2) and controls (gCtl) with and without LiCl to activate the Wnt pathway showing reduction of CTNNB1 and TCF4 at baseline and after LiCl in LHFPL3-AS2 knockdown cells, and of CDH1 with LiCl.
Figure 4
Figure 4
LHFPL3-AS2 downregulation inhibited cell proliferation resulting in G1 cell cycle arrest. (A) mRNA levels (TPM) of CCNE1 and CDK2 in LHFPL3-AS2 knockdown cells (g1 and g2) and controls (gCtl). (B) Western Blot analysis of CCNE1 and CDK2 using GAPDH as a loading control (representative experiment out of 3 replications). Quantifying the protein expression, using ImageJ, and normalizing it to GAPDH indicated a reduction in CCNE1 of 59% with g1 and 24% with g2 and a more modest reduction in CDK2 of 16% with g1 and 18% with g2. (C) Propidium Iodide staining (PI) and FACS analyses of LHFPL3-AS2 knockdown cells (g1 and g2) and controls (gCtl). Percentages of cells in G1, S, and G2/M cell-cycle phases are in a pie chart. One sided t-test, n = 4, *p < 0.05, **p < 0.01. (D) Colony formation assay with representative images (left panel) and quantification (right panel) of the colonies (n = 3). (E) XTT assay absorbance values (OD) (n = 3) show that suppression of LHFPL3-AS2 inhibited Caco-2 cell proliferation. (F) Immunohistochemistry (IHC) staining of Ki-67 in paraffin-embedded sections of Caco-2 3D cysts. Scalebar – 10uM, magnification – × 40.
Figure 5
Figure 5
LHFPL3-AS2 knockdown results in abnormal multipolar mitotic spindle formation. (A) Fluorescence staining using anti-tubulin (red) and nuclear Hoechst (blue) of LHFPL3-AS2 CRISPRi knockdown and gCtl Caco-2 cysts. White arrows indicate mitotic spindles. Scalebar—20uM, magnification—x60oil. (B) Schematic representation of a normal bipolar mitotic spindle. (C) Caco-2 grown as 3D cysts were treated with 20 nM Taxol for 24 h to arrest cells during mitosis. Left panel—representative images of the mitotic spindles in LHFPL3-AS2 knockdowns and controls (gCtl). White arrows indicate centrosomes. Right panel—Percentage of cells with bipolar spindles, multipolar spindles, or monopolar spindles captured during mitosis. Fisher exact test between the fraction of cells with bi-polar spindles vs. multi/mono-polar spindles. ****P ≤ 0.0001. (D) Schematic cartoon summarizing LHFPL3-AS2's potential role in regulating epithelial polarity, proliferation, and mitotic spindle formation. Reduction of LHFPL3-AS2 affects apicobasal positioning of cytoskeleton protein (actin) and tight/adherens junction proteins. Loss of cellular polarity and abnormal cellular positioning likely underlies the abnormal mitotic spindle and centrosome arrangement, resulting in G1 cell cycle arrest, reduced cellular proliferation, and the robust subsequent inhibition of transcription and translation of many key epithelial genes including CTNNB1 and TCF4.

Similar articles

Cited by

References

    1. Magie CR, Martindale MQ. Cell-cell adhesion in the cnidaria: Insights into the evolution of tissue morphogenesis. Biol. Bull. 2008;214:218–232. doi: 10.2307/25470665. - DOI - PubMed
    1. Rodriguez-Boulan E, Macara IG. Organization and execution of the epithelial polarity programme. Nat. Rev. Mol. Cell Biol. 2014;15:225–242. doi: 10.1038/nrm3775. - DOI - PMC - PubMed
    1. Guo C, Shen J. Cytoskeletal organization and cell polarity in the pathogenesis of Crohn's disease. Clin. Rev. Allergy Immunol. 2021;60:164–174. doi: 10.1007/s12016-020-08795-5. - DOI - PubMed
    1. Jewett CE, Prekeris R. Insane in the apical membrane: Trafficking events mediating apicobasal epithelial polarity during tube morphogenesis. Traffic. 2018 doi: 10.1111/tra.12579. - DOI - PMC - PubMed
    1. van der Wouden JM, Maier O, van IJzendoorn SC, Hoekstra D. Membrane dynamics and the regulation of epithelial cell polarity. Int. Rev. Cytol. 2003;226:127–164. doi: 10.1016/s0074-7696(03)01003-9. - DOI - PubMed