. 2024 Jan;625(7993):148-156.
doi: 10.1038/s41586-023-06753-7. Epub 2023 Nov 22.

Repeated Omicron exposures override ancestral SARS-CoV-2 immune imprinting

Affiliations

Repeated Omicron exposures override ancestral SARS-CoV-2 immune imprinting

Ayijiang Yisimayi et al. Nature. 2024 Jan.

Abstract

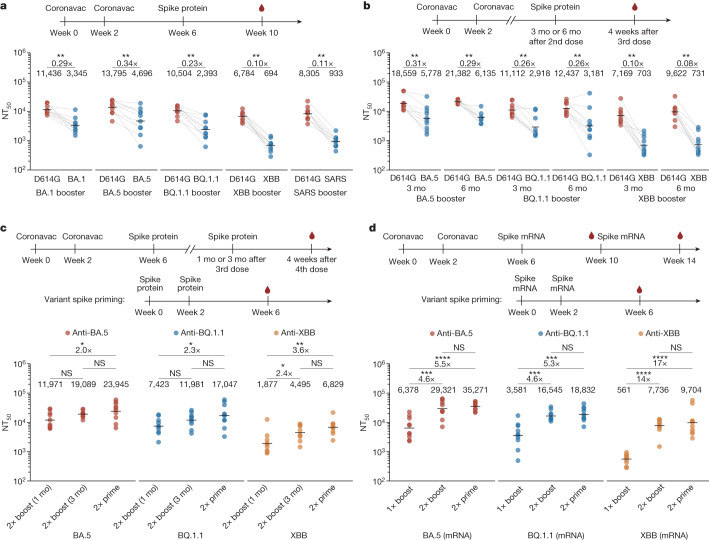
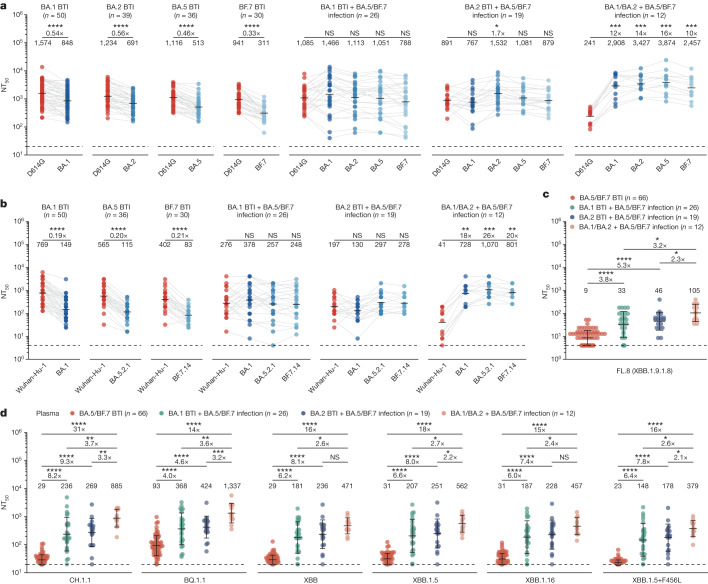
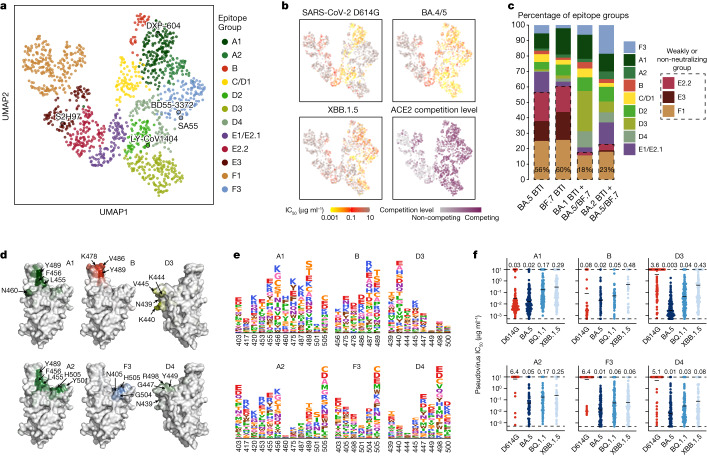
The continuing emergence of SARS-CoV-2 variants highlights the need to update COVID-19 vaccine compositions. However, immune imprinting induced by vaccination based on the ancestral (hereafter referred to as WT) strain would compromise the antibody response to Omicron-based boosters1-5. Vaccination strategies to counter immune imprinting are critically needed. Here we investigated the degree and dynamics of immune imprinting in mouse models and human cohorts, especially focusing on the role of repeated Omicron stimulation. In mice, the efficacy of single Omicron boosting is heavily limited when using variants that are antigenically distinct from WT-such as the XBB variant-and this concerning situation could be mitigated by a second Omicron booster. Similarly, in humans, repeated Omicron infections could alleviate WT vaccination-induced immune imprinting and generate broad neutralization responses in both plasma and nasal mucosa. Notably, deep mutational scanning-based epitope characterization of 781 receptor-binding domain (RBD)-targeting monoclonal antibodies isolated from repeated Omicron infection revealed that double Omicron exposure could induce a large proportion of matured Omicron-specific antibodies that have distinct RBD epitopes to WT-induced antibodies. Consequently, immune imprinting was largely mitigated, and the bias towards non-neutralizing epitopes observed in single Omicron exposures was restored. On the basis of the deep mutational scanning profiles, we identified evolution hotspots of XBB.1.5 RBD and demonstrated that these mutations could further boost the immune-evasion capability of XBB.1.5 while maintaining high ACE2-binding affinity. Our findings suggest that the WT component should be abandoned when updating COVID-19 vaccines, and individuals without prior Omicron exposure should receive two updated vaccine boosters.


Conflict of interest statement

X.S.X. and Y.C. are inventors on the provisional patent applications of BD series antibodies, which include BD55-5514 (SA55) and monoclonal antibodies from Omicron infection convalescents. X.S.X. and Y.C. are founders of Singlomics Biopharmaceuticals. The other authors declare no competing interests.

Figures

Fig. 1
Fig. 1. Humoral immune imprinting in mice.
a, NAb response after two doses of priming with CoronaVac followed by boosting with SARS-CoV-1 spike protein or SARS-CoV-2 variant spike proteins in mice. b, NAb response after 2 doses of CoronaVac priming followed by boosting with variant spike proteins with 3-month (mo) or 6-month time intervals in mice. a,b, The x-axis labels indicate NT50 values against the respective variants and the variants used for boosting are indicated at the bottom of the figure; fold differences in titres against variants compared with D614G are shown above the line. c, NAb response after priming with 2 doses of variant spike proteins or priming with 2 doses of CoronaVac followed by 2 boosts of variant spike proteins with 1-month or 3-month intervals in mice. d, NAb response after priming with two doses of variant spike mRNAs or priming with two doses of CoronaVac followed by two boosts of variant spike mRNAs. c,d, The variants used for priming or boosting are indicated at the bottom of the figure and red, blue, yellow circles indicate NT50 values for BA.5, BQ.1.1 and XBB. Ten mice were immunized and analysed in each group (n = 10) except in b eight mice were immunized with BA.5 booster 6 months after priming (n = 8). The dosage of CoronaVac, spike protein and spike mRNA were 3 μg, 10 μg and 1 μg, respectively. Sera were collected four weeks after the last dose. Geometric mean titres (GMTs) are shown. Two-tailed Wilcoxon signed-rank tests for paired samples in a,b and two-tailed Wilcoxon rank-sum tests for independent samples in c,d. *P < 0.05, **P < 0.01, ***P < 0.001, ****P < 0.0001; NS, not significant (P > 0.05). All neutralization assays were conducted as at least two independent experiments. Source Data
Fig. 2
Fig. 2. Humoral immune imprinting after repeated Omicron infections in humans.
a, Examination of immune imprinting after Omicron breakthrough infections and repeated infections. Plasma antibody titres against pseudotyped D614G and variants were measured. b, Plasma antibody titres against authentic variants. a,b, Fold changes in titres against variants compared with D614G or Wuhan-Hu-1 are displayed above the line, GMTs are shown; two-tailed Wilcoxon signed-rank test. c, Plasma antibody titres against authentic FL.8 (XBB.1.9.1.8). d, Plasma antibody breadth after one-time breakthrough infection and repeated Omicron infections. Plasma antibody titres against circulating pseudotyped variants were measured. c,d, Fold changes in titres between different cohorts are shown above the line; two-tailed Wilcoxon rank-sum tests. BA.1, BA.2, BA.5 and BF.7 BTI: post-vaccination BA.1, BA.2, BA.5 or BF.7 breakthrough infection. BA.1, BA.2 BTI + BA.5/BF.7 infection: post-vaccination either BA.1 or BA.2 breakthrough infection followed by BA.5/BF.7 reinfection. BA.1/BA.2 + BA.5/BF.7 infection: either BA.1 or BA.2 infection followed by BA.5/BF.7 reinfection with no SARS-CoV-2 vaccination history. BA.1 BTI, n = 50; BA.2 BTI, n = 39; BA.5 BTI, n = 36; BF.7 BTI, n = 30; BA.1 BTI + BA.5/BF.7 infection, n = 26; BA.2 BTI + BA.5/BF.7 infection, n = 19; BA.1/BA.2 + BA.5/BF.7 infection, n = 12. n refers to the number of individuals. Blood samples were collected 1–2 months after the last infection. Detailed information about the cohorts is presented in Supplementary Table 1. c,d, Data are GMT ± s.d. Dashed lines indicate the limit of detection (NT50 = 20 and NT50 = 4 for pseudovirus and authentic virus neutralization assays, respectively). All neutralization assays were conducted as at least two independent experiments.
Fig. 3
Fig. 3. B cell immune imprinting after repeated Omicron infections.
ad, Flow cytometry analysis of pooled B cells from individuals who had recovered from Omicron infection. BA.1 (top) and BA.2 (bottom) RBD double-positive CD20+IgMIgDCD27+ B cells were isolated for paired-single-cell V(D)J sequencing. Flow cytometry analyses were performed in cohorts of the following: 2 months after BA.1 (top) or BA.2 (bottom) breakthrough infections (a), 8 months after BA.1 (top) or BA.2 (bottom) breakthrough infections (b), 1 month after BA.5/BF.7 reinfection after BA.1 (top) and BA.2 (bottom) breakthrough infections (c), and 2–3 months after BA.5/BF.7 reinfection after BA.1 (top) or BA.2 (bottom) infection without SARS-CoV-2 vaccination history (d). APC, allophycocyanin; FITC, fluorescein isothiocyanate; PE, phycoerythrin; BV605, Brilliant Violet 605. e, Proportions of WT-binding and non-WT-binding antibodies from Omicron breakthrough infection and repeated Omicron infection cohorts. Binding specificity was determined by ELISA. The antibodies were expressed in vitro using the sequence of the RBD-binding memory B cells from various cohorts. f, The heavy-chain variable domain somatic hypermutation rate of the monoclonal antibodies (mAbs) from various cohorts. Two-tailed Wilcoxon rank-sum tests. Boxes indicate the 25th percentile, median and 75th percentile, and whiskers extend to median ± 1.5 times the interquartile range. Violin plots show kernel density estimation curves of the distribution. The numbers and ratios of samples in each group are labelled above the violin plots. g,h, The BA.1 (g) or BA.2 (h) pseudovirus-neutralizing ability (IC50) of monoclonal antibodies from various cohorts. Detection limit is denoted as a dashed line, and geometric mean is denoted as black bar. Geometric mean, fold changes and the number of antibodies are indicated above the plots. fh, Two-tailed Wilcoxon rank-sum tests.
Fig. 4
Fig. 4. Epitope distribution and characterization of monoclonal antibodies elicited by Omicron BTI and reinfection.
a, UMAP embedding of epitope groups of monoclonal antibodies binding BA.5 RBD isolated from convalescent individuals who experienced BA.5/BF.7 BTI or reinfection (n = 1,350). b, Neutralization activities, denoted as IC50 values, for SARS-CoV-2 D614G (n = 1,349), BA.4/5 (n = 1,322) and XBB.1.5 (n = 1,346) spike-pseudotyped VSV, and ACE2 competition determined by ELISA (n = 1,344), are projected onto the UMAP embedding space. c, Distribution of monoclonal antibodies across epitope groups is shown for BA.5 BTI, BF.7 BTI, BA.1 BTI with BA.5/BF.7 reinfection and BA.2 BTI with BA.5/BF.7 reinfection. Epitope groups predominantly comprising non-neutralizing or weakly neutralizing monoclonal antibodies (E2.2, E3 and F1) are highlighted with dashed boxes. The percentage of antibodies in these three groups is labelled on each bar. d, Average DMS escape scores of the crucial epitope groups contributing to neutralization against XBB.1.5 are indicated on the structure model of the SARS-CoV-2 BA.5 RBD (PDB: 7XNS). Key residues with high escape scores for each group are labelled. e, The average DMS escape scores for the key epitope groups are represented as sequence logos; residues are depicted using the standard one-letter code and coloured on the basis of their chemical properties. The height of each letter corresponds to the escape score of the respective mutation. f, Pseudovirus-neutralization activities of monoclonal antibodies in the six crucial epitope groups (A1 (n = 170), A2 (n = 60), B (n = 33), F3 (n = 129), D3 (n = 155) and D4 (n = 80); n refers to the number of monoclonal antibodies) are shown against SARS-CoV-2 D614G, BA.5, BQ.1.1 and XBB.1.5. Geometric mean IC50 values are displayed as bars and indicated above each group of data points.
Fig. 5
Fig. 5. Estimation of the evolutionary trends of XBB.1.5 RBD from DMS profiles.
a,b, Normalized average DMS escape scores weighted by IC50 against XBB.1.5 using DMS profiles of monoclonal antibodies from BA.5/BF.7 BTI (a), and monoclonal antibodies from BA.5/BF.7 BTI and BA.1/BA.2 BTI with BA.5/BF.7 reinfection (b). The effects of each mutation on ACE2 binding and RBD expression and the codon constraints on each residue are also considered (Methods). Residues with high estimated preferences are labelled, and their corresponding mutation scores are shown as logos.
Fig. 6
Fig. 6. Combination of escape mutations evades XBB.1.5-neutralizing antibodies from reinfection.
a, Generation of SARS-CoV-2 XBB.1.5-based pseudoviruses with combinations of critical mutations identified through analysis of DMS profiles. b, Human ACE2-binding affinity for various RBD mutants of SARS-CoV-2, assessed using SPR. Geometric mean dissociation constants (Kd) from at least four independent replicates are shown. P values for the comparison with the Kd for XBB.1.5 RBD were determined using a two-tailed t-test on log-transformed Kd values and are shown above the bars. n = 2 for BA.2.75; n = 6 for XBB.1.5 and XBB.1.5 + F456L; and n = 4 for other groups. c, IC50 values for representative potent XBB.1.5-neutralizing antibodies from different epitope groups against XBB.1.5 variants carrying individual or multiple escape mutations. Fold changes in IC50 against the mutants relative to XBB.1.5 are presented as a heat map. df, NT50 for SARS-CoV-2 XBB.1.5-based mutants, using plasma from convalescent individuals who experienced BA.5 or BF.7 reinfection: BA.1 BTI prior to BA.5/BF.7 reinfection (n = 26) (d); BA.2 BTI prior to BA.5/BF.7 reinfection (n = 19) (e); or reinfection with BA.5 or BF.7 after BA.1 or BA.2 infection without vaccination (n = 12) (f). Key mutations diminishing neutralization are labelled above the corresponding lines. Dashed lines indicate the limit of detection (NT50 = 20). GMTs are shown above data points. Statistical tests were performed between neighbouring mutants; two-tailed Wilcoxon signed-rank tests on paired samples.
Extended Data Fig. 1
Extended Data Fig. 1. Neutralizing antibody response after CoronaVac priming and one-dose variant spike boosting.
a, Comparison of neutralizing titers between mice immunized with one doses of BA.5/BQ.1.1/XBB Spike protein and mice with 2 doses of CoronaVac followed by one-dose Spike protein boosters. The variants used for priming or boosting are indicated at the bottom of the figure and red, blue, yellow circles indicate the NT50s against BA.5, BQ.1.1, and XBB. b, c, Comparison of neutralizing titers among different groups of mice immunized with 2 doses of CoronaVac followed by one-dose BA.5/BQ.1.1/XBB Spike protein boosters administered with one-month, three-month, or six-month intervals between the second and third dose. b) Neutralizing titers against D614G; c) Neutralizing titers against variants that the mice boosted with. The variants used for priming or boosting are indicated at the bottom of the figure and red, blue, yellow circles indicate the NT50s against BA.5, BQ.1.1, and XBB. 10 mice were immunized and analyzed in each group (n = 10), except in b,c eight mice were immunized with BA.5 booster 6 months after priming (n = 8), and all neutralization assays were conducted in at least two independent experiments. Sera were collected four weeks after the last dose. Geometric mean titers (GMT) were labeled. All neutralization assays were conducted in at least two independent experiments. Statistical significance was determined using the two-tailed Wilcoxon rank sum test. *p < 0.05, **p < 0.01, ***p < 0.001, ****p < 0.0001, and not significant (NS) p > 0.05. Source Data
Extended Data Fig. 2
Extended Data Fig. 2. Neutralizing antibody response after CoronaVac priming and two-dose variant spike booster or two-dose variant spike priming.
a, Comparison of neutralizing titers after CoronaVac priming and one-dose or two-dose variant spike boosting. b, D614G and boosting variant neutralizing titers after CoronaVac priming and two-dose variant spike boosting. c-d, Comparison of neutralizing titers after CoronaVac priming and variant spike protein or mRNA boosting. one-dose boosting in c and two-dose boosting in d. e, Neutralizing antibody titers after CoronaVac priming and one-dose or two dose variant spike mRNA boosters. f, Neutralizing antibody titers after two-dose variant spike mRNA or protein boosters. 10 mice were immunized and analyzed in each group (n = 10), and all neutralization assays were conducted in at least two independent experiments. Sera were collected four weeks after the last dose. Geometric mean titers (GMT) were labeled. All neutralization assays were conducted in at least two independent experiments. Statistical significance was determined using the two-tailed Wilcoxon rank sum test (a, c, d and f) or two-tailed Wilcoxon signed-rank test (b and e). *p < 0.05, **p < 0.01, ***p < 0.001, ****p < 0.0001, and not significant (NS) p > 0.05. Source Data
Extended Data Fig. 3
Extended Data Fig. 3. Antibody breadth of plasma after repeated Omicron infections.
a-d, Plasma antibody titers against pseudotyped D614G and variants after (a) BA.1 BTI + BA.5/BF.7 infection (n = 26), (b) BA.2 BTI + BA.5/BF.7 infection (n = 19), (c) BA.1/BA.2 + BA.5/BF.7 infection (n = 12), d) 8 month post BA.1 BTI (n = 22). ‘n’ refers to the number of individuals. Fold changes between titers against variants and D614G were calculated and shown above the line. Statistical significance was determined using the two-tailed Wilcoxon signed-rank test. *p < 0.05, **p < 0.01, ***p < 0.001, ****p < 0.0001, and not significant (NS) p > 0.05.
Extended Data Fig. 4
Extended Data Fig. 4. Neutralizing titers of nasal swabs after repeated Omicron infections.
a, Comparison of nasal swab neutralizing titers among repeated Omicron infection cohorts. Nasal swab antibody titers against pseudotyped variants were measured. Fold changes between titers of different cohorts were calculated and shown above the line. Statistical significance was determined using the two-tailed Wilcoxon rank sum test. Geometric mean ± SD are labeled. b-d, Nasal swab antibody titers against pseudotyped D614G and variants after (b) BA.1 BTI + BA.5/BF.7 infection (n = 26), (c) BA.2 BTI + BA.5/BF.7 infection (n = 19), (d) BA.1/BA.2 + BA.5 infection (n = 12). n’ refers to the number of individuals. Fold changes between titers against variants and D614G were calculated and shown above the line. Statistical significance was determined using the two-tailed Wilcoxon signed-rank test in (b-d). e, Comparison of nasal swab antibody titers against pseudotyped D614G and variants among one-time breakthrough infection and repeated infection cohorts. Statistical significance was determined using the two-tailed Wilcoxon rank sum test in (e). *p < 0.05, **p < 0.01, ***p < 0.001, ****p < 0.0001, and not significant (NS) p > 0.05.
Extended Data Fig. 5
Extended Data Fig. 5. Characteristics of BA.5-reactive mAbs elicited by BA.5/BF.7 BTI or reinfection.
a, Source of the antibodies are projected onto the UMAP embedding space. Antibodies from BA.5 BTI (n = 445), BF.7 BTI (n = 243), BA.1 BTI with reinfection (n = 284), and BA.2 BTI with reinfection (n = 232) are colored blue in the corresponding panel, and other antibodies are gray. b, Neutralization activities, denoted as IC50 values, against SARS-CoV-2 BA.1 (n = 1260), BA.2 (n = 1238), BA.2.75 (n = 1238), BQ.1.1 (n = 1335) and XBB (n = 1341) spike-pseudotyped VSV are projected onto the UMAP embedding space. c, Average escape scores of epitope groups that are not shown in Fig. 4d (C/D1, D2, E1/E2.1, E2.2, E3, and F1) are illustrated on the structure model of the SARS-CoV-2 BA.5 RBD (PDB: 7XNS). Key residues with high escape scores for each group are labeled. d, Average DMS escape scores for these epitope groups are represented as sequence logos; residues are depicted using the standard one-letter code and colored based on their chemical properties. The height of each letter corresponds to the escape score of the respective mutation. e, Pseudovirus-neutralization activities of XBB.1.5-neutralizing mAbs in groups A1 (n = 70, p < 0.0001) and A2 (n = 23, p < 0.0001) against XBB.1.5 and XBB.1.5.10; and mAbs in groups B (n = 15, p = 0.02) and C/D1 (n = 13, p = 0.001) against XBB.1.5 and XBB.1.16 (‘n’ refers to the number of mAbs). Fold changes in IC50 are labeled. P-values are calculated using two-tailed Wilcoxon signed-rank test of paired samples. f, Pseudovirus-neutralization activities of mAbs within the six crucial epitope groups (C/D1 [n = 76], D2 [n = 86], E1/E2.1 [n = 100], E2.2 [n = 124], E3 [n = 101], and F1 [n = 236], “n” refers to the number of mAbs) are shown against SARS-CoV-2 D614G, BA.5, BQ.1.1, and XBB.1.5. Geometric mean IC50 values are displayed as bars and labeled above each group of data points.
Extended Data Fig. 6
Extended Data Fig. 6. Workflow of calculating weighted escape scores of each mutation on RBD.
Weights for ACE2 binding and RBD expression, neutralization activity, and codon usage are sequentially applied on the calculation to achieve informative results. Mutation preferences of BA.5 RBD under the pressure of NAbs from BA.5 or BF.7 BTI are shown.
Extended Data Fig. 7
Extended Data Fig. 7. SPR sensorgrams for affinity of hACE2 and SARS-CoV-2 mutants RBD.
Representative sensorgram of at least four replicates is shown for each RBD. Geometric mean kinetic constants ka, kd, and dissociation equilibrium constant KD are labeled in each panel.
Extended Data Fig. 8
Extended Data Fig. 8. NAbs from BTI and reinfection are escaped by constructed mutants.
a, IC50 values for representative potent XBB.1.5-neutralizing antibodies from different epitope groups against XBB.1.5 variants carrying individual or multiple escape mutations are shown. The order of antibodies is the same as that in Fig. 6c. b, Pseudovirus NT50 for SARS-CoV-2 XBB.1.5-based mutants are shown using plasma from convalescent individuals who experienced BA.5 (n = 36) or BF.7 BTI (n = 30). Statistical tests are performed between neighboring mutants. P-values are calculated using two-tailed Wilcoxon signed-rank tests on paired samples. *p < 0.05, **p < 0.01, ****p < 0.0001, and p > 0.05 (NS).

References

    1. Kurhade C, et al. Low neutralization of SARS-CoV-2 Omicron BA.2.75.2, BQ.1.1 and XBB.1 by parental mRNA vaccine or a BA.5 bivalent booster. Nat. Med. 2023;29:344–347. doi: 10.1038/s41591-022-02162-x. - DOI - PubMed
    1. Park YJ, et al. Imprinted antibody responses against SARS-CoV-2 Omicron sublineages. Science. 2022;378:619–627. doi: 10.1126/science.adc9127. - DOI - PubMed
    1. Cao Y, et al. Imprinted SARS-CoV-2 humoral immunity induces convergent Omicron RBD evolution. Nature. 2023;614:521–529. - PMC - PubMed
    1. Kaku CI, et al. Evolution of antibody immunity following Omicron BA.1 breakthrough infection. Nat. Commun. 2023;14:2751. doi: 10.1038/s41467-023-38345-4. - DOI - PMC - PubMed
    1. Davis-Gardner ME, et al. Neutralization against BA.2.75.2, BQ.1.1, and XBB from mRNA Bivalent Booster. N. Engl. J. Med. 2022;388:183–185. doi: 10.1056/NEJMc2214293. - DOI - PMC - PubMed

Supplementary concepts