. 2023 Dec;624(7990):130-137.
doi: 10.1038/s41586-023-06758-2. Epub 2023 Nov 22.

Sequential appetite suppression by oral and visceral feedback to the brainstem

Affiliations

Sequential appetite suppression by oral and visceral feedback to the brainstem

Truong Ly et al. Nature. 2023 Dec.

Abstract

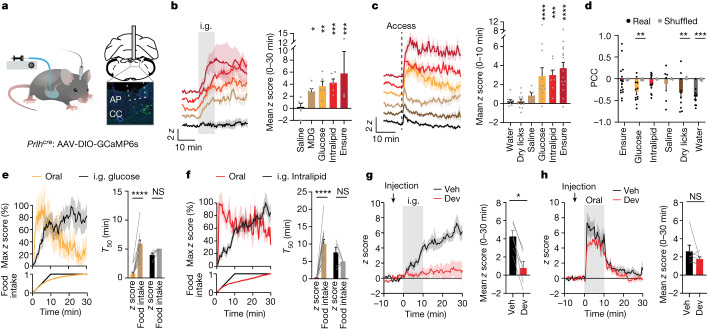
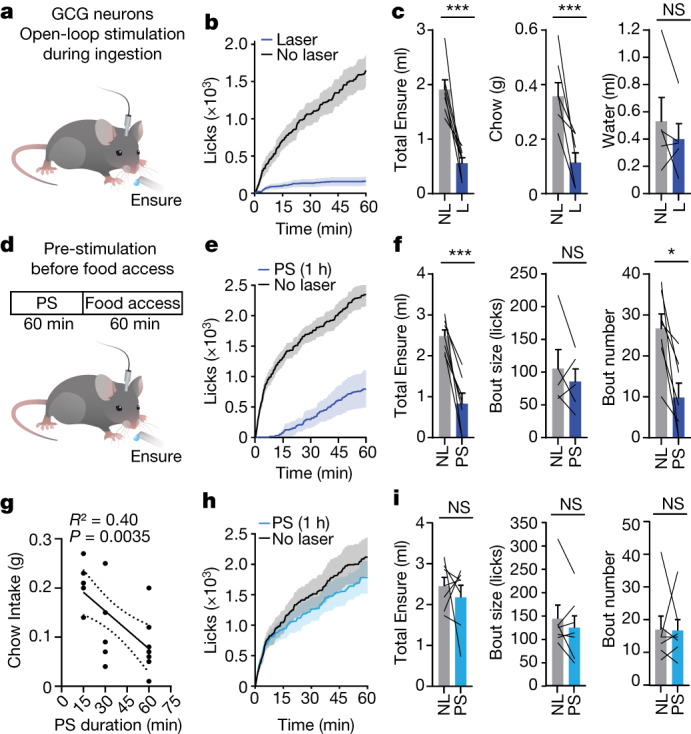
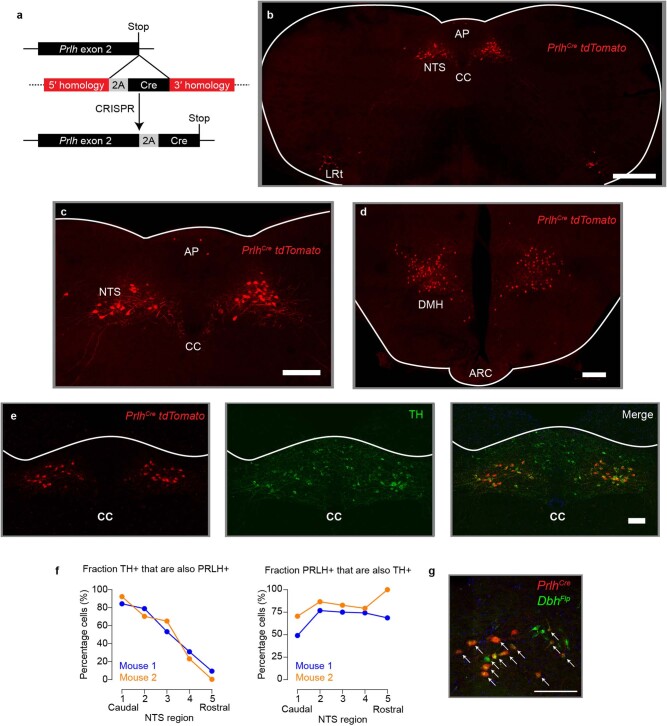
The termination of a meal is controlled by dedicated neural circuits in the caudal brainstem. A key challenge is to understand how these circuits transform the sensory signals generated during feeding into dynamic control of behaviour. The caudal nucleus of the solitary tract (cNTS) is the first site in the brain where many meal-related signals are sensed and integrated1-4, but how the cNTS processes ingestive feedback during behaviour is unknown. Here we describe how prolactin-releasing hormone (PRLH) and GCG neurons, two principal cNTS cell types that promote non-aversive satiety, are regulated during ingestion. PRLH neurons showed sustained activation by visceral feedback when nutrients were infused into the stomach, but these sustained responses were substantially reduced during oral consumption. Instead, PRLH neurons shifted to a phasic activity pattern that was time-locked to ingestion and linked to the taste of food. Optogenetic manipulations revealed that PRLH neurons control the duration of seconds-timescale feeding bursts, revealing a mechanism by which orosensory signals feed back to restrain the pace of ingestion. By contrast, GCG neurons were activated by mechanical feedback from the gut, tracked the amount of food consumed and promoted satiety that lasted for tens of minutes. These findings reveal that sequential negative feedback signals from the mouth and gut engage distinct circuits in the caudal brainstem, which in turn control elements of feeding behaviour operating on short and long timescales.


Conflict of interest statement

The authors declare no competing interests.

Figures

Fig. 1
Fig. 1. PRLH neurons show different responses to oral ingestion compared with i.g. infusion.
a, Left, schematic of fibre photometry during i.g. infusions. Right, image of fibre placement and GCaMP6s expression in PRLH neurons. AP, area postrema; CC, central canal. b, Left, peri-stimulus time histogram (PSTH) of PRLH neuron responses for i.g. infusions (0–30 min, 1.5 ml) of indicated solutions (colours per the graph on the right). Right, z scores (0–30 min). Statistical comparisons are relative to the baseline prior to infusion. c, Left, PRLH neuron responses aligned to lickometer access for self-paced consumption (colours per the graph on the right). Right, z scores (0–10 min). d, PCC for the cumulative licks performed for each tastant compared with the z-scored change in activity across the 30-min trial. Real data (R; colour) are compared with shuffled controls (S; grey). e, Left, the percentage of maximum z scores during oral ingestion (orange) or i.g. infusion (black) of glucose (1.5 ml). The percentage of total intake is shown on the bottom. Right, the time to reach 50% of the maximum z-score plotted adjacent to the time required to consume 50% of total glucose (food intake, brown) or receive 50% of the total i.g. infusion (food intake, grey). f, As in e, except that data are for oral (red) versus i.g. Intralipid (black). g, Left, PRLH neuron responses to Intralipid i.g. infusion (0–10 min, 1.5 ml) after an i.p. injection of devazepide (Dev) or vehicle (Veh). Right, z scores (0–30 min). h, Left, PRLH neuron responses for Intralipid oral consumption after an i.p. injection of devazepide or vehicle. Right, z scores (0–30 min). NS, not significant, *P < 0.05, **P < 0.01, ***P < 0.001, ****P < 0.0001. Data are the mean ± s.e.m. Statistics are shown in Supplementary Table 1.
Fig. 2
Fig. 2. PRLH neurons track the dynamics of ingestion.
a, Example traces of calcium dynamics of PRLH neurons during self-paced Ensure consumption. The lick rate is shown below. b, PCC for the relationship between the cumulative licks performed in the preceding time interval (indicated by red bars) and the z-scored change in activity during Ensure consumption. c, Left, PRLH neuron responses aligned to the first lick of the bout for Ensure consumption. Right, time constant (tau) when 63.8% of the z-scored activity change is reached. d, Left, PRLH neuron responses aligned to the last lick of the bout for Ensure consumption. Right, time constant (lambda) when the z score has decayed to 37% of its value during the last lick of the bout. e, Example traces of calcium dynamics during consumption of the indicated solutions or dry licking at an empty sipper. Dashed line indicates sipper access. f, PRLH neuron activity aligned to the first lick for all tastants (colours per the graph on the right). Right, response (0–10 s) after the first lick. g, PCC for the relationship between the instantaneous lick rate during consumption and the z-scored change in activity. Statistical comparisons are between real and shuffled data. h, Left, scatterplot for bout size versus the z score for all bouts during Intralipid, glucose or water consumption. Right, slope for Intralipid, glucose and water consumption. i, The z score per lick stratified by bout size for each animal. j, A GLM was constructed for each animal using subsets of variables (n = 10 mice). See Methods for details. Adjusted R2 (black line) is plotted against the shuffled controls (grey line). k, Contribution of individual variables to the variance explained (R2) by the best model. l, Examples of a predicted z-score trace using the GLM versus the actual z-score trace during Ensure or water consumption. *P < 0.05, **P < 0.01, ***P < 0.001, ****P < 0.0001. Data are the mean ± s.e.m. Statistics are shown in Supplementary Table 1.
Fig. 3
Fig. 3. PRLH neurons are activated by the taste of food.
a, Taste impairments in taste-blind Trpm5−/− mice. b, Left, PRLH neuron responses aligned to i.p. injection of CCK in Trpm5−/− mice and WT controls. Right, z scores (0–30 min). c, Left, PRLH neuron responses across all glucose lick bouts in WT and Trpm5−/− mice. Right, z scores (0–10 s). d, Left, PRLH neuron responses across all sucralose lick bouts in WT and Trpm5−/− mice. Right, z scores (0–10 s). e, Top, schematic of microendoscopy imaging of PRLH neurons in a freely moving, head-fixed or head-fixed and restrained mouse. Bottom, example trace of movement artefacts detected using Mosaic analysis software in each configuration during imaging. f, Heatmap of individual neuron responses to the first bout of brief access (5 s) of Ensure consumption. g, Percentage of neurons activated by all four bouts, only three bouts, only two bouts or only-lick bout during Ensure consumption. h, PRLH neuron responses aligned to brief access consumption of Intralipid, sucralose and water (averaged across all neurons). i, PRLH neuron responses aligned to the first lick of all lick bouts (averaged across all lick bouts and neurons). j, Population-weighted z score (calculated as the fraction of neurons activated multiplied by their z-scored activity change) for consumption of the indicated solutions. The percentage of neurons activated are listed above each bar. Statistical comparisons are relative to consumption of water. k, Example traces of calcium dynamics in representative neurons during consumption of the indicated solutions (colours per j). l, Example traces of calcium dynamics in representative neurons responding to sucralose consumption, a CCK injection, both stimuli or neither. m, Left, scatterplot of z scores during brief access sucralose consumption (averaged across all lick bouts) versus z scores after CCK injection. Right, Venn diagram showing the percentage of cells activated by these stimuli. *P < 0.05, **P < 0.01, ***P < 0.001, ****P < 0.0001. Data are the mean ± s.e.m. Statistics are shown in Supplementary Table 1.
Fig. 4
Fig. 4. PRLH neurons pace food ingestion.
a, Schematic of closed-loop optogenetic stimulation or silencing of PRLH neurons expressing ChR2 or GtACR1. b, Left, Ensure consumption during closed-loop optogenetic stimulation (60-min trial) of PRLH neurons expressing ChR2 in either laser (L) or no laser (NL) trials. Middle, bout size (licks). Right, bout number. c, Left, Ensure consumption during closed-loop silencing (60 min) of PRLH neurons expressing GtACR1 in either laser or no laser trials. Middle, bout size. Right, bout number. d, Distribution of bout sizes (bins are 25 lick increments) for trials in which PRLH neurons received closed-loop silencing (top) or no laser trials (bottom). e, Schematic for two-bottle preference test in which animals are presented with two identical bottles containing Ensure. Day 1 establishes initial preference. On day 2, the preferred or less preferred bottle is paired with optogenetic stimulation or silencing, respectively. The pairing is switched on day 3. f, Cumulative licks of Ensure for the preferred (bottle 1) versus the non-preferred (bottle 2) bottle on days 1–3. g, Preference ratio for bottle 1 (licks from bottle 1/total licks) and total Ensure consumption (licks from bottle 1 + licks from bottle 2) from days 1 to 3 of the closed-loop stimulation paradigm. Statistical comparisons are relative to day 1. h, Preference ratio for bottle 1 and total Ensure consumption from days 1 to 3 of the closed-loop silencing paradigm. *P < 0.05, **P < 0.01, ***P < 0.001, ****P < 0.0001. Data are the mean ± s.e.m. Statistics are shown in Supplementary Table 2. Genotype controls (no opsin or Cre ± laser) for all experiments are shown in Extended Data Fig. 7.
Fig. 5
Fig. 5. GCG neurons track cumulative intake on a timescale of minutes.
a, Left, PRLH (grey) and GCG (red) neuron responses during the first lick bout. Right, z scores (0–5 s after the first lick in the first bout) Statistical comparisons are relative to the baseline prior to licking. b, Left, GCG neuron responses aligned to lickometer access for all tastants. Right, z scores (0–30 min). c, Mice were given access to Ensure at defined time intervals. Left, example trace of calcium dynamics from GCG neurons during 5 s of access to Ensure every 60 s (10 trials). Right, z scores during each brief access (0–5 s) versus the number of trials. d, Left, example trace of calcium dynamics from GCG neurons during 60 s of brief access to Ensure every 2 min (10 trials) with 60-s interbout. Same animal from c. Right, z scores during each brief access (0–60 s) versus the number of trials. e, Left, GCG neuron responses in mice given access to chow or a HFD from 0 to 10 min (grey). Right, correlation between total food intake during 10 min of access (kcal) and post-ingestive activity. Post-ingestive activity = mean z score after food removal (10–30 min)/mean z score during food access (0–10 min). f, Left, PRLH neuron responses in mice given access to chow or a HFD (0–10 min). Right, correlation between total food intake during 10 min of access (kcal) and post-ingestive activity. *P < 0.05, **P < 0.01, ***P < 0.001, ****P < 0.0001. Data are the mean ± s.e.m. Statistics are shown in Supplementary Table 1.
Fig. 6
Fig. 6. GCG neuron activation promotes long-lasting satiety.
a, Schematic of experiment. Mice received continuous stimulation of GCG neurons expressing ChR2. b, Cumulative licks of Ensure during open-loop stimulation (60 min) of GCG neurons. c, Left, Ensure consumption in b. Middle, chow consumption during open-loop stimulation (30 min; food-deprived mice). Right, water consumption during open-loop stimulation (30 min; water-deprived mice). d, Schematic of experiment. Mice were pre-stimulated (PS) in the absence of food (60 min) and then given access to Ensure (60 min). e, Cumulative licks of Ensure after pre-stimulation (60 min) of GCG neurons. f, Left, Ensure consumption in e. Middle, bout size (two animals consumed zero bouts after pre-stimulation and therefore were not included for bout size analysis). Right, bout number. g, Negative correlation between total chow intake after pre-stimulation and the pre-stimulation duration. h, Cumulative licks of Ensure after pre-stimulation (60 min) of PRLH neurons. i, Left, Ensure consumption in h. Middle, bout size. Right, bout number. *P < 0.05, **P < 0.01, ***P < 0.001, ****P < 0.0001. Data are mean ± sem. Statistics are shown in Supplementary Table 2. Genotype controls (no opsin or Cre ± laser) for all experiments are shown in Extended Data Fig. 10.
Extended Data Fig. 1
Extended Data Fig. 1. PRLH and GCG neurons are distinct cNTS cell types that regulate the non-aversive suppression of feeding.
a, Unique cell types in the dorsal vagal complex (DVC) identified by single-cell RNA sequencing (Data are adapted from Ludwig et al. 2021) that are known to regulate feeding. Prlh and Gcg expression label distinct cell types that are known to control the non-aversive suppression of feeding. b, Table describing where glutamatergic, GABAergic, and cholinergic cell types identified by single-cell sequencing are found in the DVC. AP = area postrema. DMV = dorsal motor vagus. c, Schematic showing overlap in RNA expression between cell types that express Dbh, Th, Calcr, Prlh, Lepr, and Gcg based on data from panel a. These cell types have been shown to be activated by natural feeding and/or suppress food intake without inducing conditioned taste aversion (CTA). d, Schematic showing the location of cell types – which regulate non-aversive satiety – within the DVC based on data from panel b. Cells expressing Prlh (“PRLH neurons”) and Gcg (“GCG neurons”) are specifically located in the NTS, whereas other cell types show broad expression in the AP and DMV.
Extended Data Fig. 2
Extended Data Fig. 2. PRLH neurons largely overlap with TH neurons in the cNTS.
a, Schematic for generating PrlhCre knock-in mice. b, Coronal slice at the level of the area postrema (AP) showing PrlhCre recombination. The AP, central canal (CC), NTS, and the lateral reticular formation (LRt) are labelled. The recombination pattern here and in the next panel (DMH) closely matches published reports of PRLH expression. Scale bar = 500 µm. c, Zoom-in of AP/NTS. Scale bar = 200 µm. d, Recombination in the dorsomedial hypothalamus (DMH). The arcuate nucleus (ARC) is labelled for reference. Scale bar = 200 µm. e, PrlhCre recombination (red) and immunohistochemistry for tyrosine hydroxylase (TH) in the NTS at the level of the AP. This shows extensive co-localization, consistent with reports that PRLH and A2 neurons are overlapping in the cNTS. Scale bar = 100 µm. f, Co-localization between PRLH and TH across the rostrocaudal axis of the cNTS. Each region corresponds to 200 µm between −6.5 mm to −7.5 mm relative to bregma. g, Prlh and Dbh are co-localized in the cNTS. PrlhCre and DbhFlp mice were crossed to reporter mice to co-label neurons (Methods). Scale bar = 50 µm.
Extended Data Fig. 3
Extended Data Fig. 3. Regulation of PRLH neurons by ingestive and non-ingestive signals.
a, Mean chow consumption (g) after open-loop stimulation (30 min; food-deprived mice) of PRLH neurons or no laser trials for ChR2-expressing mice or control mice. b, Left, mean Ensure consumption (mL) after open-loop stimulation (60 min; dark phase) of PRLH neurons or no laser trials. Middle, mean bout size (licks) after open-loop stimulation. Right, mean bout number after open-loop stimulation. c, Mean water consumption (mL) after open-loop stimulation (30 min; water-deprived) of PRLH neurons or no laser trials. d, Mean Pearson Correlation Coefficient (PCC) for the cumulative infusion volume vs. the z-scored change in activity during infusions. Real data (color) is compared vs. shuffled controls (gray). e, PSTH of PRLH neuron responses during just the first lick bout of the trial for the indicated solutions. f, Mean time to 50% of maximum z-score (T50) over the entire 30 min trial during oral ingestion of glucose or Intralipid. g, Mean z-scores (0–30 min) after lickometer access to tastants. h, Mice were fasted overnight before given access to Intralipid for 10 min of self-paced consumption (day 1). Two days later (day 2), fasted mice were given an IG infusion of Intralipid based on the amount consumed on day 1. i, Left, PSTH of PRLH neuron responses to volume-matched oral ingestion or IG infusion of Intralipid. Right, mean z-scores during oral ingestion or IG infusion (0–10 min) or post-ingestion (10–30 min). j, Left, PTSH of the percentage of max z-score during oral ingestion (red) or IG infusion (black) of Intralipid (volume-matched), with the percentage of total intake on the bottom panel. Right, mean time to reach 50% of the max z-score (”z-score”) versus mean time to consume 50% of total Intralipid (“food intake”) for oral ingestion (red) and IG infusion (black). k, Top, PSTH of PRLH neuron responses during self-paced chow or HFD consumption, or presentation of a non-food object (black), aligned to moment of food presentation. Bottom, cumulative fraction of total bites during the trial. l, Left, mean z-scores (0–10 min) after food/object access. Right, mean z-scores (0–30 min) after food/.object access. m, Mean time to reach 50% of the max z-score (“z-score”) versus mean time to consume 50% of total bites (“food intake”) for chow (brown) and HFD (blue). n, Left, mean time to 50% of maximum z-score (T50) over the entire 30 min trial during oral ingestion of chow or HFD. Right, mean percentage of total bites (“meal”) performed at the earliest time point with >50% of the max z-score (T50). o, Mean PCC for the relationship between the cumulative bites of chow or HFD and the z-scored change in activity across the entire 30 min trial. p, Example trace of calcium dynamics from PRLH neurons during chow consumption (individual bites are shown in gray). q, Example trace of calcium dynamics from PRLH neurons during HFD consumption (individual bites are shown in gray). r, Left, PSTH of PRLH neuron responses to IP injection of 5-HT, CCK, amylin, Exendin-4, PYY, calcitonin, ghrelin, and saline. Right, mean z-scores (0–30 min) after IP injection of each gut peptide. s, Devazepide pretreatment does not change total Intralipid consumption in PrlhCre mice (from Fig. 1l). t, Left, PSTH of PRLH neuron responses to tail suspension. Right, mean z-scores (0–60 s) during tail suspension. u, Left, PSTH of PRLH neuron responses to presentation of a same-sex mouse intruder. Right, mean z-scores (0–3 min) during intruder presentation. v, Left, PSTH of PRLH neuron responses to IP injection of LiCl (84 mg/kg) or LPS (100 ug/kg). Right, mean z-scores (0–30 min) after IP injection of LiCl or LPS. NS, *P < 0.05, **P < 0.01, ***P < 0.001, ****P < 0.0001. Data are mean ± sem. Statistics are shown in Supplementary Table 1.
Extended Data Fig. 4
Extended Data Fig. 4. PRLH neurons track the moment-to-moment dynamics of ingestion.
a, Left, PSTH of PRLH neuron activity aligned to the first lick of all lick bouts from overnight fasted mice (“fasted”) or ad libitum fed mice (“fed”) during a 30 min Ensure consumption test. Right, mean z-scores (0–10 s after first lick in bout) from fasted and fed mice. b, Left, PSTH of PRLH neuron activity aligned to the first lick of all lick bouts in the first 15 min of the trial (“early”) or the last 15 min of the trial (“late”) during a 30 min Ensure consumption test. Right, mean z-scores (0–10 s after first lick in bout) from early and late time intervals. c, Left, mean z-score per lick from Ensure consumption during early (first 15 min) vs. late (last 15 min) periods of a 30 min trial. Right, mean z-score per lick during Ensure consumption from overnight fasted (“fasted”) or ad libitum fed animals. d, Left, mean z-score per lick from Intralipid consumption during early (first 15 min) vs. late (last 15 min) periods of a 30 min trial. Right, mean z-score per lick from glucose consumption during early (first 15 min) vs. late (last 15 min) periods of a 30 min trial. e, Left, mean z-score per lick from saline consumption during early (first 15 min) vs. late (last 15 min) periods of a 30 min trial. Middle, mean z-score per lick from dry licking during early (first 15 min) vs. late (last 15 min) periods of a 30 min trial. Right, mean z-score per lick from water consumption during early (first 15 min) vs. late (last 15 min) periods of a 30 min trial. f, Left, PSTH of PRLH neuron responses during feeding tube insertion into the esophagus (0–30 s). Right, mean z-scores (0–30 s) during feeding tube insertion. g, Top, mean z-score for each bout of Ensure consumption (0–10 s) from the first bout (left) to the last bout (right), with the percentage of the max bout size (licks) shown below. Bottom, mean z-score for each bout of saline consumption (0–10 s) from the first bout to the last bout. h, Top, mean z-score for each bout of Intralipid consumption (0–10 s) from the first bout to the last bout. Bottom, mean z-score for each bout of dry licking (0–10 s) from the first bout to the last bout. i, Top, mean z-score for each bout of glucose consumption (0–10 s) from the first bout to the last bout. Bottom, mean z-score for each bout of water consumption (0–10 s) from the first bout to the last bout. j, Left, scatterplot showing the relationship between bout size (# of licks in the first 10 s of each bout) and mean z-score (0–10 s of each bout) for all bouts during Intralipid, glucose, or saline consumption. Each dot represents a single lick bout. Right, scatterplot showing the relationship between bout size and mean z-score for all bouts during Intralipid or glucose consumption, or dry licking at an empty bottle. k, The mean squared error (MSE) is plotted for each model after performing cross-validation. To perform cross-validation, 80% of the data was used to train the GLM coefficients and calculate the MSE from the remaining 20% of the data. This was performed for 100 iterations to obtain an average MSE value for each animal. NS, *P < 0.05, **P < 0.01, ***P < 0.001, ****P < 0.0001. Data are mean ± sem. Statistics are shown in Supplementary Table 1.
Extended Data Fig. 5
Extended Data Fig. 5. PRLH neurons are activated by food tastes.
a, Example trace of calcium dynamics from PRLH neurons during sucralose consumption. b, Left, PSTH of PRLH neuron activity aligned to the first lick of all lick bouts during sucralose or glucose consumption. Right, mean response (0–10 s after first lick) averaged across all lick bouts for sucralose and glucose consumption. c, Mean z-score per lick stratified by bout size for sucralose and glucose consumption. d, Left, PSTH of PRLH neuron responses to sucralose or glucose consumption. Middle, mean z-scores (0–10 min) during sucralose or glucose consumption. Right, mean z-scores (0–30 min) during sucralose or glucose consumption. e, Scatterplot showing the relationship between bout size (# of licks in the first 10 s of each bout) and mean z-score (0–10 s of each bout) for all bouts during sucralose or glucose consumption. f, Mean PCC for the relationship between the instantaneous lick rate each second during consumption of sucralose or glucose and the z-scored change in activity across the entire 30 min trial. g, Mean z-score for each bout of sucralose consumption (0–10 s) from the first bout (left) to the last bout (right), with the percentage of the max bout size (licks) shown below. h, Left, PSTH of PRLH neuron responses to IG infusion of sucralose (1.5 mL). Right, mean z-scores (0–30 min) during IG infusion of sucralose. i, Fiber placement and GCaMP6s expression in PRLH neurons of a Trpm5−/− mouse. j, Left, example trace of calcium dynamics from PRLH neurons during glucose consumption from a naïve Trpm5−/− mouse. Right, Left, example trace from a learned Trpm5−/− mouse. k, Mean z-score per lick stratified by bout size for glucose consumption in WT and Trpm5−/− mice. l, Scatterplot showing the relationship between bout size (# of licks in the first 10 s of each bout) and mean z-score (0–10 s of each bout) for all bouts during glucose consumption from WT and Trpm5−/− mice. m, Mean cumulative licks performed during a glucose consumption test by naive and learned Trpm5−/− mice. Animals were defined as “learned” if they performed at least 1000 licks during the second test (Methods). n, PSTH of PRLH neuron responses across all glucose lick bouts in naive and learned Trpm5−/− mice. o, Mean z-score per lick for glucose consumption in naive and learned Trpm5−/− mice. p, Example trace of calcium dynamics from PRLH neurons during sucralose consumption from a Trpm5−/− mouse. Q, Mean z-score per lick stratified by bout size for sucralose consumption in WT and Trpm5−/− mice. R, Scatterplot showing the relationship between bout size and mean z-score for all bouts during sucralose consumption from WT and Trpm5−/− mice. S, Example trace of calcium dynamics from PRLH neurons during Intralipid consumption from a Trpm5−/− mouse. T, Left, PSTH of PRLH neuron responses across all Intralipid lick bouts in WT and Trpm5−/− mice. Right, mean z-scores (0–10 s) for all lick bouts during Intralipid consumption. U, Mean z-score per lick stratified by bout size for Intralipid consumption in WT and Trpm5−/− mice. V, Left, scatterplot showing the relationship between bout size and mean z-score for all bouts during Intralipid consumption from WT and Trpm5−/− mice. W, mean slope (coefficient x1) for glucose, sucralose, and Intralipid consumption from WT and Trpm5−/− mice. NS, *P < 0.05, **P < 0.01, ***P < 0.001, ****P < 0.0001. Data are mean ± sem. Statistics are shown in Supplementary Table 1.
Extended Data Fig. 6
Extended Data Fig. 6. Individual PRLH neurons are activated by food tastes.
a, GRIN lens placement and GcaMP6s expression in PRLH neurons. b, PSTH of PRLH neuron responses during the first lick bout of the trial for the indicated solutions. c, Left, PTSH of activated PRLH neurons (mean z-score > 1 across all 5 s bouts) during Ensure consumption from Fig. 3. Right, PTSH of non-responsive PRLH neurons (mean z-score <1 across all 5 s bouts). d, Percentage of activated and non-responsive neurons during each Ensure lick bout. e, Mean z-score for each 5 s bout during Ensure consumption. Each data point is the averaged value from a single animal. f, Left, heatmap of individual neuron responses to the first bout of Intralipid consumption. Right, heatmap of individual neuron responses to brief access (5 s) Intralipid consumption at 5 min intervals over 20 min. Bottom, PTSH aligned to brief access Intralipid consumption (averaged across all neurons). g, Left, PTSH of activated PRLH neurons (mean z-score > 1 across all 5 s bouts) during Intralipid consumption from Fig. 3. Right, PTSH of non-responsive PRLH neurons (mean z-score <1 across all 5 s bouts). h, Percentage of activated and non-responsive neurons during each Intralipid lick bout. i, Mean z-score for each 5 s bout during Intralipid consumption. j, Left, heatmap of individual neuron responses to the first bout of sucralose consumption. Right, heatmap of individual neuron responses to brief access (5 s) sucralose consumption. Bottom, PTSH aligned to brief access sucralose consumption (averaged across all neurons). k, Left, PTSH of activated PRLH neurons (mean z-score > 1 across all 5 s bouts) during sucralose consumption from Fig. 3. Right, PTSH of non-responsive PRLH neurons (mean z-score <1 across all 5 s bouts). l, Percentage of activated and non-responsive neurons during each sucralose lick bout. m, Mean z-score for each 5 s bout during sucralose consumption. n, Left, heatmap of individual neuron responses to the first bout of water consumption. Right, heatmap of individual neuron responses to brief access (5 s) water consumption. Bottom, PTSH aligned to brief access water consumption (averaged across all neurons). o, Left, PTSH of activated PRLH neurons (mean z-score > 1 across all 5 s bouts) during water consumption from Fig. 3. Right, PTSH of non-responsive PRLH neurons (mean z-score <1 across all 5 s bouts). p, Percentage of activated and non-responsive neurons during each water lick bout. q, Mean z-score for each 5 s bout during water consumption. r, Left, percentage of neurons activated by all four bouts, three bouts, two bouts, or only one lick bout for Ensure consumption. Right, percentage of neurons activated by all four bouts, three bouts, two bouts, or only one lick bout for Intralipid consumption. s, Heatmap of individual neuron responses to brief access sucralose consumption before an IP injection of CCK. NS, *P < 0.05, **P < 0.01, ***P < 0.001, ****P < 0.0001. Data are mean ± sem. Statistics are shown in Supplementary Table 1.
Extended Data Fig. 7
Extended Data Fig. 7. PRLH neurons pace food ingestion by modulating valence associated with food tastes.
This figure extends the data from Fig. 4 by showing, for each experiment, the response of genetic controls (”controls” – mice that lack opsin or Cre expression) to the given laser stimulation protocol. The data from opsin-expressing mice (”ChR2” or “GtACR”) are also reproduced here to enable direct comparison with controls. a, Fiber placement and ChR2-GFP expression in PRLH neurons of the cNTS. b, Left, mean Ensure consumption (mL) after closed-loop stimulation (60 min; dark phase) of PRLH neurons (when animals are licking) or sham trials. Middle, mean bout size (licks) after closed-loop stimulation. Right, mean bout number after closed-loop stimulation. Example raster plots from three animals showing individual licks of Ensure. c, Left, mean Ensure consumption (mL) during closed-loop stimulation (60 min; dark phase feeding) of PRLH neurons (when animals are not licking) or no laser trials. Middle, mean bout size (licks) during closed-loop stimulation. Right, mean bout number during closed-loop stimulation. d, Mean number of laser pulses received by individual animals receiving closed-loop stimulation during licking or when not actively licking. e, Fiber placement and GtACR1-FusionRed expression in PRLH neurons of the cNTS. f, Left, mean Ensure consumption (mL) during closed-loop silencing (60 min; dark phase feeding) of PRLH neurons or no laser trials. Middle, mean bout size (licks) during closed-loop silencing. Right, mean bout number during closed-loop silencing for Ensure consumption. g, Left, mean bout duration (s) during closed-loop silencing. Left, distribution of bout durations (bins are 5 s) for trials in which PRLH neurons received closed-loop silencing (top) or no laser trials (bottom). h, Left, mean Intralipid consumption (mL) during closed-loop silencing (60 min; dark phase feeding) of PRLH neurons or no laser trials. Middle, mean bout size (licks) during closed-loop silencing. Right, mean bout number during closed-loop silencing. i, Probability mass function (PMF) for interlick interval (ILI) between 0-1 s during closed-loop silencing of PRLH neurons or no laser trials (Ensure consumption). j, Left, mean values for mu1 constant (left peak on PMF). Right, mean values for mu2 constant (right peak on PMF). k, Probability mass function (PMF) for interlick interval (ILI) between 0-1 s during closed-loop silencing of PRLH neurons or no laser trials (Intralipid consumption). l, Left, mean values for mu1 constant (left peak on PMF). Right, mean values for mu2 constant (right peak on PMF). m, Preference ratio for bottle 1 (licks from bottle 1/licks from bottle 1 + licks from bottle 2) from day 1–3 of closed-loop stimulation paradigm (when animals are licking). n, Total Ensure consumption (licks from bottle 1 + licks from bottle 2) from day 1–3 of closed-loop stimulation paradigm. o, Left, mean number of licks for bottle 1 and bottle 2 from day 1–3 of closed-loop stimulation paradigm (Ensure consumption). Middle, mean bout size (licks) for bottle 1 and 2 from day 1–3. Right, mean bout number for bottle 1 and 2 from day 1–3. p, Preference ratio for bottle 1 from day 1–3 of closed-loop silencing paradigm. q, Total Ensure consumption from day 1–3 of closed-loop silencing paradigm. r, Left, mean number of licks for bottle 1 and 2 from day 1–3 of closed-loop silencing paradigm (Ensure consumption). Middle, mean bout size (licks) for bottle 1 and 2 from day 1–3. Right, mean bout number for bottle 1 and 2 from day 1–3. s, Left, mean number of licks for bottle 1 and 2 from closed-loop silencing paradigm (sucralose consumption). Middle, mean bout size (licks) for bottle 1 and 2. Right, mean bout number for bottle 1 and 2. t, Left, mean number of licks for bottle 1 and 2 from closed-loop silencing paradigm (water consumption). Middle, mean bout size (licks) for bottle 1 and 2. Right, mean bout number for bottle 1 and 2. NS, *P < 0.05, **P < 0.01, ***P < 0.001, ****P < 0.0001. Data are mean ± sem. Statistics are shown in Supplementary Table 2.
Extended Data Fig. 8
Extended Data Fig. 8. Regulation of GCG neurons by oral signals of ingestion.
a, Left, PRLH (PrlhCreRosaTom, red) and GCG (GcgGFP, green) neurons are intermingled but non-overlapping in the cNTS. Scale bar = 100 µm. Right. Quantification of overlap for PrlhCreRosaTom (red) and GcgGFP (green) cells in the cNTS (n = 3 mice). b, Left, fiber placement and GcaMP6s expression in GCG neurons. Right, example traces of calcium dynamics from GCG neurons during self-paced Ensure, Intralipid, or glucose consumption. c, Example traces of calcium dynamics from GCG neurons during self-paced sucralose, saline, or water consumption, or dry licking at an empty sipper. d, Left, PSTH of GCG neuron responses during just the first lick bout of the trial, aligned to the first lick of the trial, for the indicated solutions. Right, mean z-scores (0–10 s) during the first lick bout. e, Left, PSTH aligned to the first lick of the bout (averaged across all lick bouts) during Ensure consumption for GCG and PRLH neurons. Right, mean z-scores (0–10 s) during Ensure consumption for GCG and PRLH neurons. f, Left, PSTH aligned to the last lick of the bout (averaged across all lick bouts) during Ensure consumption for GCG and PRLH neurons. Right, mean decrease in z-score (0–15 s after last lick of each bout) during Ensure consumption for GCG and PRLH neurons. g, Mean Pearson Correlation Coefficient (PCC) for the relationship between the instantaneous lick rate each second during Ensure consumption and the z-scored change in activity across the entire 30 min trial for GCG and PRLH neurons. h, Comparison of the mean z-scores (0–30 min after lickometer access) for PRLH neurons (from Fig. 1) and GCG neurons (from Fig. 5). i, Left, PSTH of GCG neuron activity aligned to the first lick (averaged across all lick bouts). Right, mean response (0–10 s after first lick) averaged across all licking bouts. j, Comparison of the mean z-scores (0–10 s after first lick in bout) for PRLH neurons (from Fig. 2) and GCG neurons (from Fig. 5). k, Mean PCC for the relationship between the cumulative licks performed in the preceding time intervals and the z-scored change in activity across the entire 30 min trial of self-paced Ensure consumption. l, Mean z-score per lick (mean z-score over 30 min trial/total number of licks) for each tastant. m, Mean z-score per lick (mean z-score 0–10 s of each bout divided by the number of licks in the same time frame) stratified by bout size for all tastants from GCG neurons. Each data point is an averaged value from a single animal. n, Left, mean z-score per lick by bout size for glucose consumption in WT and Trpm5−/− mice (GCG neurons). Middle, mean z-score per lick by bout size for sucralose consumption in WT and Trpm5−/− mice. Right, mean z-score per lick by bout size for Intralipid consumption in WT and Trpm5−/− mice. o, Left, PSTH of GCG neuron responses during feeding tube insertion into the esophagus (0–30 s). Right, mean z-scores (0–30 s) during feeding tube insertion. p, Left, example trace of calcium dynamics from GCG neurons during self-paced chow consumption. Right, example trace of calcium dynamics from GCG neurons during self-paced HFD consumption. q, Top, PSTH of PRLH neuron responses during self-paced chow or HFD consumption, or presentation of a non-food object (black), aligned to moment of food presentation. Bottom, cumulative fraction of total bites during the trial. r, Left, mean z-scores (0–10 min) after food/object access. Right, mean z-scores (0–30 min) after food/object access. NS, *P < 0.05, **P < 0.01, ***P < 0.001, ****P < 0.0001. Data are mean ± sem. Statistics are shown in Supplementary Table 1.
Extended Data Fig. 9
Extended Data Fig. 9. Regulation of GCG neurons by non-ingestive and GI signals.
a, Left, PSTH of GCG neuron responses to tail suspension. Right, mean z-scores (0–60 s) during tail suspension. b, Left, PSTH of GCG neuron responses to presentation of a same-sex mouse intruder. Right, mean z-scores (0–3 min) during intruder presentation. c, Left, PSTH of GCG neuron responses to IP injection of LiCl (84 mg/kg) or LPS (100 ug/kg). Right, mean z-scores (0–30 min) after IP injection of LiCl or LPS. d, Left, PSTH of GCG neuron responses to IP injection of 5HT, CCK, amylin, Exendin-4, PYY, calcitonin, ghrelin, and saline. Right, mean z-scores (0–30 min) after IP injection of each gut peptide. e, A Davis Rig gustometer was used to give mice access to Ensure at defined time intervals. Right, mean z-score during the last trial of 5 s or 60 s brief access Davis rig experiments. f, Left, PSTH of GCG neuron responses in mice given access to chow or HFD from 0–10 min (gray shaded). Right, mean z-scores during 0–10 min food access (“during ingestion”) or 10–30 min (“post ingestion”). g, There is a positive correlation between total food intake during 10 min access (grams) and post-ingestive activity of GCG neurons. Post-ingestive activity was calculated as the average z-score after food removal (10–30 min) divided by the average z-score during food access (0–10 min). Colored dots indicate chow (brown) or HFD (blue). h, Left, PSTH of PRLH neuron responses in mice given access to chow or HFD from 0–10 min (gray shaded). Right, mean z-scores during 0–10 min food access (“during ingestion”) or 10–30 min (“post ingestion”). i, There is no correlation between total food intake during 10 min access (grams) and post-ingestive activity of PRLH neurons. j, cNTS photometry recordings were performed while mice received intragastric (IG) infusions of various solutions. k, Left, PSTH of GCG neuron responses during and after IG infusions (infusion 0–10 min; 1 mL) of Ensure, glucose, mannitol, or saline. Middle, mean z-scores during IG infusions (0–10 min). Right, mean z-scores during and after IG infusions (0–30 min). l, Left, PSTH of PRLH neuron responses during after IG infusions (0–10 min; 1 mL) of Ensure, glucose, mannitol, or saline. Middle, mean z-scores during IG infusions (0–10 min). Right, mean z-scores during and after IG infusions (0–30 min). m, Mean PCC for the relationship between the volume infused (1 mL) over time and the z-scored change in activity during the 10 min IG infusion of Ensure, glucose, or Intralipid. n, Left, PSTH of GCG neuron responses to volume-matched oral ingestion or IG infusion of glucose. Bottom panel shows mean trace for percentage of total food consumption. Right, mean z-scores during oral ingestion or IG infusion (0–10 min), or post-ingestion (10–30 min). o, Left, PSTH of GCG neuron responses to volume-matched oral ingestion or IG infusion of Intralipid. Right, mean z-scores during oral ingestion or IG infusion (0–10 min), or post-ingestion (10–30 min). p, Left, PTSH of GCG neuron responses to IG infusion of Intralipid or saline (1 mL) in Trpm5−/− mice. Right, mean z-scores (0–30 min) after infusion of Intralipid or saline. q, Left, PTSH of PRLH and GCG neuron responses to IG infusion of air (1 mL) from 0–10 min. Right, mean z-scores during IG infusion of air (0–10 min) or during the entire trial (0–30 min). r, Left, PSTH of GCG neuron responses during and after IG infusions of Intralipid (0–10 min; 1.5 mL) in mice that received prior IP injection of devazepide or vehicle. Right, mean z-scores during and after IG infusions (0–30 min). s, Left, PSTH of GCG neurons during and after oral consumption of Intralipid, following injection of either devazepide or vehicle. Right, mean z-scores (0–30 min) during Intralipid consumption. t, Devazepide pretreatment does not change total Intralipid consumption in GcgiCre mice (from panel r). NS, *P < 0.05, **P < 0.01, ***P < 0.001, ****P < 0.0001. Data are mean ± sem. Statistics are shown in Supplementary Table 1.
Extended Data Fig. 10
Extended Data Fig. 10. GCG neuron activation promotes long-lasting satiety.
This figure extends the data from Fig. 6 by showing, for each experiment, the response of genetic controls (“controls” - mice that lack opsin or iCre expression) to the given laser stimulation protocol. The data from opsin-expressing mice (“ChR2”) are also reproduced here to enable direct comparison with controls. a, Fiber placement and ChR2-GFP expression in GCG neurons of the cNTS. b, Mean chow consumption (g) after open-loop stimulation (30 min; food-deprived mice) of GCG neurons or no laser trials for ChR2-expressing mice or control mice. c, Left, mean Ensure consumption (mL) after open-loop stimulation (60 min; dark phase) of GCG neurons or no laser trials. Middle, mean bout size (licks) after open-loop stimulation. Right, mean bout number after open-loop stimulation. d, Mean water consumption (mL) after open-loop stimulation (30 min; water-deprived) of GCG neurons or no laser trials. e, Left, mean Ensure consumption (mL) after closed-loop stimulation (60 min; dark phase) of GCG neurons (when animals are licking) or sham trials. Middle, mean bout size (licks) after closed-loop stimulation. Right, mean bout number after closed-loop stimulation. f, Left, mean Ensure consumption (mL) after pre-stimulation (60 min) of GCG neurons or no laser trials. Middle, mean bout size (licks) after pre-stimulation. Right, mean bout number after pre-stimulation. g, Mean chow consumption (g) after pre-stimulation of GCG neurons for 15 min (left), 30 min (middle), or 60 min (right). h, Mean chow consumption (g) after pre-stimulation of PRLH neurons for 60 min. i, Left, mean Ensure consumption (mL) after pre-stimulation (60 min) of PRLH neurons or no laser trials. Middle, mean bout size (licks) after pre-stimulation. Right, mean bout number after pre-stimulation. NS, *P < 0.05, **P < 0.01, ***P < 0.001, ****P < 0.0001. Data are mean ± sem. Statistics are shown in Supplementary Table 2.
Extended Data Fig. 11
Extended Data Fig. 11. Separate circuits for the oral and gastrointestinal control of ingestion.
a, Food intake generates both fast orosensory and slower GI signals that feed back to the cNTS to modulate appetite. Orosensory signals, including taste, preferentially target PRLH neurons, which are phasically activated during bouts of ingestion and function to acutely restrain bout size, thereby slowing down the pace of ingestion. Mechanosensory signals from the GI tract preferentially target GCG neurons, which show sustained activity during feeding and transmit a long-lasting satiety signal that delays reinitiation of feeding. b, Our data suggest that appetitive tastes, such as sweet and fat, are used by different brain systems for opposing purposes. Activation of well-known gustatory reward pathways by palatable tastes functions to increase food consumption. In parallel, activation of PRLH neurons by palatable tastes feeds back to slow down the rate of ingestion by limiting bout size. Although it may seem counterintuitive that palatable tastes would be used by some brain systems to inhibit ingestion, the existence of this mechanism is supported by several lines of evidence. This evidence includes the results of sham feeding studies in rats,, which showed that a pre-gastric signal (likely involving taste) slows down ingestion.

References

    1. Berthoud, H.-R. in Neurobiology of Food and Fluid Intake (eds Stricker, E. M. & Woods, S. C.) 195–240 (Springer, 2004).
    1. Chambers AP, Sandoval DA, Seeley RJ. Integration of satiety signals by the central nervous system. Curr. Biol. 2013;23:R379–R388. doi: 10.1016/j.cub.2013.03.020. - DOI - PMC - PubMed
    1. Cheng W, et al. Hindbrain circuits in the control of eating behaviour and energy balance. Nat. Metab. 2022;4:826–835. doi: 10.1038/s42255-022-00606-9. - DOI - PubMed
    1. Alcantara IC, Tapia APM, Aponte Y, Krashes MJ. Acts of appetite: neural circuits governing the appetitive, consummatory, and terminating phases of feeding. Nat. Metab. 2022;4:836–847. doi: 10.1038/s42255-022-00611-y. - DOI - PMC - PubMed
    1. Vrang N, Phifer CB, Corkern MM, Berthoud H-R. Gastric distension induces c-Fos in medullary GLP-1/2-containing neurons. Am. J. Physiol. Regul. Integr. Comp. Physiol. 2003;285:R470–R478. doi: 10.1152/ajpregu.00732.2002. - DOI - PubMed

Publication types

Substances