. 2023 Nov;623(7989):1034-1043.
doi: 10.1038/s41586-023-06749-3. Epub 2023 Nov 22.

Trans-vaccenic acid reprograms CD8+ T cells and anti-tumour immunity

Affiliations

Trans-vaccenic acid reprograms CD8+ T cells and anti-tumour immunity

Hao Fan et al. Nature. 2023 Nov.

Abstract

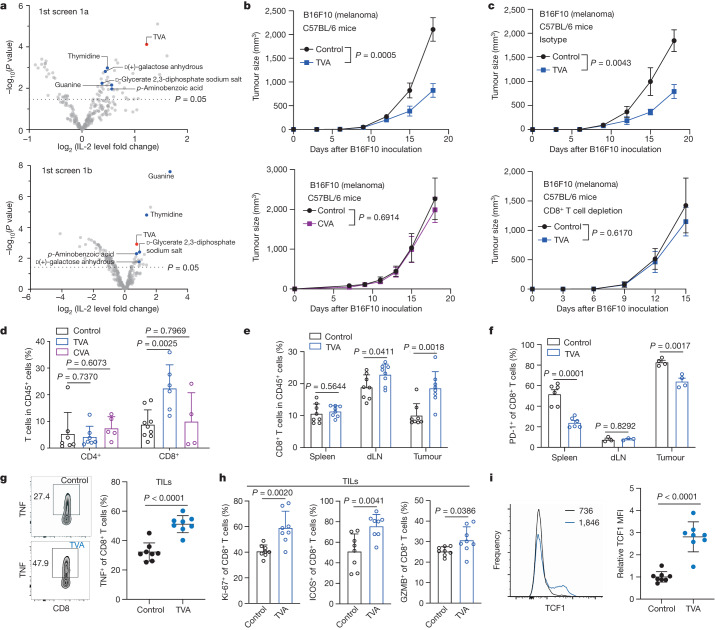
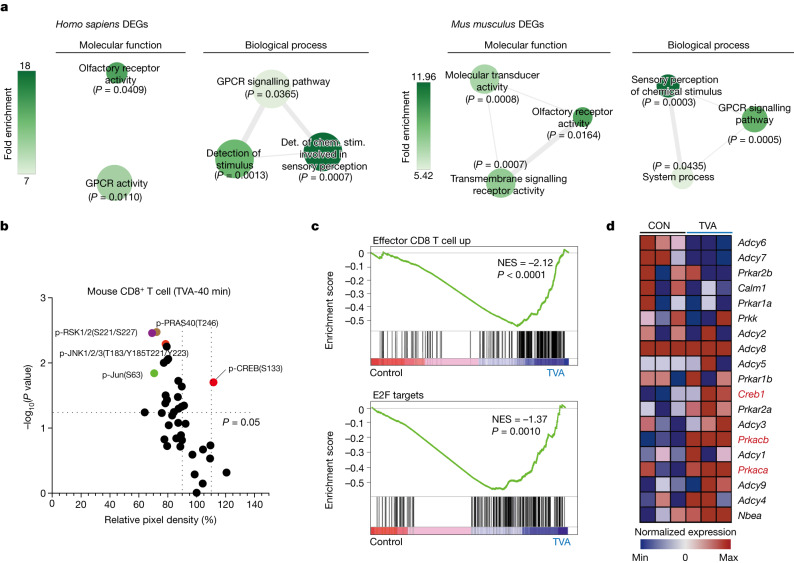
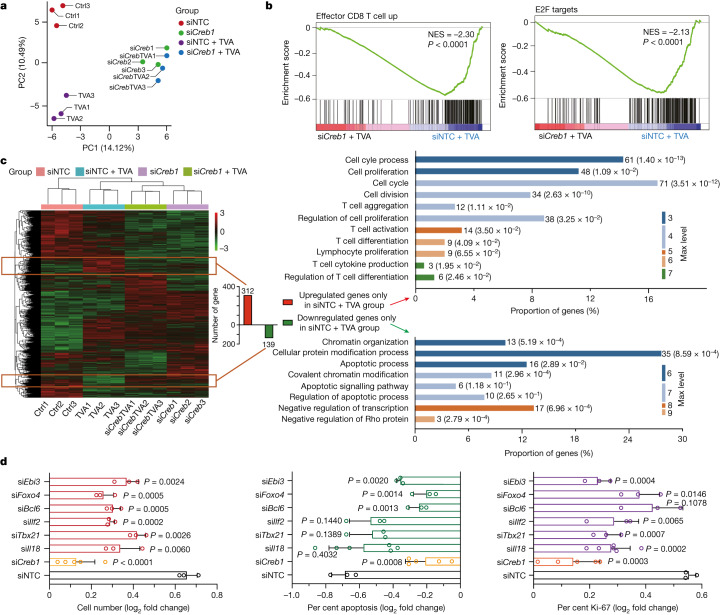
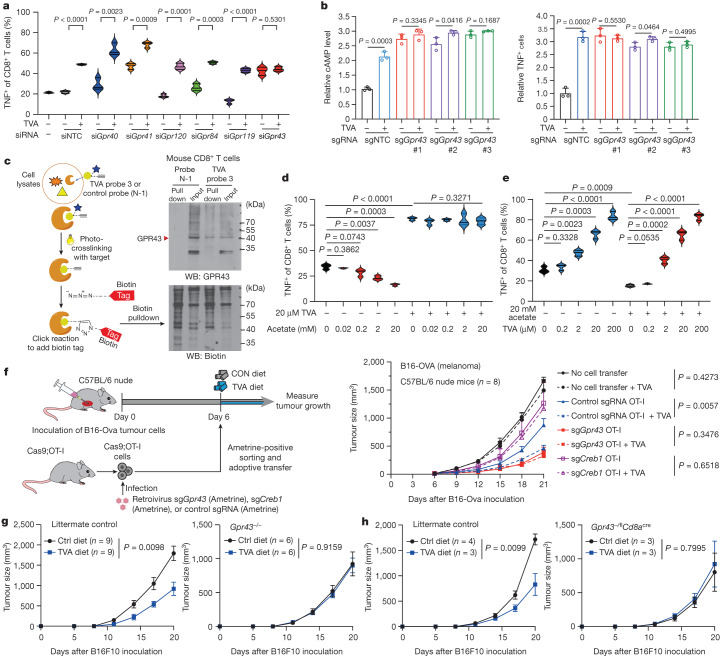
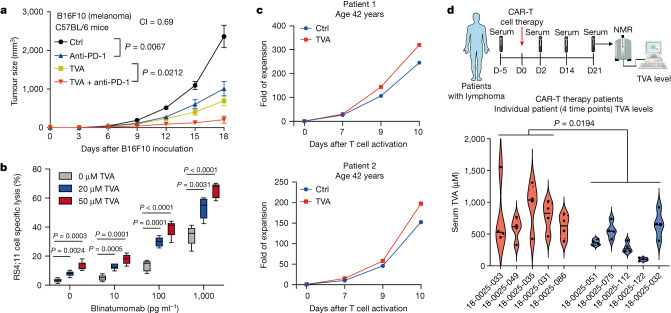
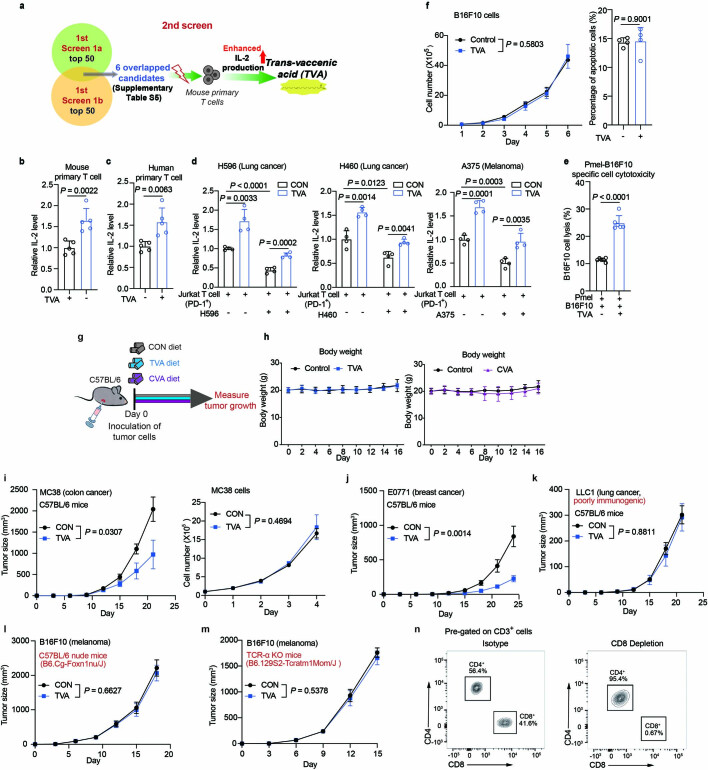
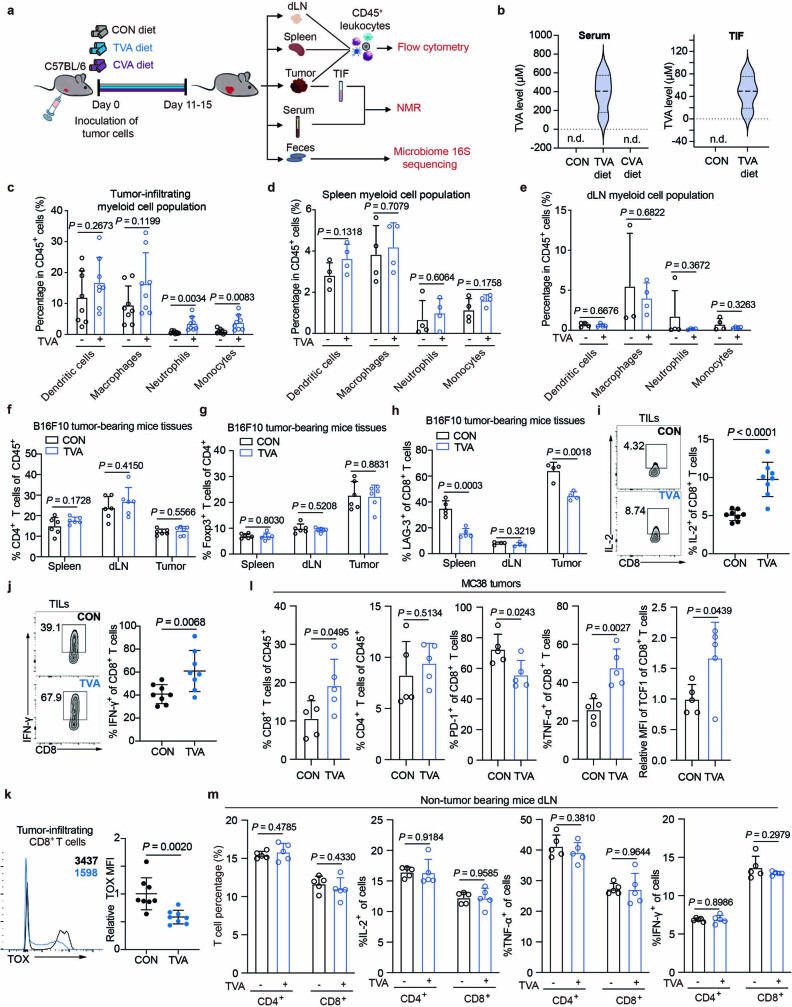
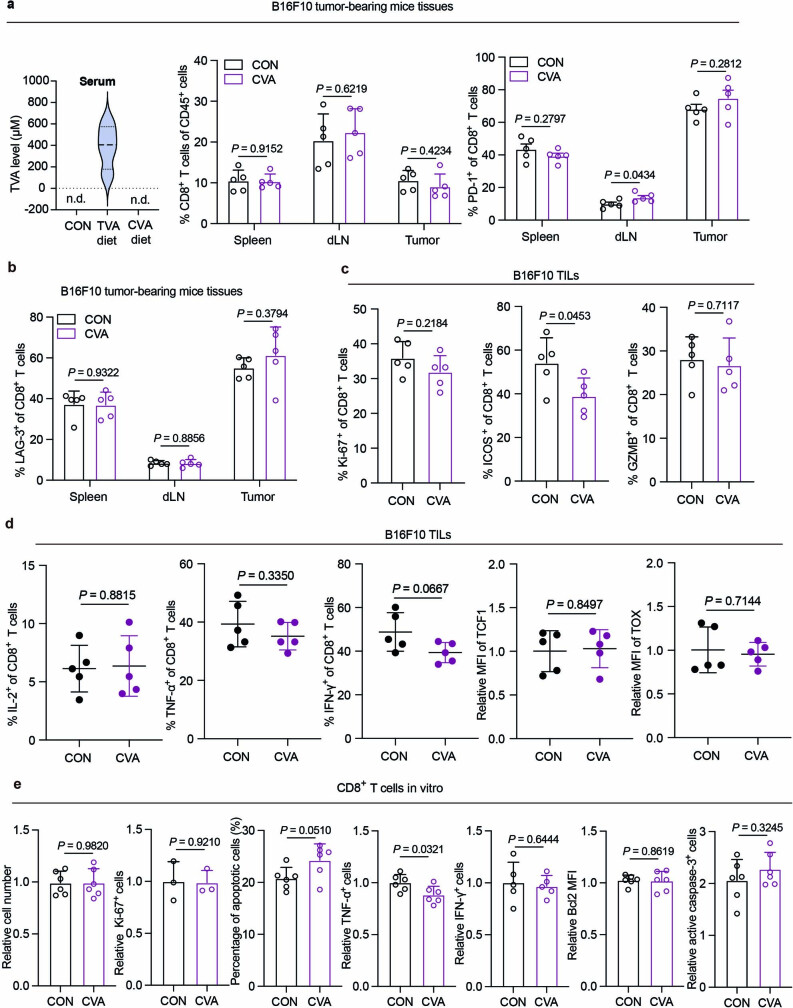
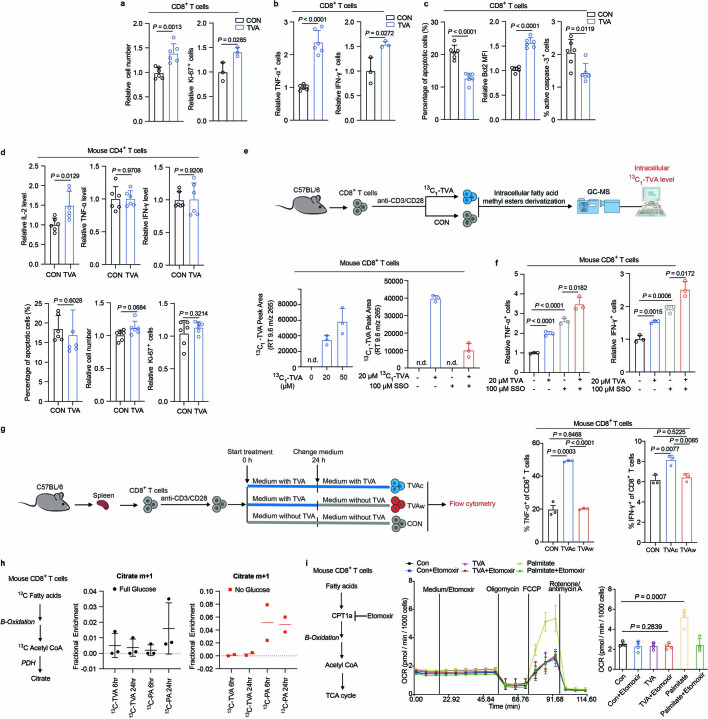
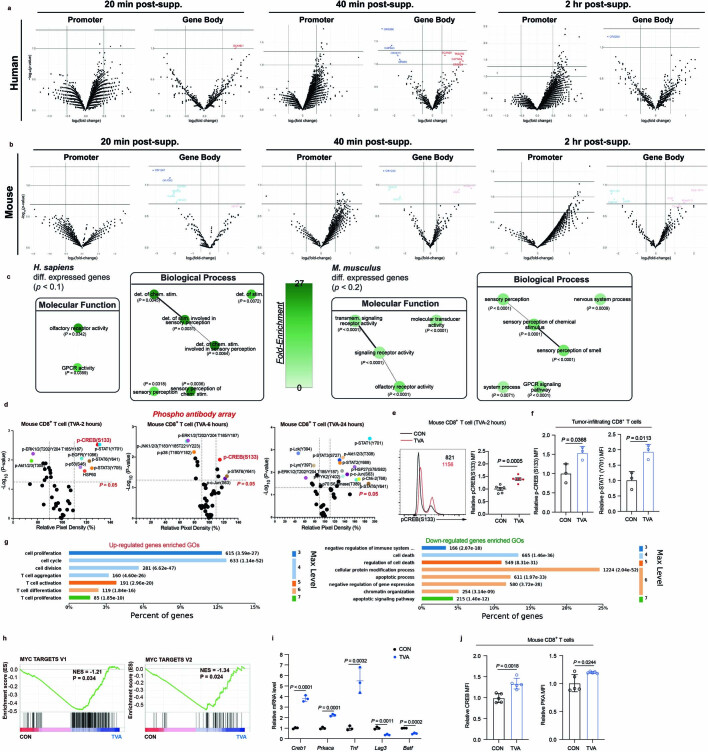
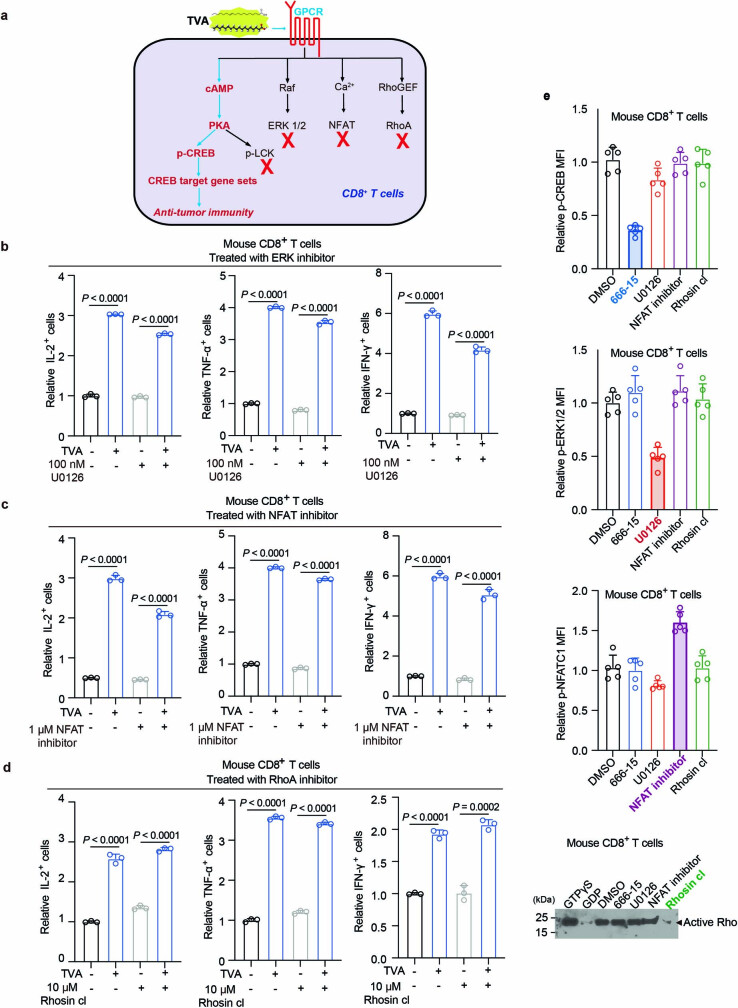
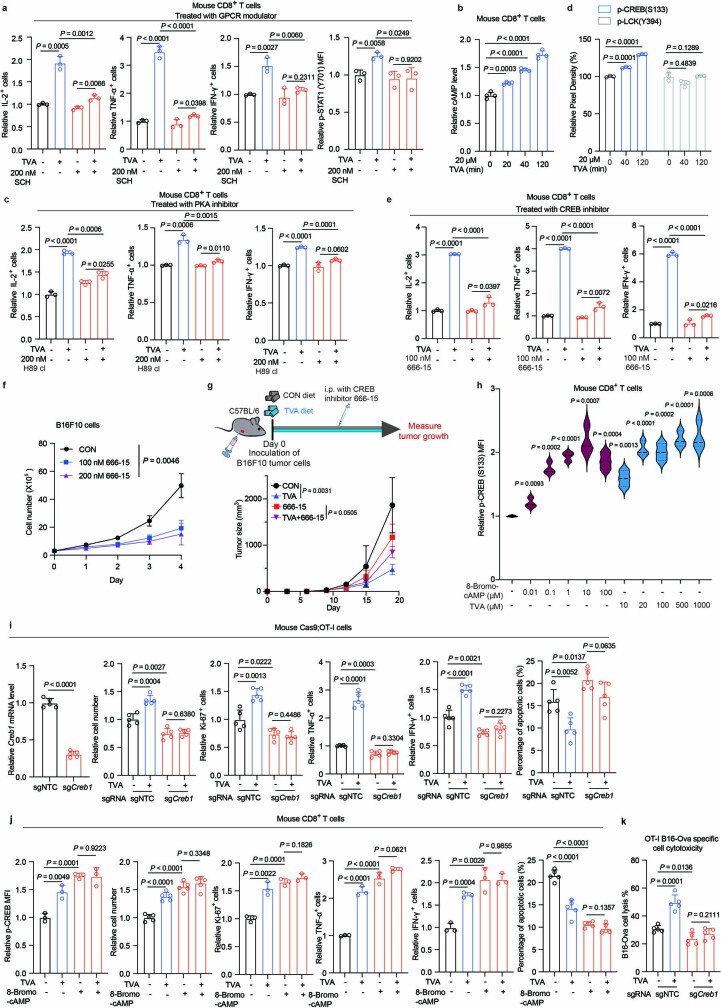
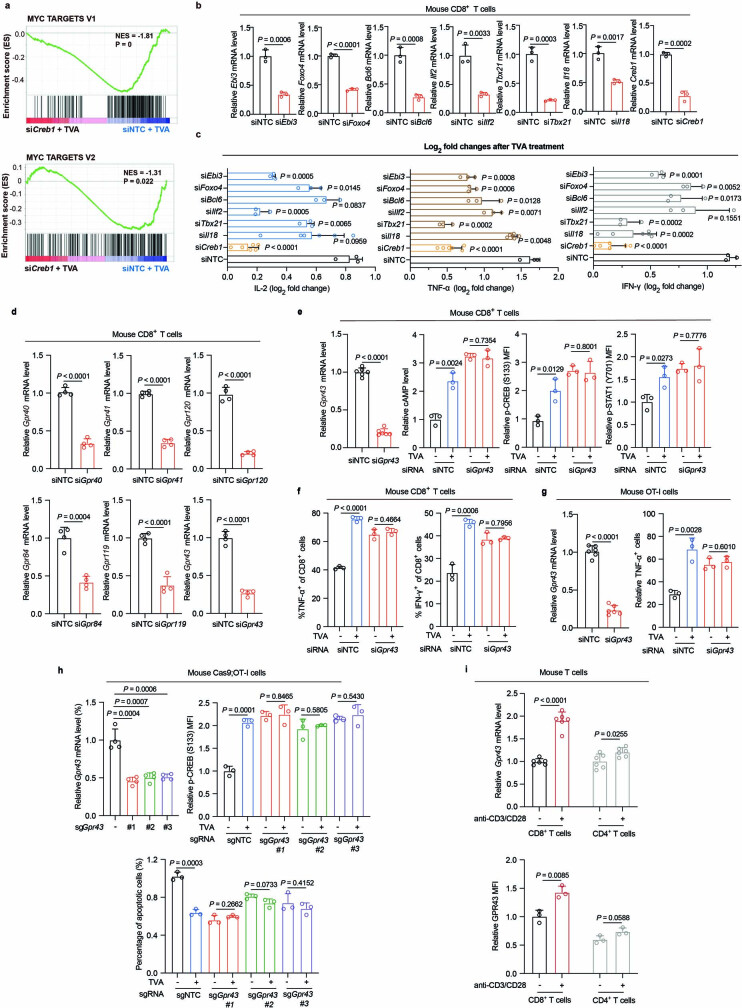
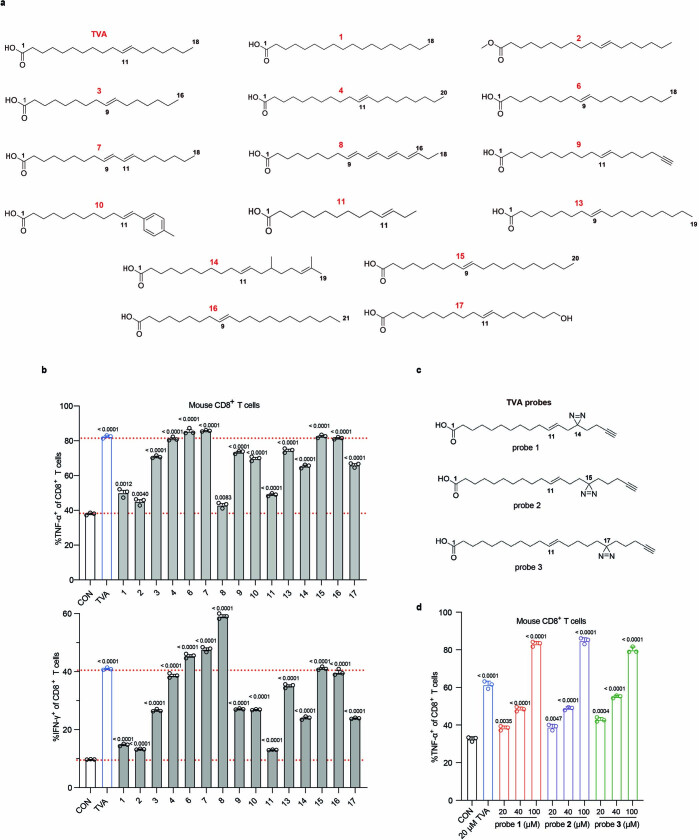
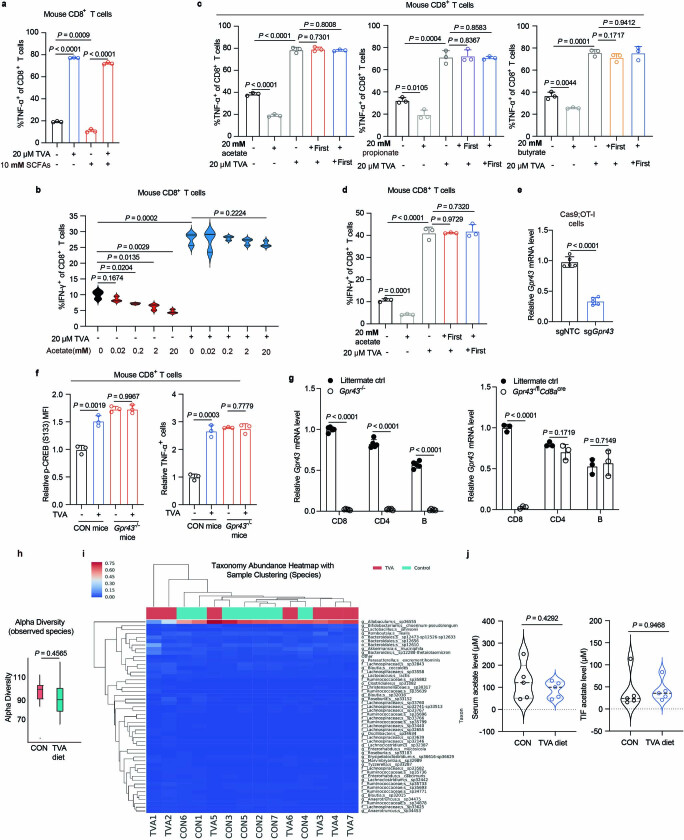
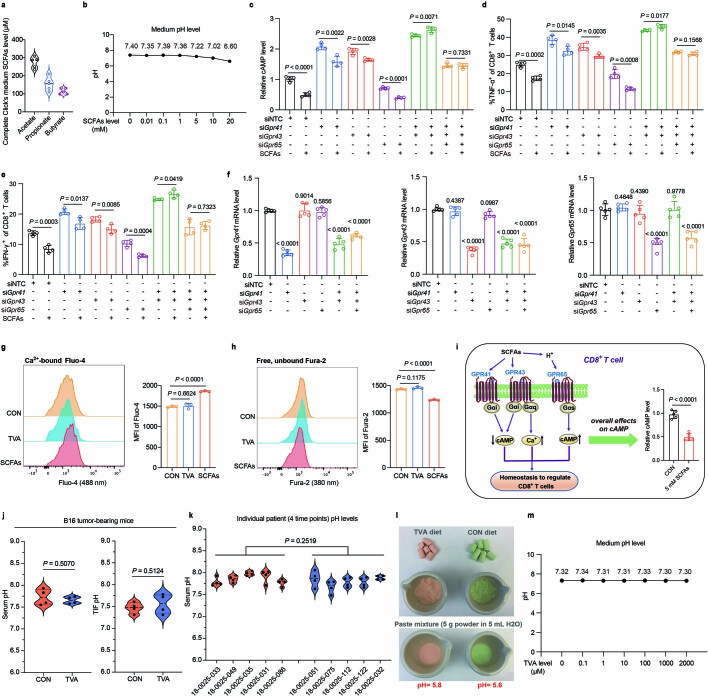
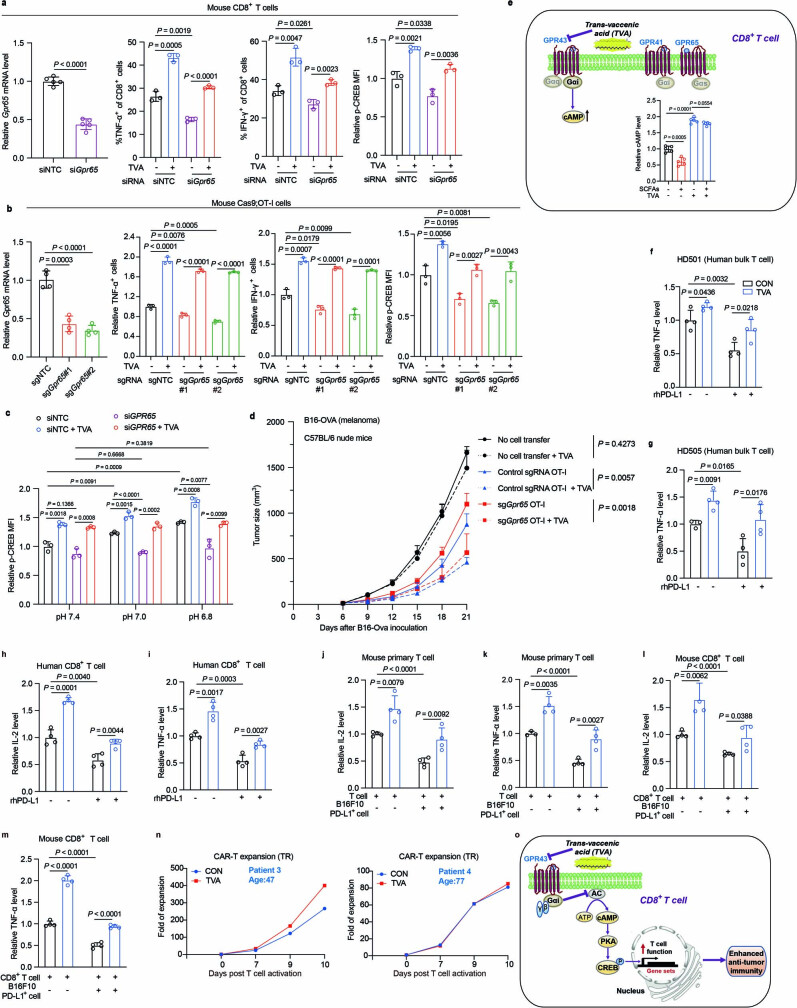
Diet-derived nutrients are inextricably linked to human physiology by providing energy and biosynthetic building blocks and by functioning as regulatory molecules. However, the mechanisms by which circulating nutrients in the human body influence specific physiological processes remain largely unknown. Here we use a blood nutrient compound library-based screening approach to demonstrate that dietary trans-vaccenic acid (TVA) directly promotes effector CD8+ T cell function and anti-tumour immunity in vivo. TVA is the predominant form of trans-fatty acids enriched in human milk, but the human body cannot produce TVA endogenously1. Circulating TVA in humans is mainly from ruminant-derived foods including beef, lamb and dairy products such as milk and butter2,3, but only around 19% or 12% of dietary TVA is converted to rumenic acid by humans or mice, respectively4,5. Mechanistically, TVA inactivates the cell-surface receptor GPR43, an immunomodulatory G protein-coupled receptor activated by its short-chain fatty acid ligands6-8. TVA thus antagonizes the short-chain fatty acid agonists of GPR43, leading to activation of the cAMP-PKA-CREB axis for enhanced CD8+ T cell function. These findings reveal that diet-derived TVA represents a mechanism for host-extrinsic reprogramming of CD8+ T cells as opposed to the intrahost gut microbiota-derived short-chain fatty acids. TVA thus has translational potential for the treatment of tumours.


Conflict of interest statement

J.C. has patents pending on TVA and TVA derivatives. C.H. is a scientific founder and a scientific advisory board member of Inferna Green Inc. and AccuaDX Inc., and holds ownership shares of Accent Therapeutics Inc. H.C. consults for Kumquat Biosciences. A.A.P. has research funding from Celgene/BMS, Pfizer and Agios/Servier. The other authors declare no competing interests.

Figures

Fig. 1
Fig. 1. Dietary TVA enhances anti-tumour immunity through effector CD8+ T cells.
a, Scatter plot showing a summary of the initial screens (n = 4) to identify nutrients that enhance Jurkat T cell activation (1a, top) or reverse PD-L1–PD-1 mediated PD-1+ Jurkat T cell exhaustion induced by co-cultured H596 (PD-L1+) human lung cancer cells (1b, bottom). Fold change of IL-2 was obtained by comparing IL-2 production in the treated group to the control group. b, Effect of TVA-enriched diet (top) (n = 8) or CVA-enriched diet (bottom) (n = 10) on B16F10 tumour growth in C57BL/6 mice. c, Effect of TVA-enriched diet on B16F10 tumour growth in C57BL/6 mice treated with isotype control (top) or depleting CD8 (bottom) antibodies (n = 5). d, The percentage of CD4+ (control and TVA n = 7, CVA n = 5) and CD8+ (control n = 9, TVA n = 6, CVA n = 4) T cells among intratumoral CD45+ cells. e, The percentage of CD8+ T cells among spleen, dLN and intratumoral CD45+ cells (n = 8). f, PD-1 expression among CD8+ T cells in spleen (n = 6), dLN (n = 3) and tumour (n = 4). g, Flow cytometry-based quantification of TNF-positive cells among intratumoral CD8+ T cells after in vitro stimulation with phorbol myristate acetate (PMA) and ionomycin (n = 8). h, Quantification of Ki-67+ (left), ICOS+ (middle) and GZMB+ (right) cells among intratumoral CD8+ T cells (n = 8). i, Flow cytometry and quantification of TCF1 expression among intratumoral CD8+ T cells (n = 8). MFI, mean fluorescence intensity. Data are mean ± s.e.m (b,c) or mean ± s.d. (di). Two-way ANOVA (b,c) or Student’s two-sided unpaired t-test (a,di). Source Data
Fig. 2
Fig. 2. TVA has a regulatory function through a GPCR–CREB axis.
a, Human or mouse primary CD8+ T cells were isolated, activated and treated with or without TVA for different durations, followed by integrated, temporal mechanistic studies. GO term enrichment graphs generated from KAS-seq differential analysis of H. sapiens (left) and M. musculus (right) CD8+ T cell gene bodies (treated with 20 μM TVA versus untreated). Specifically, gene bodies exhibiting differential single-stranded DNA (ssDNA) levels for all timepoints (cut-off for individual timepoints of P < 0.4 (H. sapiens) or P < 0.5 (M. musculus)) are shown. Colour indicates fold-enrichment and size of GO term circles denotes the number of differentially expressed genes (DEGs) from KAS-seq data for that term. n = 3. Det. of chem. stim., determination of chemical stimulation. b, Scatter plot of a phospho-antibody array representing relative pixel density after TVA treatment for 40 min versus corresponding −log10(P value). Phosphoproteins with relative pixel density greater than 110% or less than 90% with P < 0.05 are highlighted (n = 3). c, GSEA of upregulated effector CD8+ T cells (top) and E2F targets (bottom) induced by TVA treatment in CD8+ T cells (n = 3). NES, normalized enrichment score. d, Heat map showing relative expression of PKA–CREB pathway genes in CD8+ T cells comparing TVA treatment group to the control ones (n = 3). Student’s two-sided unpaired t-test (b). Nominal P values were adjusted by the Benjamini–Hochberg method (a,c).
Fig. 3
Fig. 3. TVA’s effect on CD8+ T cells is primarily mediated through CREB and its target gene sets.
a, Principal component analysis of genes from RNA-seq analysis of siRNA-mediated transient knockdown of Creb1 (siCreb1) in CD8+ T cells with or without TVA treatment, compared to non-targeting control siRNA (siNTC) (n = 3). b, GSEA of upregulated effector CD8+ T cells (left) and E2F targets (right) with siNTC and TVA treatment compared with siCreb1 and TVA treatment group. n = 3. Nominal P values were adjusted by the Benjamini–Hochberg method. c, Heat map of differentially expressed genes from RNA-seq analysis of siCreb1 CD8+ T cells comparing with siNTC with or without TVA treatment. The up- or downregulated genes in the siNTC plus TVA group compared to the other three groups were gated with orange boxes (left) and enriched for GO analysis (right) (n = 3). d, Creb1 target genes validation. log2 fold changes of cell number (left), apoptosis (middle) and Ki-67 expression (right) after TVA treatment in CD8+ T cells with individually transient knockdown of Creb1 (n = 5), Il18 (left, n = 3; middle and right, n = 6), Tbx21, Ilf2, Bcl6, Foxo4 and Ebi3 (n = 3). Data are mean ± s.d. Student’s two-sided unpaired t-test. Ctrl, control. Source Data
Fig. 4
Fig. 4. TVA inactivates SCFA-binding GPR43.
a, Effects of knockdown of known fatty acid-binding GPCRs on TNF expression in mouse CD8+ T cells with or without TVA (n = 3). b, Effects of knockout of Gpr43 with three different sgRNAs on cAMP level (left) and TNF expression (right) in mouse Cas9-expressing OT-I cells with or without TVA (n = 3). c, Schematic of experimental setup for the pull-down assay (left). Proteins labelled with biotin by control probe N-1 or TVA probe 3 were pulled down by streptavidin beads. Western blotting was performed with anti-GP43 (top right) and anti-biotin (bottom right) on biotin-labelled proteins (n = 2). Gel source data is shown in Supplementary Fig. 2. d, Effects of different doses of acetate on TNF expression in mouse CD8+ T cells with or without 20 µM TVA (n = 3). e, Effects of increasing concentrations of TVA on TNF expression in CD8+ T cells with or without 20 mM acetate (n = 3). f, Left, schematic of experimental design for Gpr43- or Creb1-knockout Cas9-expressing OT-I cells in adoptive cell therapy experiments. This schematic was generated using BioRender.com. Cas9-expressing OT-I cells transduced with non-targeting control sgRNA or sgRNA targeting Gpr43 or Creb1 were transferred into mice at day 6 after engraftment of B16-OVA followed by analyses of tumour size (right). Non-treatment control mice did not receive T cells (n = 8). g, Effect of TVA-enriched diet on B16F10 tumour growth in Gpr43−/− (n = 6) or littermate control (n = 8) mice. h, Effects of TVA-enriched diet on B16F10 tumour growth in Gpr43−/flCd8acre (n = 3) or littermate control (control diet n = 4; TVA diet n = 3) mice are shown. Data are mean ± s.d. (a,b,d,e) or mean ± s.e.m. (fh). Student’s two-sided unpaired t-test (a,b,d,e) or two-way ANOVA (f,h). Source Data
Fig. 5
Fig. 5. TVA augments the effectiveness of multiple T cell-based anti-cancer therapies.
a, Effect of anti-PD-1 antibody on B16F10 tumour growth in C57BL/6 mice fed with TVA-enriched diet or control diet (n = 8). b, Box plots representing combined effect of blinatumomab and TVA at indicated concentrations on specific lysis of RS4;11 target cells in the presence of PBMCs by flow cytometry (n = 5). The central line is the mean, whiskers extend to minimum and maximum values and the box edges show mean ± s.d. c, Effects of treatment with 20 µM TVA on in vitro expansion of anti-CD19–CD28z CAR-T from patients with lymphoma. d, Top, schematic depicting experimental design for serum collection from patients with CAR-T cell therapy. This schematic was generated using BioRender.com. Bottom, violin plots showing serum TVA levels of 10 patients with lymphoma who have undergone commercial CAR-T cell therapy. Blood was collected from each patient at four different timepoints (detailed information can be found in Supplementary Table 8). Red violin plots represent the patients who have complete response to CAR-T cell therapy, and blue violin plots represent patients who have progressive disease under CAR-T cell therapy. Data are mean ± s.e.m (a) or mean ± s.d. (b,d). Two-way ANOVA (a) or Student’s two-sided unpaired t-test (b,d). Source Data
Extended Data Fig. 1
Extended Data Fig. 1. TVA’s anti-tumor immunity effects are mediated through T cells.
a, The 2nd screen strategy: top 50 candidates from 1st screens 1a and 1b were combined. The resulting 6 overlapped candidates were subjected to analysis of IL-2 levels using mouse primary T cells, revealing TVA as a top candidate that activates T cells. The figure was generated using BioRender. b, c, Effect of treatment with 20 µM TVA on IL-2 levels in mouse primary T cells (b) and human primary T cells (c) (n = 5). d, Effect of treatment with 20 µM TVA on PD-L1/PD-1 mediated Jurkat T cell exhaustion induced by co-cultured H596 (left) and H460 (middle) human lung cancer cells, or A375 human melanoma cells (right), assessed by IL-2 production levels (n = 4). e, Effect of treatment with 20 µM TVA on cytotoxicity of B16F10 cells by co-cultured Pmel cells in vitro (n = 5). f, Effect of treatment with 20 µM TVA on B16F10 cell proliferation (left) (n = 3) or apoptosis (right) (n = 4). g, Schematic depicting experimental design for in vivo mouse model. The figure was generated using BioRender. h, Body weight changes of B16F10 tumor-bearing C57BL/6 mice fed with TVA diet (left) or CVA diet (right) (n = 10). i, Effect of treatment with 20 µM TVA on MC38 cell proliferation (left) (n = 3) or TVA-enriched diet on colon cancer MC38 (right) (n = 8). j, k, Effect of TVA-enriched diet on breast cancer E0771 (j) and lung cancer LLC1 (k) tumor growth in C57BL/6 mice (n = 8). l, m, Effect of TVA-enriched diet on B16F10 tumor growth in nude mice (l) or TCR-α KO mice (m) (n = 10). n, CD8+ T cell depletion efficiency checked by flow cytometry (n = 8). Data are mean ± SD (b-f) or mean ± s.e.m (h-m). Student’s two-sided unpaired t test (b-f) or two-way ANOVA (h-m). Source Data
Extended Data Fig. 2
Extended Data Fig. 2. TVA shows distinct effect among leukocytes populations.
a, Schematic depicting experimental design for in vivo tumor-bearing mouse model fed with indicated diets and samples collection. The figure was generated using BioRender. b, TVA levels in B16F10 tumor-bearing mice serum (left) and TIF (right) were measured by 1H nuclear magnetic resonance (NMR) spectroscopy (n = 4). c, Quantification of the percentage of dendritic cells, macrophages, neutrophils, and monocytes among tumor CD45+ cells (n = 8). d, e, Quantification of the percentage of dendritic cells, macrophages, neutrophils, and monocytes among spleen (d) or dLN (e) CD45+ cells (n = 4). f, Quantification of the percentage of CD4+ T cells among spleen, dLN, and intratumoral CD45+ cells (n = 6). g, Quantification of the percentage of CD4+Foxp3+ Treg cells among spleen, dLN, and intratumoral CD4+ cells (n = 6). h, Quantification of LAG-3 expression among CD8+ T cells in spleen (n = 5), dLN, and tumor (n = 4). For gating strategies for flow cytometry analysis of spleen and dLN lymphocytes, see Supplementary Fig. 1. i, j, Flow cytometry and quantification of IL-2 (i) and IFN-γ (j) levels among intratumoral CD8+ T cells after in vitro phorbol myristate acetate (PMA)/ionomycin stimulation (n = 8). k, Flow cytometry and quantification of TOX expression among intratumoral CD8+ T cells (n = 8). l, Quantification of the percentage of CD8+ and CD4+ T cells among intratumoral CD45+ cells (left two), and quantification of PD-1, TNF-α, TCF1 expression among CD8+ TILs (right three) in MC38 tumors (n = 5). m, Quantification of the percentage of CD4+ and CD8+ T cells among dLN CD45+ cells (left), and quantification of IL-2, TNF-α, IFN-γ expression among dLN CD45+ cells (right three) in non-tumor-bearing mice (n = 5). Data are mean ± SD (b-m). Student’s two-sided unpaired t test (b-m). Source Data
Extended Data Fig. 3
Extended Data Fig. 3. Dietary CVA has no significant effect on CD8+ T cell function in tumor-bearing mice.
a, With CVA diet, TVA levels in B16F10 tumor-bearing mice serum (left) were measured by 1H nuclear magnetic resonance (NMR) spectroscopy (n = 4). Quantification of the percentage of CD8+ T cells among spleen, dLN, and intratumoral CD45+ cells (n = 5) (middle). Quantification of PD-1 expression among CD8+ T cells in spleen, dLN, and tumor (n = 5) (right). b, Quantification of LAG-3 expression among CD8+ T cells in spleen, dLN, and tumor (n = 5). c, Quantification of Ki-67- (left), ICOS- (middle), and GZMB-positive cells (right) among intratumoral CD8+ T cells (n = 5). d, Flow cytometry-based quantification of IL-2, TNF-α, or INF-γ-positive cells among intratumoral CD8+ T cells after in vitro phorbol myristate acetate (PMA)/ionomycin stimulation (n = 5, left three), flow cytometry and quantification of TCF1 and TOX expression among intratumoral CD8+ T cells (n = 5, right two). e, Mouse primary CD8+ T cells were isolated, activated, and treated with CVA, followed by analysis of CVA effect on cell functions. Relative cell number (n = 5), Ki-67-positive cells (n = 3), percentage of apoptotic cells (n = 6), relative TNF-α- (n = 6) or IFN-γ-positive cells (n = 5), Bcl2 level, and active caspase-3 level among CD8+ T cells (n = 6) were shown. Data are mean ± SD (a-e). Student’s two-sided unpaired t test (a-e). Source Data
Extended Data Fig. 4
Extended Data Fig. 4. TVA functions in an extracellular manner.
a, Relative cell number (n = 6) and Ki-67-positive cells among CD8+ T cells +/− TVA treatment (n = 3). b, Relative TNF-α- (left) (n = 6) or IFN-γ-positive cells (right) (n = 3) among CD8+ T cells +/− TVA treatment. c, Percentage of apoptotic cells (left), Bcl2 level (middle), and active caspase-3 level (right) among CD8+ T cells +/− TVA treatment (n = 6). d, Relative IL-2, TNF-α, and IFN-γ production among CD4+ T cells after phorbol myristate acetate (PMA)/ionomycin stimulation + /− TVA treatment in vitro (upper three), and apoptotic cell percentage among CD4+ T cells, relative cell number (n = 5), Ki-67-positive cells (lower three) (n = 6). e, Schematic depicting experimental setup for in vitro T cell model for 13C1-TVA metabolic flux analysis by GC-MS. The figure was generated using BioRender (upper). Detection of intracellular 13C-labled TVA level in mouse CD8+ T cells by GC-MS (lower left). Effect of CD36 inhibitor SSO on 13C-labled TVA uptake in mouse CD8+ T cells was accessed by GC-MS (lower right) (n = 3). f, Effect of TVA treatment with or without CD36 inhibitor SSO on production of TNF-α (left) or INF-γ (right) by mouse CD8+ T cells (n = 3). g, Schematic depicting experimental setup for in vitro T cell model for TVA “wash-off” assay (TVAc: CD8+ T cells were treated with 20 µM TVA for 48 h; TVAw: CD8+ T cells were treated with 20 µM TVA for 24 h and then changed to culture medium without TVA for another 24 h). The figure was generated using BioRender (left). Quantification of TNF-α- (middle) and IFN-γ-positive cells (right) after phorbol myristate acetate (PMA)/ionomycin stimulation among CD8+ T cells for TVA “wash-off” assay (n = 3). h, 13C fatty acid tracing experiment: Schematic illustrating routes of 13C entry from 13C-fatty acids (left), citrate enrichment in mouse CD8+ T cells after treated with 13C -TVA or 13C -palmitate acid (PA) under full glucose medium (middle) (n = 3), or under no glucose medium (right) (n = 2). i, Fatty acid oxidation measured by Seahorse: Schematic of fatty acid oxidation (FAO) in mouse CD8+ T cells (left), the impact of TVA or PA treatment on FAO via assessing changes in oxygen consumption (OCR) (middle), quantification of OCR (right) (n = 4). Data are mean ± SD (a-h middle, i). Student’s two-sided unpaired t test (a-h middle, i). Source Data
Extended Data Fig. 5
Extended Data Fig. 5. TVA activates a GPCR pathway in CD8+ T cells.
a, b, Human (a) and mouse (b) Volcano plots depicting differential promoter and gene body ssDNA levels measured by KAS-seq in CD8+ T cell treated with 20 μM TVA for indicated timepoint (relative to untreated cells). Heavy horizontal lines correspond to p-values of 0.2 (M. musculus only), 0.1, and 0.05, while heavy vertical lines correspond to a log2|fold-change| value of 0.5 (n = 3). c, GO enrichment graphs for all differentially expressed gene bodies (at any timepoint) for the corresponding P-value cutoffs and species. Color and GO term circle size correspond to fold-enrichment and number of differentially-expressed gene bodies for that term, respectively (n = 3). d, Scatterplot of phosphor-antibody array representing relative pixel density after TVA treatment for indicated time versus corresponding −log10(P-value). Phosphor-proteins with relative pixel density >110% or <90%, meanwhile P < 0.05 as significant change were highlighted (n = 3). e, Flow cytometry (left) and quantification (right) of p-CREB(S133) level among CD8+ T cells treated with 20 µM TVA for 2 h (n = 6). f, Quantification of p-CREB (left), and p-STAT1 (right) levels among mouse tumor-infiltrating CD8+ T cells (n = 3). g, GO enrichment analysis of up-regulated genes (upper) and down-regulated genes (lower) by RNA-seq analysis of CD8+ T cells treated with TVA comparing to control (n = 3). h, GSEA of upregulated MYC targets V1 (left) and MYC target V2 (right) induced by TVA treatment in CD8+ T cells. NES, normalized enrichment score. i, Validation of some differentially expressed genes (DEGs) from RNA-seq analysis by RT-PCR (n = 3). j, Quantification of CREB (left), and PKA (right) levels in mouse CD8+ T cells treated with or without TVA (n = 5). Data are mean ± SD (e-f, i-j). Nominal P values were adjusted by the Benjamini–Hochberg method (a-c, h). Student’s two-sided unpaired t test (d-f, i-j). Source Data
Extended Data Fig. 6
Extended Data Fig. 6. TVA functions through the cAMP-PKA-CREB axis but not other downstream effector pathways of GPCR.
a, Summary of TVA-GPCR downstream signaling changes induced by TVA in CD8+ T cells. The red fork means no change. b, c, d, Effect of treatment with ERK inhibitor U0126 (b), NFAT inhibitor (c), or RhoA inhibitor Rhosin cl (d) on relative IL-2 (left), TNF-α (middle), and IFN-γ (right) levels in mouse CD8+ T cells treated with or without TVA (n = 3). e, Validation of CREB, ERK, NFAT, and RhoA inhibitors effects at the concentrations used, GTPγS (positive control) and GDP (negative control) were used to ensure the pull-down procedures worked properly (n = 5). For gel source data, see Supplementary Fig. 2. Data are mean ± SD (b-e). Student’s two-sided unpaired t test (b-e). Source Data
Extended Data Fig. 7
Extended Data Fig. 7. TVA requires the cAMP-PKA-CREB axis to enhance CD8+ T cell function.
a, Effects of treatment with GPCR modulator SCH on TVA-dependent CD8+ T cell activation assessed by IL-2 (left), TNF-α (middle left), IFN-γ (middle right), and p-STAT1 (right) levels (n = 3). b, Effects of TVA treatment on cAMP levels of CD8+ T cells (n = 3). c, Effect of treatment with PKA inhibitor H89 cl on TVA-dependent CD8+ T cell activation assessed by IL-2 (left), TNF-α (middle), and IFN-γ (right) levels (n = 3). d, Effect of TVA treatment on p-CREB and p-LCK levels of CD8+ T cells (n = 3). e, Effects of treatment with CREB inhibitor 666-15 on TVA-dependent CD8+ T cell activation assessed by IL-2 (left), TNF-α (middle), and IFN-γ (right) levels (n = 3). f, Effect of treatment with CREB inhibitor 666-15 on B16F10 cell proliferation in vitro (n = 3). g, Schematic depicting experimental design for in vivo tumor-bearing mouse model fed with TVA diet and treated with CREB inhibitor. The figure was generated using BioRender (upper). Effects of treatment with CREB inhibitor 666-15 and / or TVA diet on B16F10 tumor growth in vivo (lower) (n = 5). h, Effect of treatment with different doses of cell permeable 8-Bromo-cAMP or TVA on p-CREB levels of CD8+ T cells (n = 3). i, Effect of knockout of Creb1 with sgRNA on Creb1 mRNA level, relative cell number, Ki67 level, TNF-α level, IFN-γ level, and apoptotic cell percentage in mouse Cas9;OT-I cells treated with or without TVA (n = 5). j, Effect of 8-Bromo-cAMP treatment on p-CREB level (n = 3), relative cell number (n = 5), Ki67 level (n = 3), TNF-α level (n = 3), IFN-γ level (n = 3), and apoptotic cell percentage in mouse CD8+ T cells treated with or without TVA (n = 5). k, Effect of knockout of Creb1 with sgRNA on cell cytotoxicity in mouse Cas9;OT-I cells treated with or without TVA (n = 5). Data are mean ± SD (a-e and h-k) or mean ± s.e.m (f-g). Student’s two-sided unpaired t test (a-e and h-k) or two-way ANOVA (f-g). Source Data
Extended Data Fig. 8
Extended Data Fig. 8. TVA-enhanced CD8+ T cell function requires the GPR43-CREB axis.
a, GSEA of upregulated MYC targets V1 (upper) and MYC target V2 (lower) in siNTC with TVA treatment compared to siCreb1 with TVA treatment. NES, normalized enrichment score. b, Ebi3, Foxo4, Bcl6, Ilf2, Tbx21, IL18, and Creb1 knockdown efficiency checked by RT-PCR (n = 3). c, TVA-Creb1 target genes validation: Log2 fold changes of IL-2 (left), TNF-α (middle), and IFN-γ (right) after TVA treatment in CD8+ T cells with individually transient knockdown of Creb1, Il18 (n = 6), Tbx21, Ilf2, Bcl6, Foxo4, and Ebi3 (n = 3). d, Gpr40, Gpr41, Gpr120, Gpr84, Gpr119, and Gpr43 knockdown efficiency checked by RT-PCR (n = 4). e, Gpr43 knockdown efficiency in CD8+ T cells was checked by RT-PCR (left) (n = 6). Effects of Gpr43 transient knockdown on cAMP (middle left), p-CREB (middle right), and p-STAT1 (right) levels in mouse CD8+ T cells treated with or without TVA were shown (n = 3). f, Effects of Gpr43 transient knockdown on TNF-α (left) and IFN-γ (right) levels in mouse CD8+ T cells treated with or without TVA (n = 3). g, Gpr43 knockdown efficiency in OT-I cells was checked by RT-PCR (left). Effect of Gpr43 transient knockdown on TNF-α level (right) in OT-I cells treated with or without TVA was shown (n = 3). h, Knockout efficiency of Gpr43 in Cas9;OT-I cells was checked by RT-PCR (upper left) (n = 4). Effects of individually knockout of Gpr43 with three sgRNAs on p-CREB level (upper right) and apoptosis (lower) in mouse Cas9;OT-I cells treated with or without TVA were shown (n = 3). i, Relative Gpr43 mRNA level (n = 6) and protein level (n = 3) in CD8+ T cells and CD4+ T cells with or without anti-CD3/CD28 stimulation. Data are mean ± SD (b-i). Nominal P values were adjusted by the Benjamini–Hochberg method (a), Student’s two-sided unpaired t test (b-i). Source Data
Extended Data Fig. 9
Extended Data Fig. 9. TVA derivatives and probes exhibit distinct bioactivity to enhance CD8+ T cell function.
a, Chemical structures of TVA and 15 TVA derivatives. b, Effects of treatment with 20 µM TVA or TVA derivatives on TNF-α (upper) and IFN-γ (lower) levels in CD8+ T cells (n = 3). c, Chemical structures of the three synthetic designed photo-affinity probes of TVA. d, Effects of treatment with 20, 40, or 100 µM TVA probes on TNF-α level in mouse CD8+ T cells (n = 3). Data are mean ± SD (b, d). Student’s two-sided unpaired t test (b, d). Source Data
Extended Data Fig. 10
Extended Data Fig. 10. TVA inactivates GPR43 by overshadowing its SCFA agonists.
a, Effect of treatment with 10 mM short chain fatty acids mix (mix of acetate, propionate, and butyrate) with or without 20 µM TVA on TNF-α expression in mouse CD8+ T cells (n = 3). b, Effects of synchronized treatment with different doses of acetate with or without 20 µM TVA on IFN-γ level in mouse CD8+ T cell (n = 3). c, Effects of sequential treatment with 20 mM acetate (left) or 20 mM propionate (middle) or 20 mM butyrate (right) and 20 µM TVA (acetate or propionate or butyrate first: acetate or propionate or butyrate for12 h first and then TVA added for another 12 h; TVA first: TVA for 12 h first and then acetate or propionate or butyrate added for another 12 h) on TNF-α level in CD8+ T cells (n = 3). d, Effects of subsequent treatment with 20 mM acetate and 20 µM TVA (acetate first: acetate for 12 h first and then TVA added for another 12 h; TVA first: TVA for 12 h first and then acetate added for another 12 h) on IFN-γ level in CD8+ T cells (n = 3). e, Gpr43 knockout efficiency in Cas9;OT-I cells which were used for ACT experiment was checked by RT-PCR (n = 5). f, Effects of TVA treatment on p-CREB (left), and TNF-α level (right) in Gpr43−/− or control mouse CD8+ T cells were shown (n = 3). g, Expression of Gpr43 mRNA was examined in CD8+, CD4+ T cells, and B cells from Gpr43−/− and littermate control mice (left) (n = 5) or from Gpr43−/flCd8acre and littermate control mice (right) (n = 3). h, TVA shows no significant effect on microbiota diversity. Box-and-whisker plot showing alpha diversity of gut feces microbiota in B16F10 tumor-bearing mice fed with control diet or TVA-enriched diet (n = 7), whiskers are min to max, central line is mean, bounds of box are mean ± SD. i, Heatmap showing the microbial composition of the samples at the species level with the top fifty most abundant species identified. Each row represents the abundance for each taxon, with the taxonomy ID shown on the right. Each column represents the abundance for each sample, with the sample ID shown at the bottom. Group information is indicated by the colored bar located on the top of each column. Hierarchical clustering was performed on samples based on Bray-Curtis dissimilarity. Hierarchical clustering was also performed on the taxa so that taxa with similar distributions are grouped together (n = 7 mice). j, Acetate levels in serum (left) and TIF (right) from B16F10 tumor-bearing mice were measured by 1H nuclear magnetic resonance (NMR) spectroscopy (n = 5). Data are mean ± SD (a-h, j). Student’s two-sided unpaired t test (a-h, j). Source Data
Extended Data Fig. 11
Extended Data Fig. 11. SCFAs affect mouse CD8+ T cell activity through GPR41, GPR43, and GPR65.
a, SCFAs level in Click’s medium (n = 5). b, Medium pH level with different doses of SCFAs. c, Effects of Gpr41, Gpr43, and Gpr65 transient knockdown on cAMP level in mouse CD8+ T cells treated with or without SCFAs (n = 4). d, Effect of Gpr41, Gpr43, and Gpr65 transient knockdown on TNF-α level in mouse CD8+ T cells treated with or without SCFAs (n = 4). e, Effect of Gpr41, Gpr43, and Gpr65 transient knockdown on IFN-γ level in mouse CD8+ T cells treated with or without SCFAs (n = 4). f, Gpr41 (left), Gpr43 (middle), and Gpr65 (right) knockdown efficiency checked by RT-PCR (n = 5). g, Flow cytometry and quantification of Ca2+-bound Fluo-4 level (n = 3). h, Flow cytometry and quantification of free unbound Fura-2 level (n = 3). i, Working model of effect of SCFAs on cAMP level in CD8+ T cells (n = 5). The figure was generated using BioRender. j, pH level of B16F10 tumor-bearing mouse serum (left) and TIF (right) (n = 4). k, Serum pH level of 10 lymphoma patients that have undergone commercial CAR-T cell therapy. Each patient has blood collections at 4 different timepoints (detailed information can be found in Supplementary Table 8). l, pH levels of TVA and CON diet. m, Medium pH level with different doses of TVA. Data are mean ± SD (a, c-k). Student’s two-sided unpaired t test (a, c-k). Source Data
Extended Data Fig. 12
Extended Data Fig. 12. TVA-enhanced CD8+ T cell function independent of pH sensor GPR65.
a, Gpr65 knockdown efficiency in CD8+ T cells was checked by RT-PCR (left) (n = 5). Effect of Gpr65 transient knockdown on TNF-α (middle left), IFN-γ (middle right), and p-CREB (right) levels (n = 3) in mouse CD8+ T cells treated with or without TVA were shown. b, Knockout efficiency of Gpr65 in Cas9;OT-I cells was checked by RT-PCR (left) (n = 4). Effect of Gpr43 knockout with two different sgRNAs on TNF-α (middle left), IFN-γ (middle right), and p-CREB (right) levels (n = 3) in mouse Cas9;OT-I cells treated with or without TVA were shown. c, Effects of Gpr65 transient knockdown on p-CREB levels in mouse CD8+ T cells treated with or without TVA under different pH (n = 3). d, Cas9;OT-I cells (5 × 10⁶) transduced with non-targeting control sgRNA or sgRNA against Gpr65 were transferred into mice at day 6 after engraftment of B16-OVA followed by analyses of tumor size. Non-treatment control mice received no transfer of T cells, control sgRNA OT-I and control sgRNA OT-I + TVA are the same as described in Fig. 4f because results shown in Fig. 4f and Extended Data Fig. 12d are from the same experiment (n = 8). e, Working model of effect of TVA on cAMP level in CD8+ T cells treated with SCFAs (n = 5). The figure was generated using BioRender. f, g, Effect of treatment with 20 µM TVA on human bulk T cells HD501 (f) and HD505 (g) exhaustion induced by purified PD-L1, assessed by IL-2 production levels (n = 4). h, i, Effect of treatment with 20 µM TVA on human CD8+ T cell exhaustion induced by purified PD-L1, assessed by IL-2 (h) and TNF-α (i) levels (n = 4). j, k, Effect of treatment with 20 µM TVA on mouse primary T cell exhaustion induced by co-cultured B16F10 cells expressing PD-L1 (B16F10 PD-L1+), assessed by IL-2 (j) and TNF-α (k) levels (n = 4). l, m, Effect of treatment with 20 µM TVA on mouse CD8+ T cells exhaustion induced by co-cultured B16F10 cells expressing PD-L1 (B16F10 PD-L1+), assessed by IL-2 (l) and TNF-α (m) levels (n = 4). n, Effect of treatment with 20 µM TVA on expansion of anti-CD19-CD28z CAR-T cells derived from lymphoma patients in vitro. o, Working model. The figure was generated using BioRender. Data are mean ± SD (a-c, e-m) or mean ± s.e.m (d). Student’s two-sided unpaired t test (a-c, e-m) or two-way ANOVA (d). Source Data

References

    1. Jamiol-Milc D, Stachowska E, Janus T, Barcz A, Chlubek D. Trans fatty acids (elaidic and vaccenic) in the human milk. Pomeranian J. Life Sci. 2015;61:58–63. - PubMed
    1. Te Morenga L, Montez JM. Health effects of saturated and trans-fatty acid intake in children and adolescents: Systematic review and meta-analysis. PLoS ONE. 2017;12:e0186672. doi: 10.1371/journal.pone.0186672. - DOI - PMC - PubMed
    1. Sommerfeld M. Trans unsaturated fatty acids in natural products and processed foods. Prog. Lipid Res. 1983;22:221–233. doi: 10.1016/0163-7827(83)90010-3. - DOI - PubMed
    1. Turpeinen AM, et al. Bioconversion of vaccenic acid to conjugated linoleic acid in humans. Am. J. Clin. Nutr. 2002;76:504–510. doi: 10.1093/ajcn/76.3.504. - DOI - PubMed
    1. Santora JE, Palmquist DL, Roehrig KL. Trans-vaccenic acid is desaturated to conjugated linoleic acid in mice. J. Nutr. 2000;130:208–215. doi: 10.1093/jn/130.2.208. - DOI - PubMed

MeSH terms