. 2023 Dec;30(1):2284683.
doi: 10.1080/10717544.2023.2284683. Epub 2023 Nov 22.

Spray-dried nanocrystal-loaded polymer microparticles for long-term release local therapies: an opportunity for poorly soluble drugs

Affiliations

Spray-dried nanocrystal-loaded polymer microparticles for long-term release local therapies: an opportunity for poorly soluble drugs

Carlos Rodríguez-Nogales et al. Drug Deliv. 2023 Dec.

Abstract

Nano- and micro-technologies can salvage drugs with very low solubility that were doomed to pre-clinical and clinical failure. A unique design approach to develop drug nanocrystals (NCs) loaded in extended release polymeric microparticles (MPs) for local treatments is presented here through the case of a potential osteoarthritis (OA) drug candidate for intra-articular (IA) administration. Optimizing a low-shear wet milling process allowed the production of NCs that can be subsequently freeze-dried (FD) and redispersed in a hydrophobic polymer-organic solvent solution to form spray-dried MPs. Results demonstrated a successful development of a ready-to-upscale formulation containing PLGA MPs with high drug NC encapsulation rates that showed a continuous and controlled drug release profile over four months. The screenings and procedures described allowed for identifying and overcoming common difficulties and challenges raised along the drug reduction to nano-size and spray-drying process. Above all, the technical knowledge acquired is intended for formulation scientists aiming to improve the therapeutic perspectives of poorly soluble drugs.

Keywords: Osteoarthritis; PLGA; microparticles; nanocrystals; spray-drying.


Conflict of interest statement

No potential conflict of interest was reported by the authors. Gaby Thonus owns subscription rights of Galapagos. Sam Corveleyn and Joke Meeus are employee of Galapagos and own subscription rights in the company.

Figures

None
Graphical abstract
Figure 1.
Figure 1.
Wet milling screening and API/s ratio optimization. (A) PSD Dv50 and Dv90 values after 72 h wet milling of formulations containing TPGS, P407, P188, and T80 at API/s ratio 1/0.05. (B) PSD Dv50 and Dv90 values results after wet milling + resuspension of FD formulations containing TPGS and P407 at 2 API/s ratios. n = 1.
Figure 2.
Figure 2.
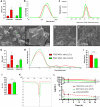
Complete characterization for the two selected GLPG0555 NCs (TPGS API/s ratio 1/0.1 and P407 API/s ratio 1/0.05 formulation conditions are shown in red and green, respectively). (A) Dv50 and Dv90 PSD values of fresh formulations measured by laser diffraction. (B) Particle population distribution by intensity representative peak curves of fresh formulations measured by DLS. (C) Representative zeta potential distribution curves of fresh formulations. (D) SEM representative micrographs of the initial GLPG0555, washed TPGS-stabilized NCs (E), and P407-stabilized NCs (F). Magnification is 10,000x. (G) Dv50 and Dv90 PSD values were measured by laser diffraction of FD NCs after resuspension in Milli-Q water. (H) PSD representative graphs by volume density obtained by laser diffraction of FD NCs after resuspension in Milli-Q water. (I) Total GLPG0555 recoveries after wet milling, sample harvesting, and freeze-drying. (J) Total GLPG0555 content of the NCs quantified by UHPLC. (K) Representative thermograms of the initial GLPG0555 and the NCs measured by DSC. Fusion transition events occurred around 220–230 °C. (L) Dissolution profile of GLPG0555 in both PBS (dotted lines) and in the ‘MPs release study’ medium (continuous lines). GLPG0555 was quantified by UHPLC. All results are represented by the mean ± sd (n ≥ 3, *p < 0.05, **p < 0.01, ***p < 0.001, and ****p < 0.0001); ns means non-significant.
Figure 3.
Figure 3.
Interaction of the FD TPGS (API/s ratio 1/0.1) and P407 (API/s ratio 1/0.05) GLPG0555 NCs, in red and green, respectively, with the SP feed solution. (A) Normalized enthalpies of fusion (ΔH) of the NCs were analyzed by DSC. Polymer reference used was PLGA 753H (concentration 7.5% w/v) and TDL for NCs was 25% w/w. Results are the mean ± s.d. (n = 3). (B) PSD was analyzed by laser diffraction after resuspension of the FD NCs formulations in two different ACE mixtures. Resuspension of NCs in Milli-Q water was used as a reference control. For PSD only D[3;2] (µm) values are shown. Results are the mean ± s.e.m. (n = 3).
Figure 4.
Figure 4.
(A) PSD representative graphs of MPs by volume density obtained by laser diffraction. SEM representative micrographs of (B) blank 753H MPs, (C) TPGS NCs-753H MPs, (D) P407 NCs-753H MPs, and (E) TPGS NCs-753H MP cross section. Magnifications are 4500x and 9000x for the cross-section MP. (F) Representative thermograms of the TPGS and P407 NCs loaded in the 753H MPS analyzed by DSC. Fusion transition events occurred around 200–230 °C. (G) Efficacies of encapsulation (EE), expressed as a percentage. Values are the mean ± s.d. (n = 3). (H) Yields expressed as a percentage (100% is the initial mass weighted). n = 1. (I) PSD measured by laser diffraction after MPs resuspension. Only Dv50 and Dv90 (dotted) values are shown, n = 1. For F–H, three polymers (653H, 753H, and 203H) and two GLPG0555 NCs (TPGS API/s ratio 1/0.1, in red and P407 API/s ratio 1/0.05, in green) are shown.
Figure 5.
Figure 5.
Optimization of SP 753H polymer MPs loaded with TPGS (API/s ratio 1/0.1) GLPG0555 NCs: polymer concentration (% w/v) vs. TDL (% w/w). (A) SEM representative micrographs. Magnification is 4500x. (B) Efficacies of encapsulation (EE) expressed as a percentage. Data is the mean ± s.d. (n = 3). (C) Yields vs. dv90. Yields are expressed as a percentage (100% is the initial mass weighted). Dv90 values are measured by laser diffraction after MPs resuspension. (D) Cumulative drug release profiles (%) over four months. Data is the mean ± s.d. (n = 3). (E) Summary of fit plot (partial least squares regression model) for seven responses. Only R2 and Q2 values are shown. (F) Sweet spot plot. Met criteria response value limits were: yield > 30, Dv90 < 60 µm, burst release < 20%, 28 d release 10–50%, 56 d release 35–70%, 84 d release 50–90% and 112 d release > 80%. Data was plotted with MODDE 12.1. (Sartorius, Göttingen, Germany), using a ‘full factorial 2 levels’ orthogonal (balanced) design with all combinations of the factor levels. Main effects and all interactions are clear of each other (not confounded). n° experiments = 7 and n = 1.
Figure 6.
Figure 6.
GLPG0555 cumulative release in percentage vs. time for seven MPs formulations containing different polymers. Data is the mean ± s.d. (n = 3). The resulting curves were fitted using different models: zero and first order, Higuchi, Hixson, and Korsmeyer–Peppas (K.P). Best model fits calculated according to the higher R2 values are shown.
Figure 7.
Figure 7.
SEM representative micrographs of four MPs formulations kept under the same conditions of the release studies. Day 0 corresponds to the freshly prepared MPs. At days 28, 56, 84, and 112, samples were withdrawn, FD and kept at 2–8 °C before SEM sample preparation. (A) TPGS NCs-653H MPs; (B) TPGS NCs 753H MPs; (C) P407 NCs-753H MPs, and (D) TPGS NCs-203H MPs. Magnification is 4500x.

Similar articles

Cited by

References

    1. Amidon GL, Lennernäs H, Shah VP, Crison JR. (1995). A theoretical basis for a biopharmaceutic drug classification: the correlation of in vitro drug product dissolution and in vivo bioavailability. Pharm Res 12:1–14. doi: 10.1023/A:1016212804288. - DOI - PubMed
    1. Barbosa-Alfaro D, Andrés-Guerrero V, Fernandez-Bueno I, et al. (2021). Dexamethasone PLGA microspheres for sub-tenon administration: influence of sterilization and tolerance studies. Pharmaceutics 13:228. doi: 10.3390/PHARMACEUTICS13020228. - DOI - PMC - PubMed
    1. Bodratti AM, Alexandridis P. (2018). Formulation of poloxamers for drug delivery. J Funct Biomater 9:11. doi: 10.3390/JFB9010011. - DOI - PMC - PubMed
    1. Bonhoeffer B, Kordikowski A, John E, Juhnke M. (2022). Numerical modeling of the dissolution of drug nanocrystals and its application to industrial product development. Admet DMPK 10:253–87. doi: 10.5599/ADMET.1437. - DOI - PMC - PubMed
    1. Ferrar JA, Sellers BD, Chan C, Leung DH. (2020). Towards an improved understanding of drug excipient interactions to enable rapid optimization of nanosuspension formulations. Int J Pharm 578:119094. doi: 10.1016/J.IJPHARM.2020.119094. - DOI - PubMed