Enhancement of efferocytosis through biased FPR2 signaling attenuates intestinal inflammation
- PMID: 37994307
- PMCID: PMC10701612
- DOI: 10.15252/emmm.202317815
Enhancement of efferocytosis through biased FPR2 signaling attenuates intestinal inflammation
Abstract
Efficient clearance of dying cells (efferocytosis) is an evolutionarily conserved process for tissue homeostasis. Genetic enhancement of efferocytosis exhibits therapeutic potential for inflammation resolution and tissue repair. However, pharmacological approaches to enhance efferocytosis remain sparse due to a lack of targets for modulation. Here, we report the identification of columbamine (COL) which enhances macrophage-mediated efferocytosis and attenuates intestinal inflammation in a murine colitis model. COL enhances efferocytosis by promoting LC3-associated phagocytosis (LAP), a non-canonical form of autophagy. Transcriptome analysis and pharmacological characterization revealed that COL is a biased agonist that occupies a part of the ligand binding pocket of formyl peptide receptor 2 (FPR2), a G-protein coupled receptor involved in inflammation regulation. Genetic ablation of the Fpr2 gene or treatment with an FPR2 antagonist abolishes COL-induced efferocytosis, anti-colitis activity and LAP. Taken together, our study identifies FPR2 as a potential target for modulating LC3-associated efferocytosis to alleviate intestinal inflammation and highlights the therapeutic value of COL, a natural and biased agonist of FPR2, in the treatment of inflammatory bowel disease.
Keywords: FPR2; LC3-associated efferocytosis; columbamine; inflammatory bowel disease.
© 2023 The Authors. Published under the terms of the CC BY 4.0 license.
Conflict of interest statement
The authors declare that they have no conflict of interest.
Figures
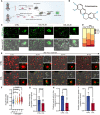
- A
Schematic overview of functional assay to monitor efferocytosis.
- B
Chemical structure of columbamine (COL).
- C
Representative images of BMDMs after co‐culturing CMFDA‐stained ACs with BMDMs (with or without treatment of COL) for 24 h (Green: CMFDA‐labeled‐ACs). Scale bar, 20 μm.
- D
Quantification of BMDMs based on the number of engulfed ACs (1–5 ACs, 6–10 ACs, 11–15 ACs, above 15 ACs).
- E
BMDMs were pretreated with vehicle or COL (10 μM) for 24 h, and the representative time‐lapse images at indicated time points were captured after treating with ACs (Green: CMFDA‐labeled‐ACs, Red: LysoTracker). Scale bar, 20 μm.
- F
Quantification of relative engulfment ability for BMDMs with or without pre‐treatment of COL (10 mg/kg body weight) (n = 3).
- G
Relative CMFDA intensity after co‐culturing BMDMs (with or without COL pretreatment) with CMFDA‐labeled ACs (n = 11 or 12).
- H, I
Relative positive CMFDA events in livers and spleens in mice with or without COL treatment after injecting CMFDA‐ACs (n = 6).
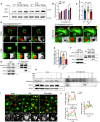
- A
Representative WB images of LC3 in BMDMs after AC treatment for the indicated times.
- B
Quantification of LC3‐II expression (n = 3 biological replicates).
- C
Comparison of engulfment ability of macrophages after pre‐treating with 3‐MA (5 mM) or not. In the COL‐treated group, COL (1 μM) was added for 2 h followed by addition of ACs (n = 18).
- D
Representative images of LC3‐associated phagocytosis after pHrodo‐SE labeled‐ACs incubated with GFP‐LC3 BMDMs at the indicated time points. The 3‐MA (5 mM) were used for pre‐treatment for 30 min, and COL (1 μM) was added for 2 h followed by addition of ACs. Green: GFP‐LC3; Red: pHrodo‐SE. Scale bar, 10 μm.
- E
Quantification of LAP efficiency in GFP‐LC3‐BMDMs after different treatment (n = 3).
- F, G
Cell lysates of BMDMs (pre‐treated with 1 μM COL or not) treated with ACs were subjected to co‐IP by a Vps34 or Rubicon antibody and followed by WB analysis using the indicated antibodies.
- H
Cell lysates of ACs and BMDMs that treated with or without ACs were subjected to co‐IP by a Rubicon antibody and followed by WB analysis using the indicated antibodies. The BMDM were pre‐treated with vehicle, COL (1 μM), or 3‐MA (5 mM).
- I
Representative fluorescent images of GFP‐LC3 BMDMs treated with ACs. The BMDMs were pre‐stained with LysoTracker Red for 30 min, then treated with vehicle or 3‐MA (5 mM) for 30 min. The COL (1 μM) was added for another 2 h.
- J
Line profiles of intensity of GFP and LysoTracker Red fluorescent value along the yellow line in (I).
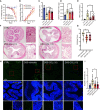
- A, B
Mice were treated with vehicle, 10 mg/kg COL (COL (10)), or 15 mg/kg COL (COL (15)), and quantification of daily body weight and DAI alteration during DSS treatment were recorded (n = 7–11).
- C, D
Quantification of colon length and spleen weight after indicated treatments (n = 7–11).
- E
MPO activity determination in different groups (n = 7–10).
- F
Representative images of HE staining. Scale bar, 200 μm.
- G
Comparison of histology score based on the observations of HE staining images (n = 9–10).
- H
Representative images of TUNEL staining of colon tissue in different groups. Green: TUNEL positive area; Blue: DAPI staining. Scale bar, 200 μm.
- I
Apoptotic cell index analysis (n = 5 in CTRL, n = 10 in other groups).

- A
Schematic overview of macrophages depletion in vivo via clodronate‐liposome injection (n = 7–8). Mice were injected with PBS‐ or clodronate‐liposome for 3 days before DSS administration. After DSS treatment, liposomes were injected at the 4th and 5th days, and COL or vehicle were injected daily via i.p.
- B, C
Comparison of liver and spleen weight index (n = 7–8).
- D, E
Comparison of colon length and body weight, respectively, during DSS treatment (n = 7–8).
- F
Comparison of DAI alteration after different treatment (n = 7–8).
- G, H
Histological studies of colon tissue.

- A, B
Transcriptomic analysis of macrophages with or without COL treatment. (A) Heat map analysis of the up‐regulated genes in COL‐treated macrophages. (B) Gene Ontology (GO) enrichment analysis of COL‐induced upregulated genes in macrophages.
- C–G
Comparison of selected mRNA expression levels in IBD patients' peripheral blood mononuclear cells from the GEO profiles of GDS1615/210773, GDS1615/210279, GDS1615/221469, GDS1615/206083, and GDS1615/210659 (n = 26–59).
- H
Comparison of efferocytosis ability in macrophages with or without FPR2 antagonist (WRW4) treatment (n = 6, three images were selected in each sample). WRW4 (30 μM) was given for 30 min, followed by COL (1 μM) treatment for another 2 h. Three replicated experiments.
- I, J
Positive CMFDA events in livers (I) and spleens (J) of mice with or without COL treatment after injecting CMFDA‐ACs (n = 6). WRW4 was injected 30 min prior to COL administration and 6 h after ACs injection.

- A
Comparison of engulfment ability of macrophages in different groups (n = 15).
- B
Relative CMFDA intensity after co‐culturing BMDMs with CMFDA‐labeled ACs. BMDMs were pretreated with 1 μM COL for 2 h (n = 8–9).
- C, D
Comparison of daily body weight and DAI alteration, respectively, during DSS treatment in different groups (n = 5 in control groups, n = 7–9 in model groups).
- E
Comparison of colon length after different treatment (n = 5 in control groups, n = 7–9 in model groups).
- F
Comparison of myeloperoxidase (MPO) activity in tissues among groups (n = 5 in control groups, n = 7–9 in model groups).
- G
Representative images after HE staining; Scale bar, 200 μm.
- H
Comparison of histology score based on the HE staining images (n = 8–9).
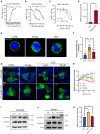
The dose‐response curves of COL and WKYMVm (W‐pep)‐induced calcium mobilization in FPR2‐RBL cells (n = 3).
The dose‐response curves of COL and W‐pep‐induced inhibition of forskolin‐stimulated cAMP accumulation in FPR2‐expressing cells (n = 3).
The dose‐response curves of COL and COL plus WRW4‐induced inhibition of forskolin‐stimulated cAMP accumulation in FPR2‐expressing cells (n = 3). WRW4 (30 μM) was added 30 min prior to COL treatment.
Effect of COL for inhibition of cAMP responses with or without WRW4 treatment (n = 3). EC50 were calculated by Prism software.
Representative GFP‐FPR2 images after treating GFP‐FPR2‐RBL cells with COL (10 μM) or W‐pep (0.1 μM) (n = 9). Scale bar, 5 μm.
Quantification of GFP‐FPR2 dots that distributed in the cytoplasm.
Representative images to show GFP‐β‐arrestin recruitment in HEK293 cells transfected with GFP‐β‐arrestin plasmid or GFP‐β‐arrestin combined with FPR2 plasmids after W‐pep (0.1 μM) or COL treatment for 30 min. Scale bar, 20 μm.
Relative intensity of GFP‐β‐arrestin based on the plot profile (n = 6–8). Higher peak intensity enriched in a short distance indicates stronger membrane recruitment capacity.
GTP‐RAC1 levels in FPR2‐RBL cells after COL (1 μM) or W‐pep (0.1 μM) treatment for 10 min.
Levels of GTP‐RAC1 in BMDMs after COL (1 μM) treatment for 10 min with or without WRW4 pre‐treatment (30 μM, 30 min).
Quantification of Western blot analysis of GTP‐RAC1 level (n = 4).
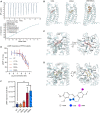
Measurement of the binding between COL (200 μM) and FPR2 (20 μM) by Isothermal titration calorimetry.
Comparison of ligand binding poses in FPR2 including COL (left, docking prediction), LXA4 (middle, docking prediction), and WKYMVm (right, PDB ID: 6LW5). COL occupied a horizonal pose in FPR2 similar to LXA4 but different from the vertical pose of WKYMVm. The ligands are shown in sphere and sticks. FPR2 is shown as cyan ribbons.
Detailed interactions between COL and amino acids in the FPR2 binding pocket, viewed from transmembrane side (left, side view) and extracellular side (right, top view). The polar connections between COL and FPR2 are composed of D106, R205, and S288, and the hydrophobic interactions involve H102, V105, L109, F110, W254, F257, F292, and the guanidino group of R205.
Detailed interactions between LXA4 and amino acids in the FPR2 binding pocket. Hydrophobic interactions between LXA4 and FPR2 involve L81, H102, V105, L109, F110, W254, F257, F292. Besides the hydrogen network of D106‐R201‐R205, S288 is important for recognition of LXA4 by FPR2. The polar interactions are indicated as red dashed lines. The atoms of COL participated in polar interaction with FPR2 were highlighted and colored inset on the chemical structure.
Dose–response curve of COL‐induced inhibition of cAMP production in HEK293 cells expressing different FPR2 mutants (n = 3).
Median effective concentration of COL for inhibition of cAMP responses in cells expressing the FPR2 mutants (n = 3).

- A
Representative images of LC3‐associated phagocytosis after pHrodo‐SE labeled‐ACs incubated with GFP‐LC3 BMDMs at the indicated time points. BMDMs were pre‐treated with 3‐MA (5 mM) or not for 30 min, and COL (1 μM) was added for another 2 h followed by addition of ACs. Green: GFP‐LC3; Red: pHrodo‐SE. Scale bar, 10 μm.
- B
Quantification of LAP efficiency in GFP‐LC3‐BMDMs after different treatment (n = 5).
- C, D
Cell lysates of BMDMs treated with ACs were subjected to co‐IP by a VPS34 or RUBICON antibody and followed by WB analysis using the indicated antibodies, respectively. BMDM were pre‐treated with WRW4 (30 μM) or COL (1 μM).
- E
Representative images of RAW 264.7 cells that transiently transfected with GFP‐C1‐PLCdelta‐PH after treating with COL (1 μM) or not. In WRW4 treated groups, WRW4 (30 μM) were treated for 30 min before adding COL. Red arrow indicates the pseudopodia with high dynamics.
- F
Quantification of filopodia length alteration in different groups using Image J.
- G
Quantification of relative speed of filopodia movement in different groups using Image J. Values are shown in box‐and‐whisker plots and the line in the box corresponds to the median. The boxes go from the upper to the bottom quartiles, and the whiskers go from the minimum to the maximum value (n = 14–19).
- H
Representative images of GFP‐LC3 BMDMs treated with ACs. BMDMs were pre‐stained with LysoTracker Red for 30 min and pre‐treated with WRW4 (30 μM) for another 30 min in WRW4‐treated groups. ACs were added after COL (1 μM) were treated for another 2 h.
- I
Line profiles of intensity of GFP and LysoTracker Red fluorescent value along the yellow line in (H).
References
-
- Allouche A (2012) Software news and updates Gabedit—a graphical user interface for computational chemistry softwares. J Comput Chem 32: 174–182 - PubMed
-
- Bader JE, Enos RT, Velázquez KT, Carson MS, Nagarkatti M, Nagarkatti PS, Chatzistamou I, Davis JM, Carson JA, Robinson CM et al (2018) Macrophage depletion using clodronate liposomes decreases tumorigenesis and alters gut microbiota in the AOM/DSS mouse model of colon cancer. Am J Physiol Gastrointest Liver Physiol 314: G22–G31 - PMC - PubMed
-
- Balzola F, Cullen G, Hoentjen F, Ho GT, Russell R (2013) Formylpeptide receptor‐2 contributes to colonic epithelial homeostasis, inflammation, and tumorigenesis. Inflamm Bowel Dis Monit 13: 156
Publication types
MeSH terms
Associated data
Grants and funding
- 82271455/National Natural Science Foundation of China
- 32070950/National Natural Science Foundation of China
- 82200585/National Natural Science Foundation of China
- 82104183/National Natural Science Foundation of China
- SGDX20210823103804030/Shenzhen Fundamental Research Program
- 2020B1212030006/The 2020 Guangdong Provincial Science and Technology Innovation Strategy Special Fund
- 2022A1515012416/The Guangdong Basic and Applied Basic Research Foundation
- 0025/2022/A1/The Science and Technology Development Fund, Macau SAR
- 0128/2019/A3/The Science and Technology Development Fund, Macau SAR
- GXWD20201231105722002-20200831175432002/The Science Technology and Innovation Commission of Shenzhen Municipality
- JCYJ20200109150019113/The Science Technology and Innovation Commission of Shenzhen Municipality
- MYRG2022-00094-ICMS/The University of Macau grants
LinkOut - more resources
Full Text Sources
Research Materials

