. 2024 Jan;28(1):e18021.
doi: 10.1111/jcmm.18021. Epub 2023 Nov 23.

Machine learning-derived identification of prognostic signature for improving prognosis and drug response in patients with ovarian cancer

Affiliations

Machine learning-derived identification of prognostic signature for improving prognosis and drug response in patients with ovarian cancer

Qing Huan et al. J Cell Mol Med. 2024 Jan.

Abstract

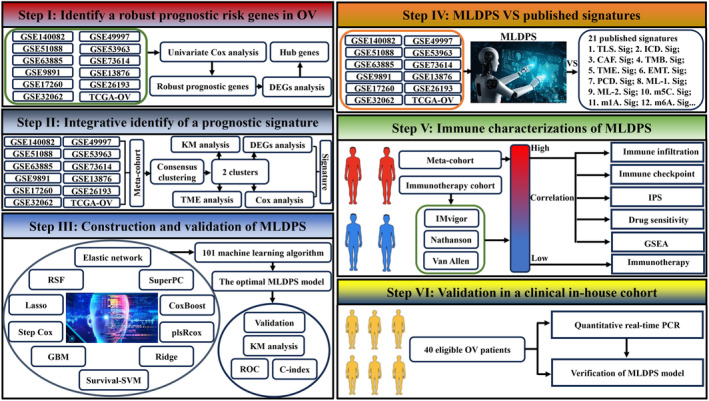
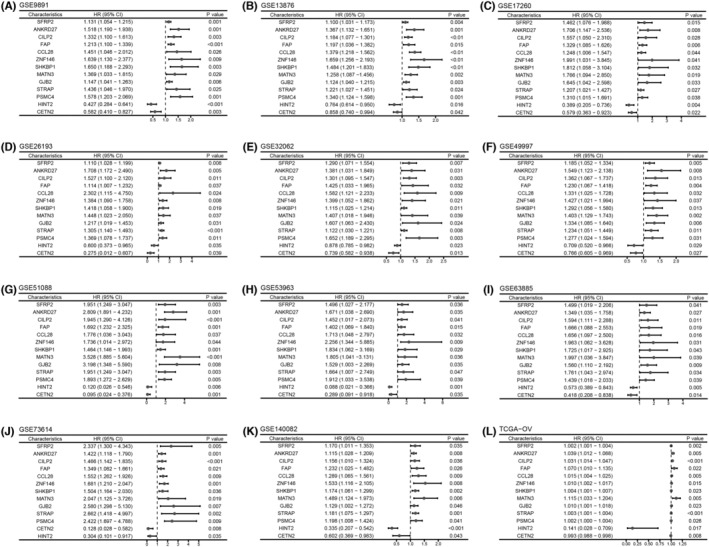
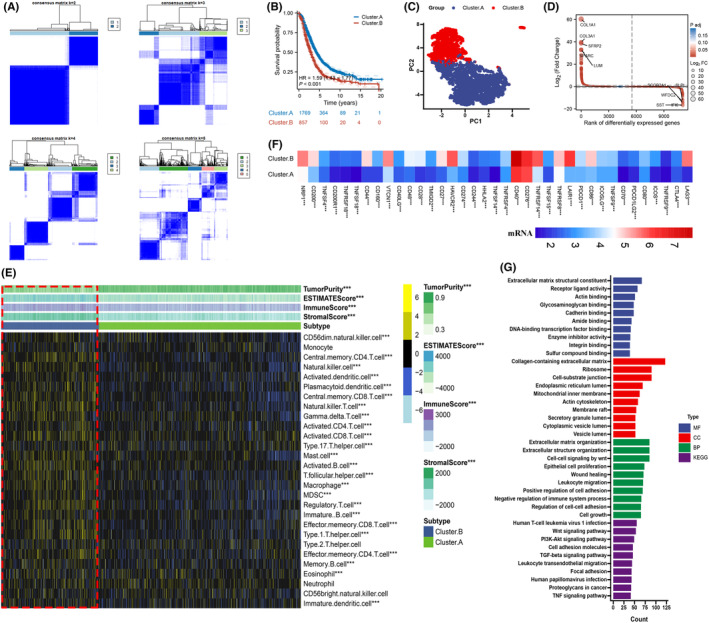
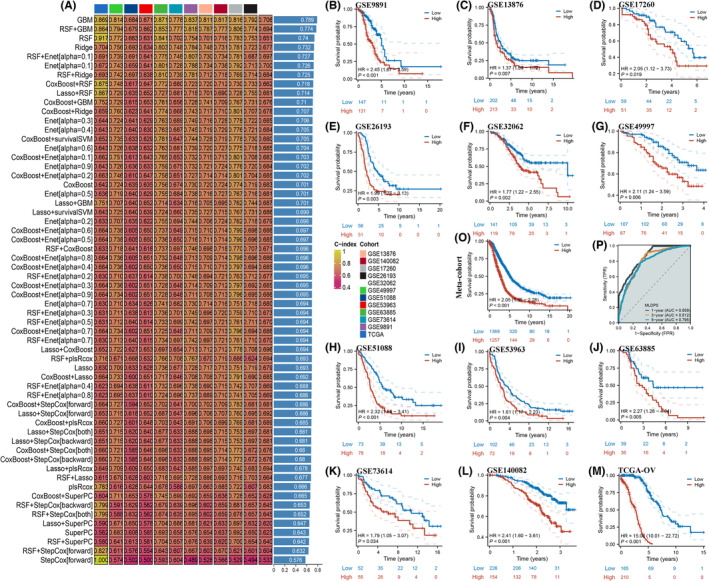
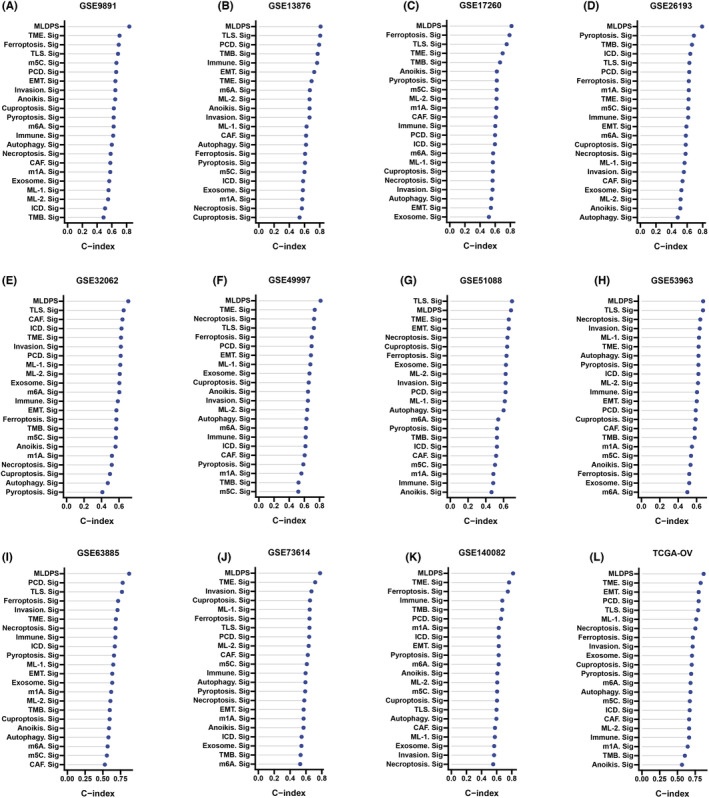
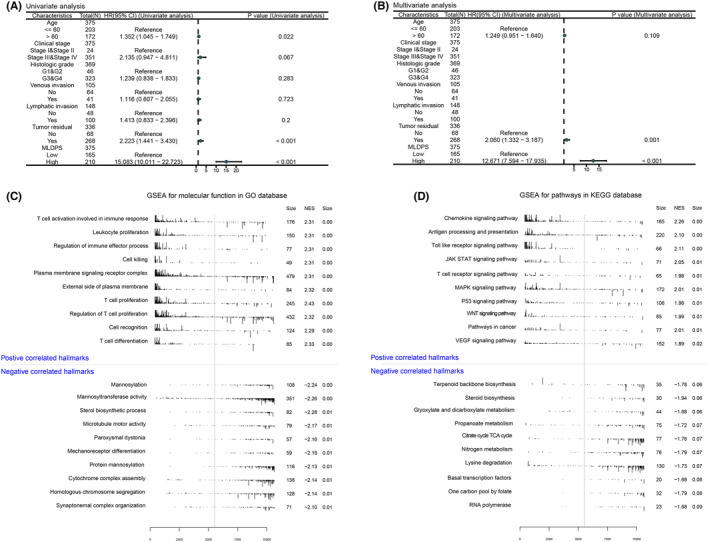
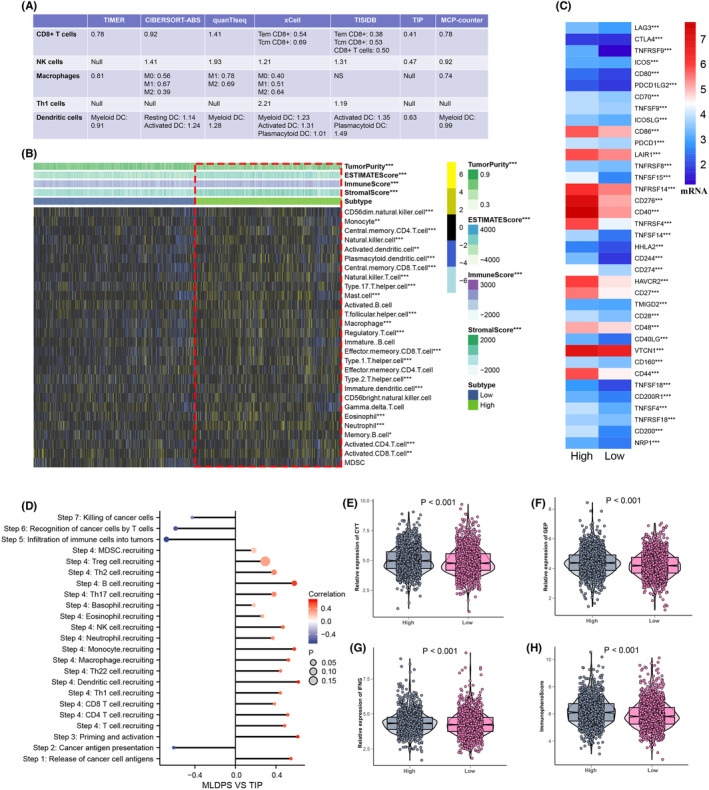
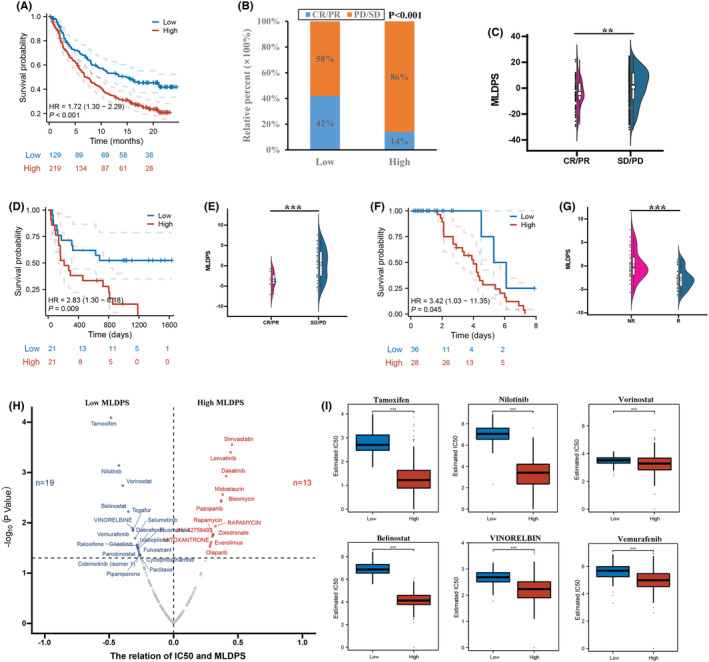
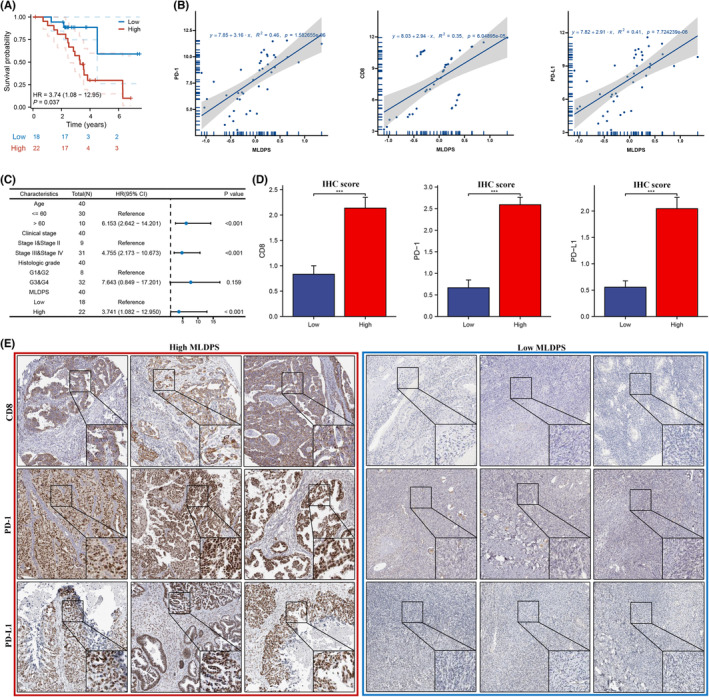
Clinical assessments relying on pathology classification demonstrate limited effectiveness in predicting clinical outcomes and providing optimal treatment for patients with ovarian cancer (OV). Consequently, there is an urgent requirement for an ideal biomarker to facilitate precision medicine. To address this issue, we selected 15 multicentre cohorts, comprising 12 OV cohorts and 3 immunotherapy cohorts. Initially, we identified a set of robust prognostic risk genes using data from the 12 OV cohorts. Subsequently, we employed a consensus cluster analysis to identify distinct clusters based on the expression profiles of the risk genes. Finally, a machine learning-derived prognostic signature (MLDPS) was developed based on differentially expressed genes and univariate Cox regression genes between the clusters by using 10 machine-learning algorithms (101 combinations). Patients with high MLDPS had unfavourable survival rates and have good prediction performance in all cohorts and in-house cohorts. The MLDPS exhibited robust and dramatically superior capability than 21 published signatures. Of note, low MLDIS have a positive prognostic impact on patients treated with anti-PD-1 immunotherapy by driving changes in the level of infiltration of immune cells. Additionally, patients suffering from OV with low MLDIS were more sensitive to immunotherapy. Meanwhile, patients with low MLDIS might benefit from chemotherapy, and 19 compounds that may be potential agents for patients with low MLDIS were identified. MLDIS presents an appealing instrument for the identification of patients at high/low risk. This could enhance the precision treatment, ultimately guiding the clinical management of OV.

Keywords: immunotherapy; machine learning; ovarian cancer; tumour microenvironment.


Conflict of interest statement

The authors have no conflict of interest to declare.

Figures

FIGURE 1
FIGURE 1
The workflow of this study.
FIGURE 2
FIGURE 2
Identification of robust prognostic risk genes in ovarian cancer using multiple data sets. (A) GSE9891, (B) GSE13876, (C) GSE17260, (D) GSE26193, (E) GSE32062, (F) GSE49997, (G) GSE51088, (H) GSE53963, (I) GSE63885, (J) GSE73614, (K) GSE140082 and (L) TCGA‐OV.
FIGURE 3
FIGURE 3
Development of consensus clusters based on 11 genes in a meta‐cohort. (A) The consensus score matrix of all samples when k = 2. (B) K‐M analysis of OS difference between the two clusters. (C) PCA analysis of difference between the two clusters. (D) DEGs between the two clusters. (E) The immune landscape between the two clusters. (F) The immune checkpoint expression between the two clusters. (G) Functional enrichment analysis of signature between the two clusters (*p < 0.05, **p < 0.01, ***p < 0.001).
FIGURE 4
FIGURE 4
An MLDPS was developed and validated using multiple machine‐learning algorithms. (A) A total of 101 combinations of machine‐learning algorithms for the MLDPS via a 10‐fold cross‐validation framework. The C‐index of each model was calculated across 12 data sets. (B–O) Kaplan–Meier survival analysis of OS between the high and low MLDPS groups in GSE9891 (B), GSE13876 (C), GSE17260 (D), GSE26193 (E), GSE32062 (F), GSE49997 (G), GSE51088 (H), GSE53963 (I), GSE63885 (J), GSE73614 (K), GSE140082 (L), TCGA‐OV (M), meta (O). (P) Time‐dependent ROC curves of 1‐year, 3‐year and 5‐year OS in the meta‐cohort.
FIGURE 5
FIGURE 5
Comparison between the MLDPS signature and other OV‐related signatures. (A–L) The C‐index of the MLDPS signature and other 21 signatures developed in the GSE9891, GSE13876, GSE17260, GSE26193, GSE32062, GSE49997, GSE51088, GSE53963, GSE63885, GSE73614, GSE140082 and TCGA‐OV.
FIGURE 6
FIGURE 6
Pathway analyses of MLDPS in OV. (A–B) Results of the univariate (A) and multivariate (B) Cox regression analyses regarding MLDPS in the TCGA cohort. (C–D) Exploration of the potential pathways of MLDPS using GSEA GO (C) and GSEA KEGG analyses (D).
FIGURE 7
FIGURE 7
Immune landscape of MLDPS. (A) Correlations between MLDPS and the infiltration levels of five tumour‐associated immune cells. (B) The immune landscape between the high and low MLDPS. (C) The immune checkpoint expression between the high and low MLDPS. (D) Correlations between MLDPS and cancer immunity. (E‐H) Box plot displaying the CYT, GEP, IFN‐γ and IPS between high and low MLDPS groups (*p < 0.05; **p < 0.01; ***p < 0.001).
FIGURE 8
FIGURE 8
Predictive value of the MLDPS in immunotherapy response. (A) K‐M analysis of OS difference between the high and low MLDPS in the IMvigor data set. (B‐C) Box plot displaying the MLDIS in patients with different immunotherapy responses in the IMvigor data set. (D) K‐M analysis of OS difference between the high and low MLDPS in the Nathanson data set. (E) Box plot displaying the MLDIS in patients with different immunotherapy responses in the Nathanson data set. (F) K‐M analysis of OS difference between the high and low MLDPS in the Van Allen data set. (G) Box plot displaying the MLDIS in patients with different immunotherapy responses in the Van Allen data set. (H) The results of correlation analysis of derived compounds and MLDPS. (I) Distribution of the first six drugs in the high and low MLDPS (*p < 0.05, **p < 0.01, ***p < 0.001).
FIGURE 9
FIGURE 9
Validation in a clinical in‐house cohort. (A) K‐M analysis of OS difference between the high and low MLDPS. (B) Scatter plot displaying the correlation between the MLDIS and CD8, PD‐1 and PD‐L1. (C) Univariate Cox analysis of OS in the in‐house data set. (D) Box plot displaying the IHC score levels of CD8, PD‐1 and PD‐L1 based on IHC staining (E) Representative IHC staining images of CD8, PD‐1 and PD‐L1 in MLDIS groups (*p < 0.05, **p < 0.01, ***p < 0.001).

Similar articles

Cited by

References

    1. Siegel RL, Miller KD, Wagle NS, Jemal A. Cancer statistics, 2023. CA Cancer J Clin. 2023;73(1):17‐48. doi:10.3322/caac.21763 - DOI - PubMed
    1. Lheureux S, Braunstein M, Oza AM. Epithelial ovarian cancer: evolution of management in the era of precision medicine. CA Cancer J Clin. 2019;69(4):280‐304. doi:10.3322/caac.21559 - DOI - PubMed
    1. Paffenholz SV, Salvagno C, Ho YJ, et al. Senescence induction dictates response to chemo‐ and immunotherapy in preclinical models of ovarian cancer. Proc Natl Acad Sci USA. 2022;119(5):e2117754119. doi:10.1073/pnas.2117754119 - DOI - PMC - PubMed
    1. Monk BJ, Enomoto T, Kast WM, et al. Integration of immunotherapy into treatment of cervical cancer: recent data and ongoing trials. Cancer Treat Rev. 2022;106:102385. doi:10.1016/j.ctrv.2022.102385 - DOI - PMC - PubMed
    1. Morand S, Devanaboyina M, Staats H, Stanbery L, Nemunaitis J. Ovarian cancer immunotherapy and personalized medicine. Int J Mol Sci. 2021;22(12):6532. doi:10.3390/ijms22126532 - DOI - PMC - PubMed