. 2024 Jan 25;52(2):e8.
doi: 10.1093/nar/gkad1118.

Modular cytosine base editing promotes epigenomic and genomic modifications

Affiliations

Modular cytosine base editing promotes epigenomic and genomic modifications

Julian Weischedel et al. Nucleic Acids Res. .

Abstract

Prokaryotic and eukaryotic adaptive immunity differ considerably. Yet, their fundamental mechanisms of gene editing via Cas9 and activation-induced deaminase (AID), respectively, can be conveniently complimentary. Cas9 is an RNA targeted dual nuclease expressed in several bacterial species. AID is a cytosine deaminase expressed in germinal centre B cells to mediate genomic antibody diversification. AID can also mediate epigenomic reprogramming via active DNA demethylation. It is known that sequence motifs, nucleic acid structures, and associated co-factors affect AID activity. But despite repeated attempts, deciphering AID's intrinsic catalytic activities and harnessing its targeted recruitment to DNA is still intractable. Even recent cytosine base editors are unable to fully recapitulate AID's genomic and epigenomic editing properties. Here, we describe the first instance of a modular AID-based editor that recapitulates the full spectrum of genomic and epigenomic editing activity. Our 'Swiss army knife' toolbox will help better understand AID biology per se as well as improve targeted genomic and epigenomic editing.


Figures

Graphical Abstract
Graphical Abstract
Figure 1.
Figure 1.
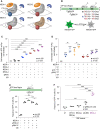
Loss in GFP improves depending on MEGA configuration. (A) Schematic representation of MEGA constructs. (B) (Upper panel) GFP-specific gRNAs were designed to span sequences where targeted C/G-to-T/A mutations create in-frame stop codons. (Lower panel) Successful editing leads to a loss in GFP fluorescence in HEK293T-GFP cells. (C) MEGA-1, -2, -3 and -4 dependent loss in GFP signal when using gRNA G1 and G2 simultaneously. Experiments were done with and without co-expression of UGI. (D) Editing of four different GFP loci resulted in varying levels of GFP loss. UGI enhanced the phenotype. (E) (Upper panel) Position of gRNA G1’ in relation to the position of gRNA G1. (Lower Panel) In the GFP disruption assay no strand bias was seen in the absence of UGI. Adding UGI showed a discrepancy in GFP disruption efficacy. (F) Comparing the efficacy to disrupt the GFP signal by MEGA-4 and three previously published CBEs. All results are normalized and shown as fold increase of GFP-negative population over non-transfected control HEK293T-GFP cells. Mean with standard deviation of three independent experiments is shown. Each data point represents one experiment. Three technical repeats were done per experiment. Statistical significance was calculated by a one-way ANOVA. WT hAID (wild type human Activation Induced Deaminase), AID*Δ (hyperactive truncated form of human AID), dCas9 (nuclease dead Cas9), UGI (Uracil Glycosylase Inhibitor). (* P ≤ 0.5, ** P ≤ 0.001, *** P ≤ 0.0001 and **** P ≤ 0.00001).
Figure 2.
Figure 2.
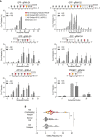
MEGA configuration impacts editing activity. (A) Sequencing histograms of the GFP amplicon visualise the editing outcome of each MEGA construct. Insertions, deletions and substitutions are shown in red, blue and purple, respectively. Protospacer regions are indicated with black errors and grey background. (B) Comparing targeted C-to-T editing frequency at GFP loci G1 and G2. Nucleotide numbering corresponds to their position relative to PAM sequence being at position 0. (C) Non-target base editing frequency is shown for each MEGA version at gRNA position G1 and G2. (D) Overall Indel and Substitution frequency for each MEGA configuration is shown. Experiments were done in triplicates and sequenced with a PacBio Sequel II machine. Mean with standard deviation of three independent experiments is shown. Three technical repeats were done per experiment. Statistical significance was calculated by a one-way ANOVA. (* P ≤ 0.5, ** P ≤ 0.001, *** P ≤ 0.0001 and **** P ≤ 0.00001).
Figure 3.
Figure 3.
Deamination occurs preferentially but not only at AID hotspots within protospacer. (A) C/G-to-T/A mutation frequency of six different loci is compared with and without UGI co-expression. Reference sequence with gRNA protospacer region, PAM sequence and C’s/G’s are highlighted. Nucleotide numbering corresponds to their position relative to PAM sequence being at position 0. Mean with standard deviation of three independent experiments are shown. (B) Comparison of editing frequency depending on sequence context across all six tested sites. AID (overlapping) hotspots were compared to Cs/Gs without AID-related sequence context and AID coldspots. Mean with standard deviation of three independent experiments is shown. Three technical repeats were done per experiment. Statistical significance was calculated by a one-way ANOVA. (* P ≤ 0.5 and ** P ≤ 0.001).
Figure 4.
Figure 4.
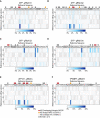
MEGA-4 shows high base editing diversity and Indel frequency. A-F) Editing of GFP locus G1 (A), GFP locus G2 (B), GFP locus G3 (C), GFP locus G4 (D), ATP1A1 locus A (E) and TP53BP1 locus B (F) with MEGA-4 and UGI. Heatmaps visualize the frequencies of all possible nucleotide substitutions at each position of the reference sequence. Reference bases were not considered and are greyed out. Mutations of G’s within the sense strand resulted from gRNAs targeting the antisense strand. gRNAs complementary to the antisense strand led to mutated C’s within the sense strand. Protospacer and PAM sequenced are highlighted. Coloured dots indicate specific sequence motifs within the quantification window. The mean of three independent experiments is shown. GFP loci G1–G4 were sequenced by PacBio single molecule long-read sequencing, while gene loci ATP1A1 and TP53BP1 were sequenced by Illumina Technology. A (adenosine), C (cytosine), G (guanosine), T (thymine).
Figure 5.
Figure 5.
MEGA-4 induces broad mutation pattern in murine variable heavy chain domain. (A) Individual plasmids encoding for MEGA-4, UGI and four different CDR-targeting gRNAs were electroporated into the murine B cell line CH12-F3. (B) Sequencing histogram of the variable heavy chain domain. Insertions, deletions, and substitutions are represented in red, blue and purple, respectively. (Upper Panel) MEGA-4 together with UGI and four gRNAs. (Lower Panel) WT S. pyogenes Cas9 with four gRNAs. CDR1–3 as well as the protospacer regions of each gRNA are highlighted. (C) Heatmaps represent targeted single base mutations around gRNA position V1, V2, V3 and V4. Reference sequences with highlighted protospacer region and PAM sequence are given for each locus. Coloured dots indicate specific sequence motifs within the quantification window. Three independent experiments were sequenced using Illumina technology. BCR (B Cell Receptor), CDR (Complementarity Determining Region), Pol Eta (polymerase eta), WT SpCas9 (wild type S. pyogenes Cas9).
Figure 6.
Figure 6.
Comparing primary mouse B cell somatic hypermutation with MEGA-4 and wild type Cas9 induced mutation spectrum. CH12-F3 cells mutated with MEGA-4 show similar mutation spectrum at the respective gRNA positions as primary mouse B cells. Wild type Cas9 only showed low level of substitutions. Some of which were gRNA independent. For comparison with primary cells, mouse B cells with the same germline sequence as the CH12-F3 were used.
Figure 7.
Figure 7.
MEGA-1 has low mutagenic but high epigenetic activity. (A) MEGA enables targeted demethylation of 5mC’s. Deaminated 5mC’s are recognized as T’s and will be replaced enzymatically with non-methylated C’s. (B) Schematic representation of targeted mouse MyoD enhancer region. The methylated AID hotspot is highlighted in red. Localisation of the MyoD gRNA is depicted. Pie charts underneath indicate the percentage of clones with methylated (blue slices) or unmethylated (empty slices) C’s. Nucleotide numbering refers to the PAM sequence being at position 0. (C) (Left panel) Frequency of genomic C-to-T mutations. (Right panel) Frequency of epigenomic demethylation. In total, 6–10 individual clones were analysed. (D) Relative MyoD gene expression normalized to housekeeping gene Actin B and then again normalized to non-transfected cells. MyoD gene expression was analysed 48 h post-transfection by RT qPCR. Each dot represents an independent experiment. Statistical significance was calculated by a one-way ANOVA and multiple comparison (** P ≤ 0.001). 5mC (5-methylcytosine), RT qPCR (real time quantitative PCR).

References

    1. Jinek M., East A., Cheng A., Lin S., Ma E., Doudna J.. RNA-programmed genome editing in human cells. eLife. 2013; 2:e00471. - PMC - PubMed
    1. Ran F.A., Hsu P.D., Wright J., Agarwala V., Scott D.A., Zhang F.. Genome engineering using the CRISPR-Cas9 system. Nat. Protoc. 2013; 8:2281–2308. - PMC - PubMed
    1. Jinek M., Chylinski K., Fonfara I., Hauer M., Doudna J.A., Charpentier E.. A programmable dual-RNA-guided DNA endonuclease in adaptive bacterial immunity. Science. 2012; 337:816–821. - PMC - PubMed
    1. Kosicki M., Tomberg K., Bradley A.. Repair of double-strand breaks induced by CRISPR–Cas9 leads to large deletions and complex rearrangements. Nat. Biotechnol. 2018; 36:765–771. - PMC - PubMed
    1. Sheppard E.C., Morrish R.B., Dillon M.J., Leyland R., Chahwan R.. Epigenomic modifications mediating antibody maturation. Front. Immunol. 2018; 9:355. - PMC - PubMed

MeSH terms